Finance Icons
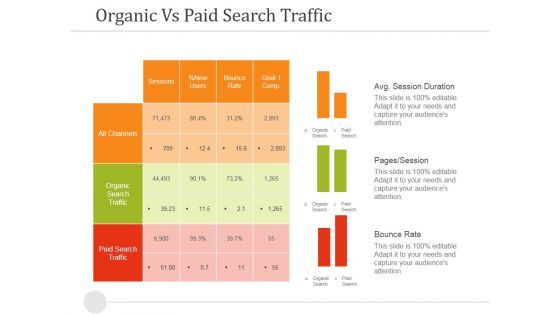
Organic Vs Paid Search Traffic Ppt PowerPoint Presentation Infographic Template Influencers
This is a organic vs paid search traffic ppt powerpoint presentation infographic template influencers. This is a three stage process. The stages in this process are avg session duration, pages session, bounce rate.
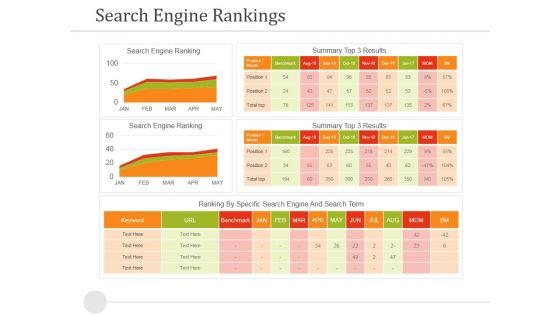
Search Engine Rankings Ppt PowerPoint Presentation Pictures Design Ideas
This is a search engine rankings ppt powerpoint presentation pictures design ideas. This is a two stage process. The stages in this process are search engine ranking, ranking by specific search engine and search term.
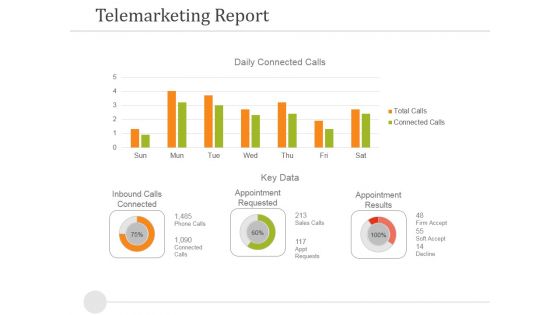
Telemarketing Report Template 1 Ppt PowerPoint Presentation Model Model
This is a telemarketing report template 1 ppt powerpoint presentation model model. This is a two stage process. The stages in this process are inbound calls connected, appointment requested, appointment results, key data.
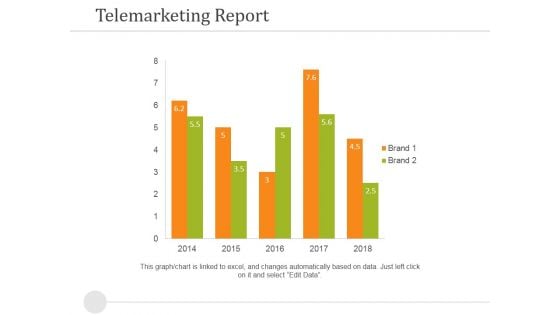
Telemarketing Report Template 2 Ppt PowerPoint Presentation Summary Inspiration
This is a telemarketing report template 2 ppt powerpoint presentation summary inspiration. This is a five stage process. The stages in this process are telemarketing report, business, marketing, success, strategy.
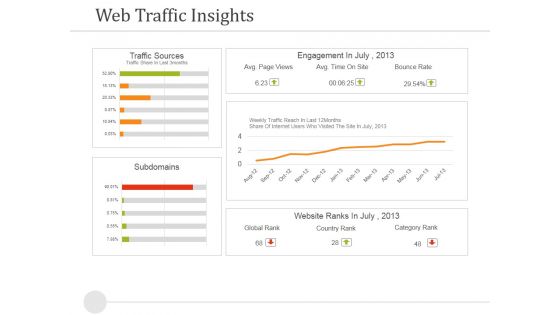
Web Traffic Insights Ppt PowerPoint Presentation Model Visual Aids
This is a web traffic insights ppt powerpoint presentation model visual aids. This is a two stage process. The stages in this process are traffic sources, engagement in, ranks in, subdomains.
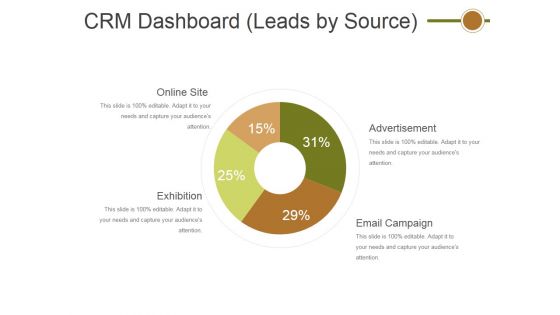
Crm Dashboard Leads By Source Ppt PowerPoint Presentation File Graphics Template
This is a crm dashboard leads by source ppt powerpoint presentation file graphics template. This is a four stage process. The stages in this process are online site, exhibition, advertisement, email campaign.
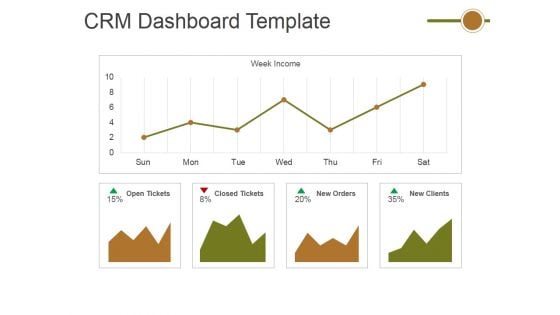
Crm Dashboard Template Ppt PowerPoint Presentation Gallery Shapes
This is a crm dashboard template ppt powerpoint presentation gallery shapes. This is a four stage process. The stages in this process are open tickets, closed tickets, new orders, new clients.
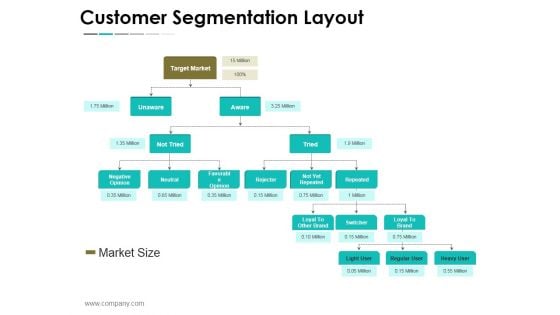
Customer Segmentation Layout Ppt PowerPoint Presentation Infographic Template Picture
This is a customer segmentation layout ppt powerpoint presentation infographic template picture. This is a five stage process. The stages in this process are target market, unaware, not tried, negative opinion, favorable, opinion, rejecter, not yet repeated, loyal to other brand, loyal to brand.
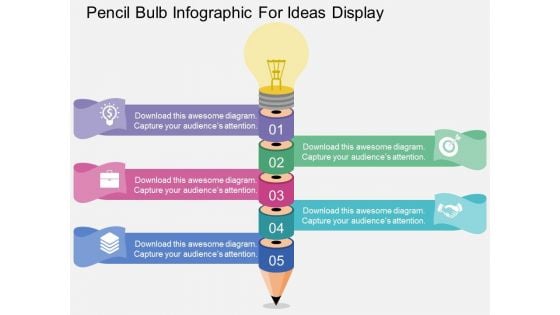
Pencil Bulb Infographic For Ideas Display Powerpoint Templates
This PowerPoint template contains pencil bulb Infographic. This diagram may be used to display ideas and strategies. This diagram slide will?link your ideas into a chain of thought and increase the strength of your overall concept.

Business Men On Gears Towards Success Trophy Powerpoint Templates
Our above slide contains diagram of business men on gears towards success trophy. It helps to exhibit strategy process and competition. Use this diagram to impart more clarity to data and to create more sound impact on viewers.
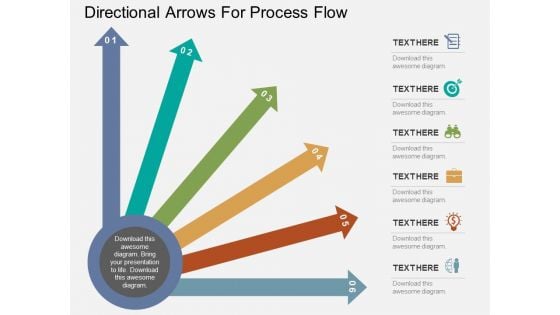
Directional Arrows For Process Flow Powerpoint Templates
This PPT slide has been designed with graphics of multi color arrows. This business diagram helps to exhibit directions for business process. Use this diagram to build an exclusive presentation.
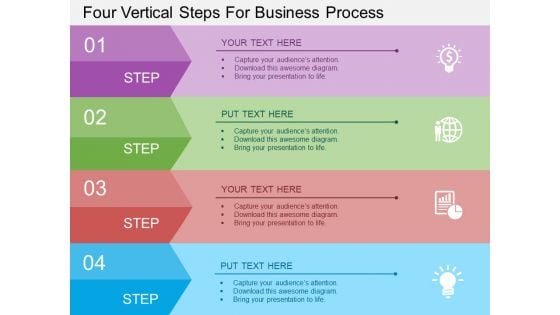
Four Vertical Steps For Business Process Powerpoint Template
Our above business diagram has been designed with graphics of four vertical tags. This business slide is suitable to present marketing planning. Use this business diagram to present your work in a more smart and precise manner.
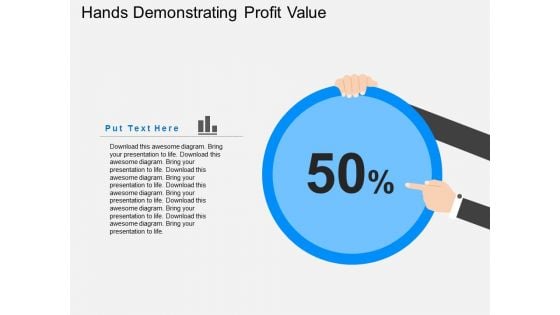
Hands Demonstrating Profit Value Powerpoint Templates
Our above slide contains diagram of zigzag arrow on monitor. It helps to display growth analysis and management. Use this diagram to impart more clarity to information and to create more sound impact on viewers.
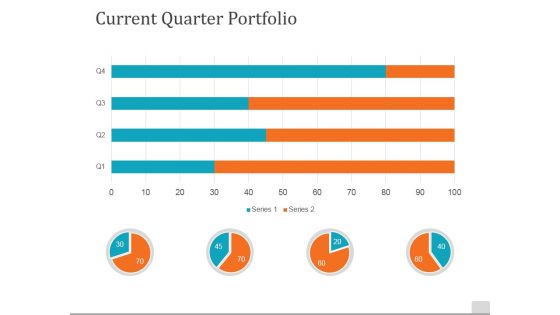
Current Quarter Portfolio Template 1 Ppt PowerPoint Presentation Styles Mockup
This is a current quarter portfolio template 1 ppt powerpoint presentation styles mockup. This is a four stage process. The stages in this process are current quarter portfolio, pie chart, bar graph, business, marketing.
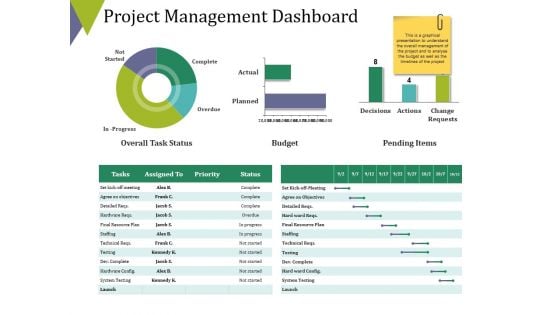
Project Management Dashboard Ppt PowerPoint Presentation Outline Summary
This is a project management dashboard ppt powerpoint presentation outline summary. This is a three stage process. The stages in this process are overall task status, budget, pending items, complete, overdue.
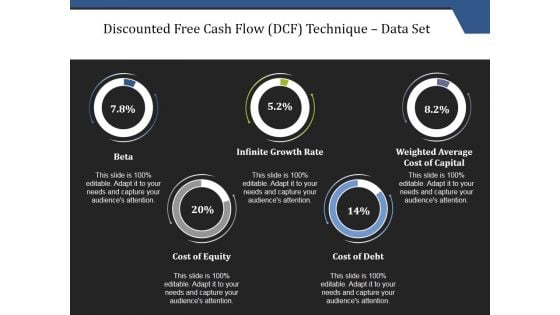
Discounted Free Cash Flow Dcf Technique Data Set Ppt PowerPoint Presentation File Inspiration
This is a discounted free cash flow dcf technique data set ppt powerpoint presentation file inspiration. This is a five stage process. The stages in this process are beta, infinite growth rate, weighted average cost of capital, cost of equity, cost of debt.
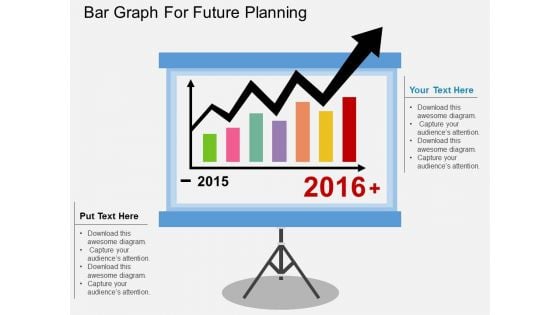
Bar Graph For Future Planning Powerpoint Template
This business diagram display bar graph for years 2015 and 2016. You may use this slide to display statistical analysis. This diagram provides an effective way of displaying information you can edit text, color, shade and style as per you need.

Starting Line Of Race Competition Powerpoint Template
Develop competitive advantage with our above template which contains diagram of four boys at starting line of competition of 2016. This diagram helps to display concepts of competition and race. You can edit text, color, shade and style as per you need.
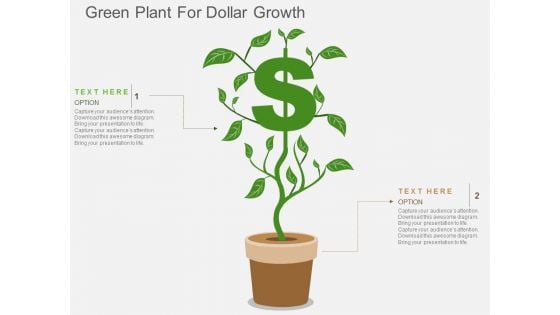
Green Plant For Dollar Growth Powerpoint Templates
This business slide contains graphics of Venn circles. This diagram is suitable to present financial ratio analysis. Download this diagram for schematic representation of any information. Visual effect of this slide helps in maintaining the flow of the discussion and provides more clarity to the subject.
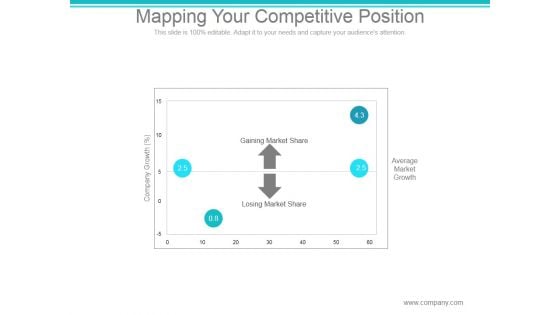
Mapping Your Competitive Position Ppt PowerPoint Presentation Files
This is a mapping your competitive position ppt powerpoint presentation files. This is a four stage process. The stages in this process are gaining market share, losing market share, company growth, average market growth.

Four Vertical Columns For Percentage Comparison Ppt PowerPoint Presentation Introduction
This is a four vertical columns for percentage comparison ppt powerpoint presentation introduction. This is a four stage process. The stages in this process are business, marketing, success, management, presentation.
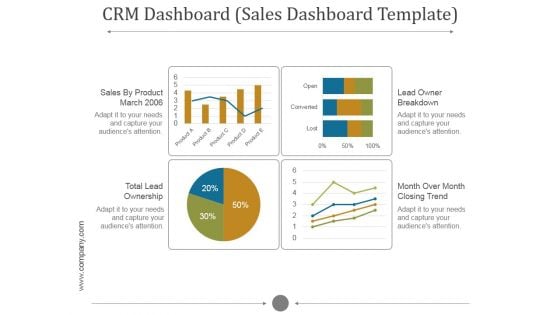
Crm Dashboard Sales Dashboard Template Ppt PowerPoint Presentation Inspiration
This is a crm dashboard sales dashboard template ppt powerpoint presentation inspiration. This is a five stage process. The stages in this process are sales by product march, lead owner breakdown, total lead ownership, month over month closing trend.
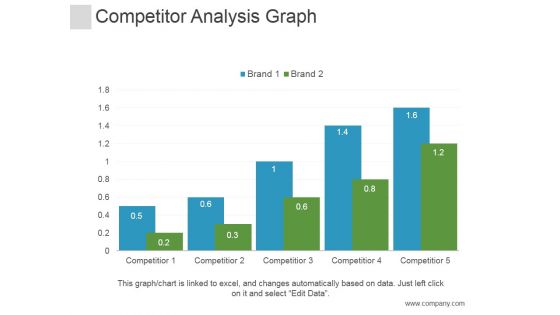
Competitor Analysis Graph Ppt PowerPoint Presentation Styles
This is a competitor analysis graph ppt powerpoint presentation styles. This is a five stage process. The stages in this process are graph, business, marketing, competitor.
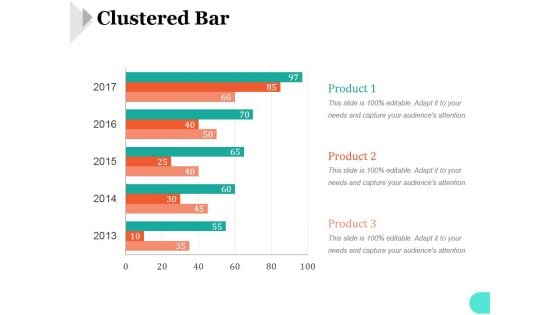
Clustered Bar Ppt PowerPoint Presentation Ideas
This is a clustered bar ppt powerpoint presentation ideas. This is a five stage process. The stages in this process are bar graph, marketing, strategy, analysis, business, success.
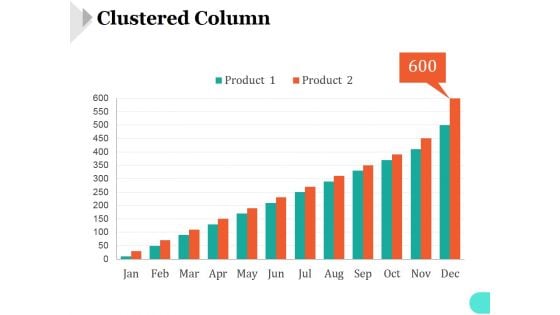
Clustered Column Template 1 Ppt PowerPoint Presentation Inspiration
This is a clustered column template 1 ppt powerpoint presentation inspiration. This is a twelve stage process. The stages in this process are bar graph, marketing, strategy, analysis, business, success.
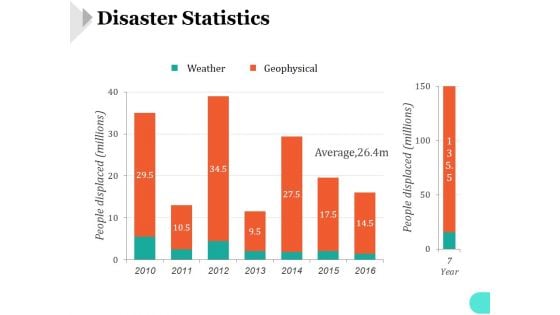
Disaster Statistics Ppt PowerPoint Presentation Portfolio
This is a disaster statistics ppt powerpoint presentation portfolio. This is a seven stage process. The stages in this process are weather, geophysical, average.
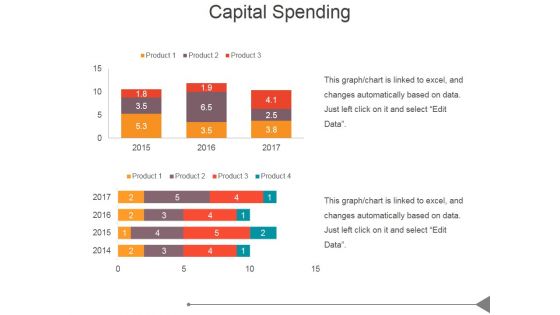
Capital Spending Ppt PowerPoint Presentation Graphics
This is a capital spending ppt powerpoint presentation graphics. This is a two stage process. The stages in this process are business, marketing, success, bar graph, management.
Financial Highlights Template 1 Ppt PowerPoint Presentation Model
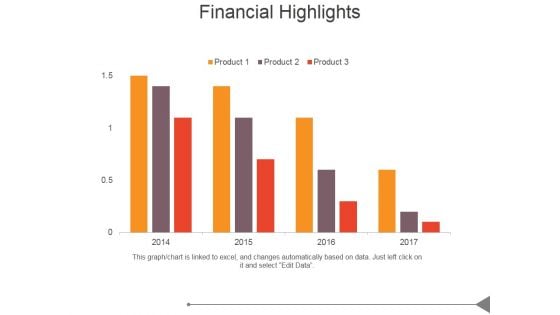
This is a financial highlights template 1 ppt powerpoint presentation model. This is a four stage process. The stages in this process are business, marketing, success, business plan, bar graph.
Financial Highlights Ppt PowerPoint Presentation Sample
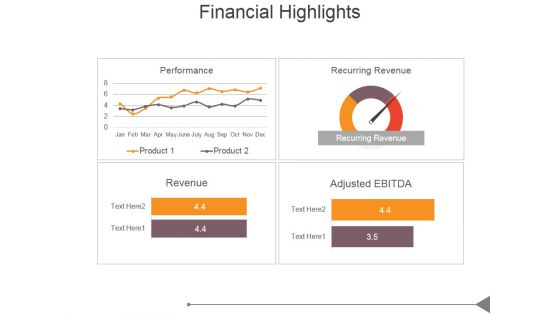
This is a financial highlights ppt powerpoint presentation sample. This is a four stage process. The stages in this process are revenue, adjusted betide, recurring revenue, performance.
Financial Report Ppt PowerPoint Presentation Professional
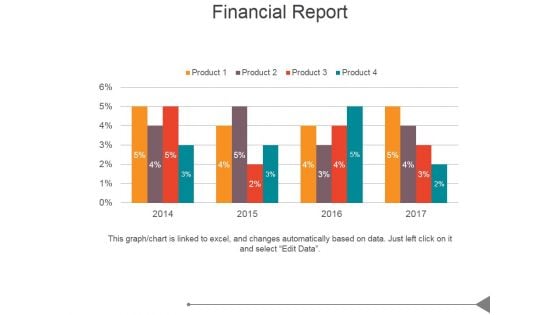
This is a financial report ppt powerpoint presentation professional. This is a four stage process. The stages in this process are business, marketing, success, product, growth.
Financial Strength Ppt PowerPoint Presentation Shapes
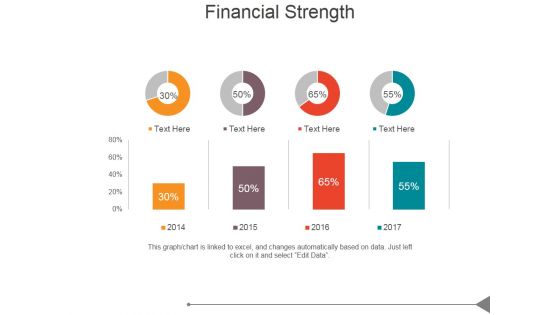
This is a financial strength ppt powerpoint presentation shapes. This is a four stage process. The stages in this process are business, marketing, success, business plan, bar graph.
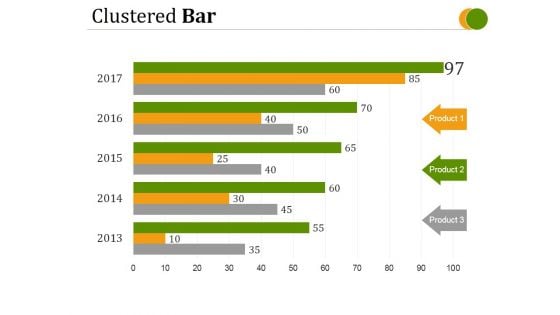
Clustered Bar Ppt PowerPoint Presentation Good
This is a clustered bar ppt powerpoint presentation good. This is a five stage process. The stages in this process are product, circular, business, marketing, bar graph.
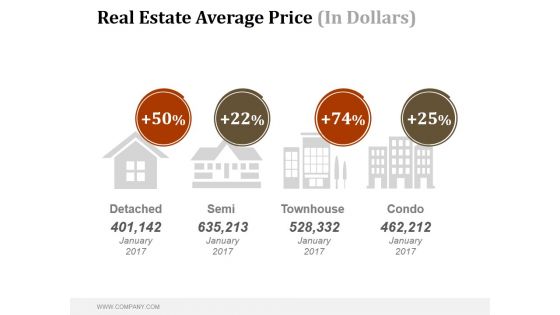
Real Estate Average Price In Dollars Ppt PowerPoint Presentation Inspiration
This is a real estate average price in dollars ppt powerpoint presentation inspiration. This is a four stage process. The stages in this process are detached, semi, townhouse, condo.
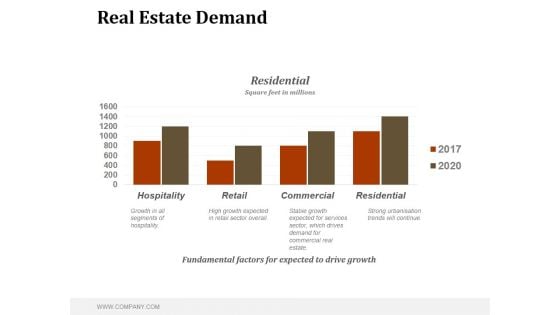
Real Estate Demand Ppt PowerPoint Presentation Graphics
This is a real estate demand ppt powerpoint presentation graphics. This is a four stage process. The stages in this process are fundamental factors for expected to drive growth, residential, square feet in millions.
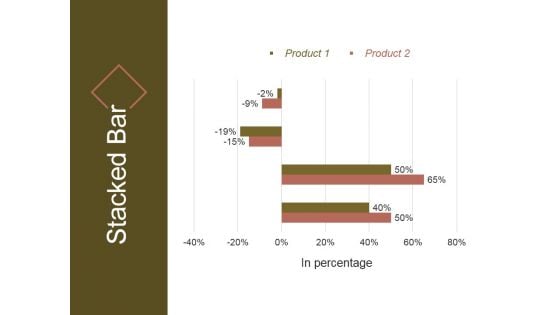
Stacked Bar Template 2 Ppt PowerPoint Presentation Pictures
This is a stacked bar template 2 ppt powerpoint presentation pictures. This is a four stage process. The stages in this process are in percentage, product, stacked bar.
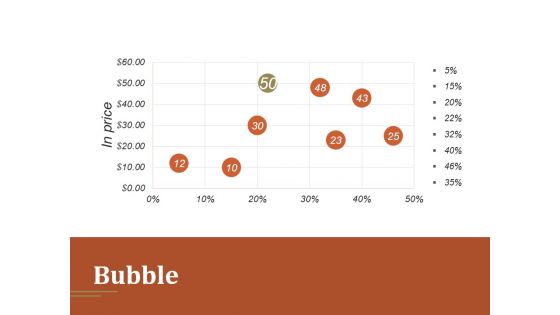
Bubble Ppt PowerPoint Presentation Guidelines
This is a bubble ppt powerpoint presentation guidelines. This is a five stage process. The stages in this process are bubble, business, bar graph, marketing, presentation.
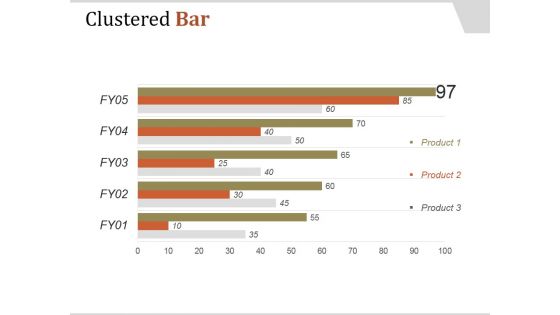
Clustered Bar Ppt PowerPoint Presentation Template
This is a clustered bar ppt powerpoint presentation template. This is a five stage process. The stages in this process are product, clustered bar, business, marketing, bar graph.
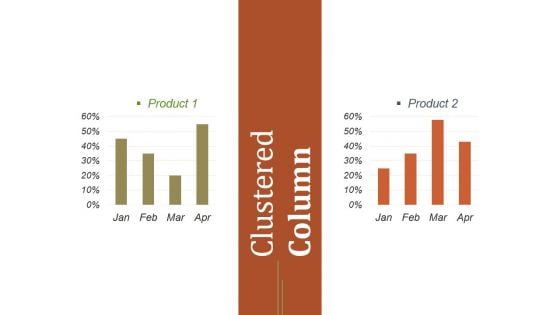
Clustered Column Ppt PowerPoint Presentation Example
This is a clustered column ppt powerpoint presentation example. This is a two stage process. The stages in this process are product, clustered column, business, planning, marketing.
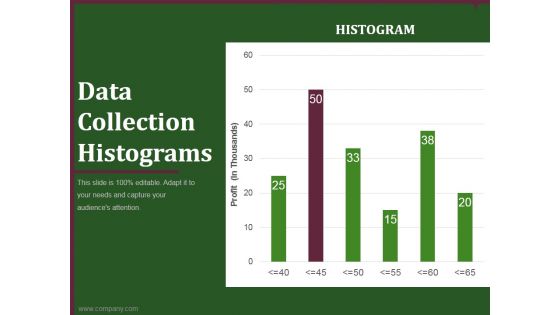
data collection histograms ppt powerpoint presentation example
This is a data collection histograms ppt powerpoint presentation example. This is a six stage process. The stages in this process are business, planning, marketing, histograms, graph.
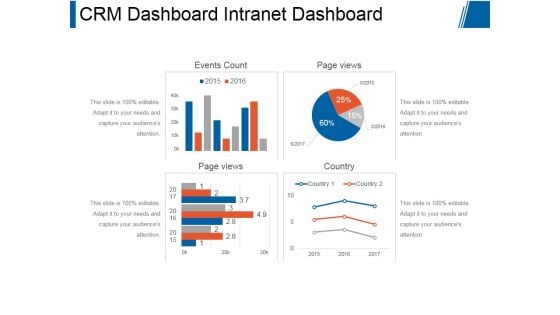
Crm Dashboard Intranet Dashboard Ppt PowerPoint Presentation Model
This is a crm dashboard intranet dashboard ppt powerpoint presentation model. This is a four stage process. The stages in this process are events count, page views, page views, country.
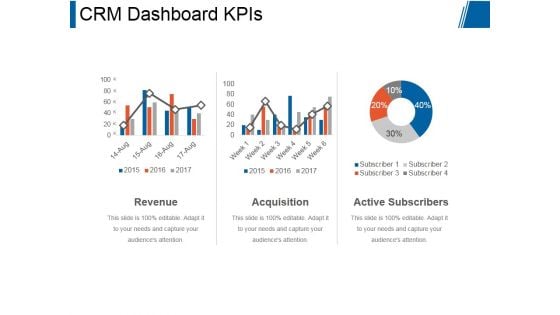
Crm Dashboard Kpis Ppt PowerPoint Presentation Rules
This is a crm dashboard kpis ppt powerpoint presentation rules. This is a three stage process. The stages in this process are revenue, acquisition, active subscribers.
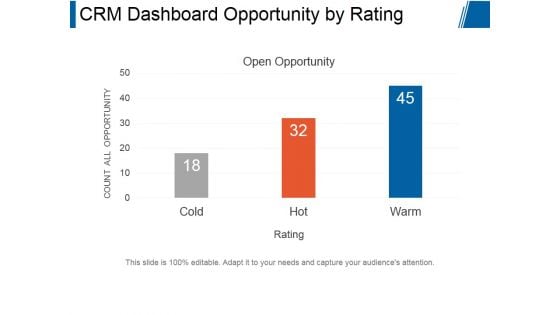
Crm Dashboard Opportunity By Rating Ppt PowerPoint Presentation Backgrounds
This is a crm dashboard opportunity by rating ppt powerpoint presentation backgrounds. This is a three stage process. The stages in this process are open opportunity, count all opportunity, rating.
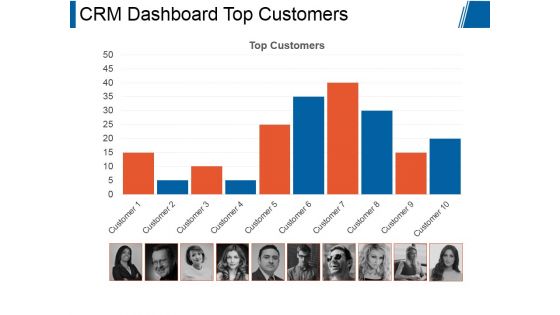
Crm Dashboard Top Customers Ppt PowerPoint Presentation Graphics
This is a crm dashboard top customers ppt powerpoint presentation graphics. This is a ten stage process. The stages in this process are top customers, business, marketing, process, management.
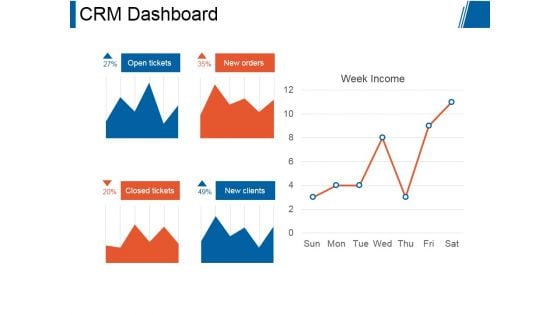
Crm Dashboard Ppt PowerPoint Presentation Good
This is a crm dashboard ppt powerpoint presentation good. This is a five stage process. The stages in this process are open tickets, new orders, closed tickets, new clients, week income.
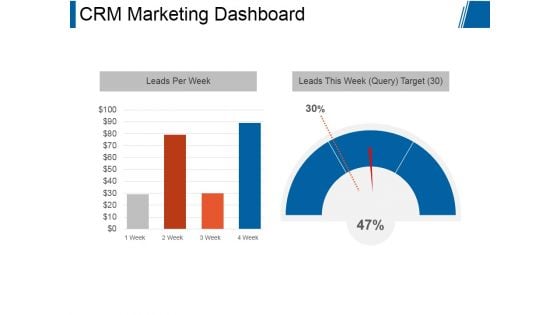
Crm Marketing Dashboard Ppt PowerPoint Presentation Designs
This is a crm marketing dashboard ppt powerpoint presentation designs. This is a two stage process. The stages in this process are leads per week, leads this week target.
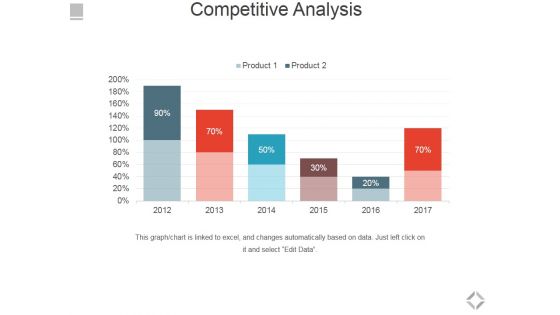
Competitive Analysis Ppt PowerPoint Presentation Slides Design Templates
This is a competitive analysis ppt powerpoint presentation slides design templates. This is a six stage process. The stages in this process are business, marketing, management, success, presentation.
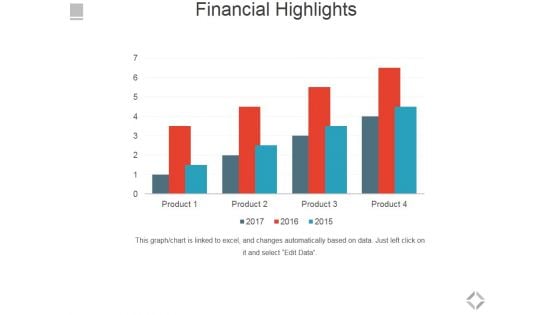
Financial Highlights Template 2 Ppt PowerPoint Presentation Outline Background Image
This is a financial highlights template 2 ppt powerpoint presentation outline background image. This is a four stage process. The stages in this process are financial highlights, business, marketing, success, management.
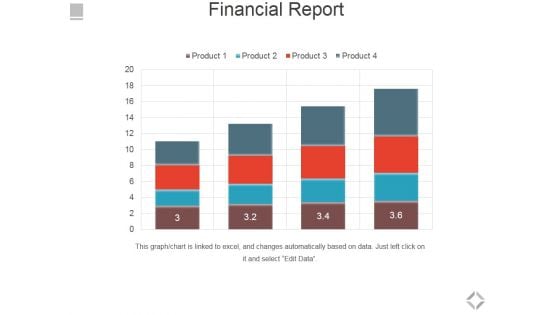
Financial Report Ppt PowerPoint Presentation Styles Skills
This is a financial report ppt powerpoint presentation styles skills. This is a four stage process. The stages in this process are bar graph, business, marketing, success, growth.
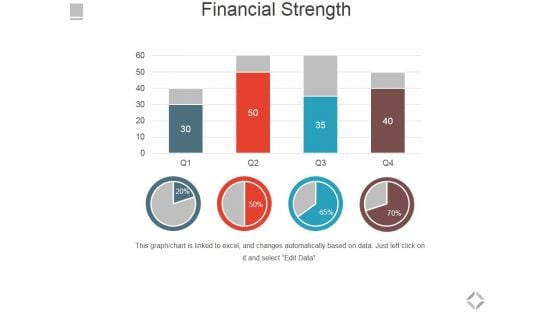
Financial Strength Ppt PowerPoint Presentation Summary Ideas
This is a financial strength ppt powerpoint presentation summary ideas. This is a four stage process. The stages in this process are bar graph, business, marketing, success, growth.
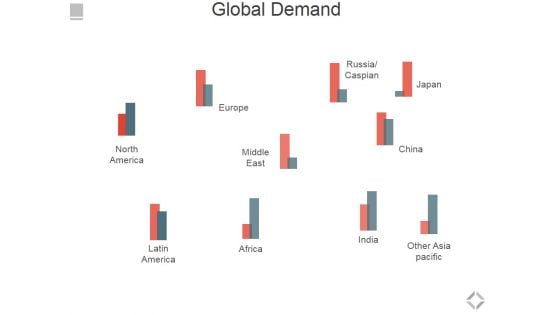
Global Demand Ppt PowerPoint Presentation Model Example Topics
This is a global demand ppt powerpoint presentation model example topics. This is a ten stage process. The stages in this process are europe, africa, latin america, north america, india.
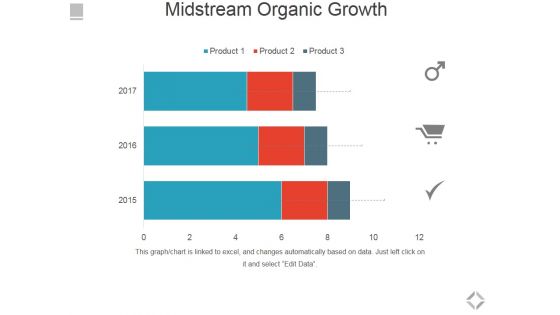
Midstream Organic Growth Ppt PowerPoint Presentation Ideas Graphics Tutorials
This is a midstream organic growth ppt powerpoint presentation ideas graphics tutorials. This is a three stage process. The stages in this process are business, marketing, bar graph, management, financials.
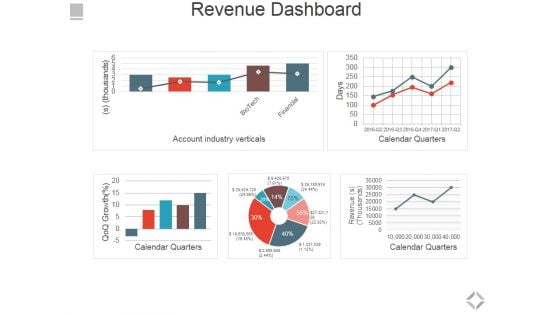
Revenue Dashboard Ppt PowerPoint Presentation Summary Brochure
This is a revenue dashboard ppt powerpoint presentation summary brochure. This is a five stage process. The stages in this process are account industry verticals, calendar quarters.
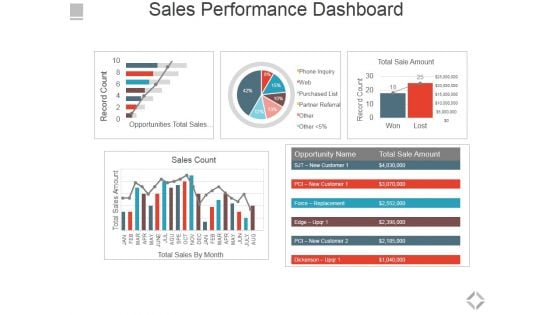
Sales Performance Dashboard Ppt PowerPoint Presentation File Graphics Pictures
This is a sales performance dashboard ppt powerpoint presentation file graphics pictures. This is a five stage process. The stages in this process are total sales by month, sales count, opportunities total sales by probability, total sale amount.
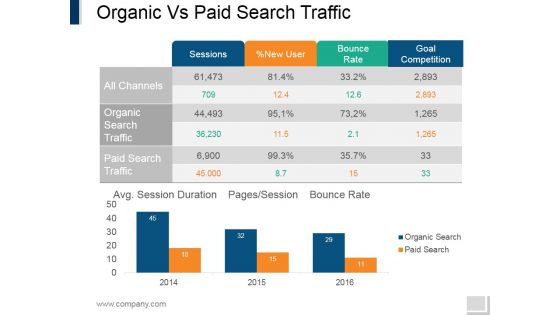
Organic Vs Paid Search Traffic Ppt PowerPoint Presentation Styles Sample
This is a organic vs paid search traffic ppt powerpoint presentation styles sample. This is a two stage process. The stages in this process are sessions, new user, bounce rate, goal competition, organic search traffic, paid search traffic.
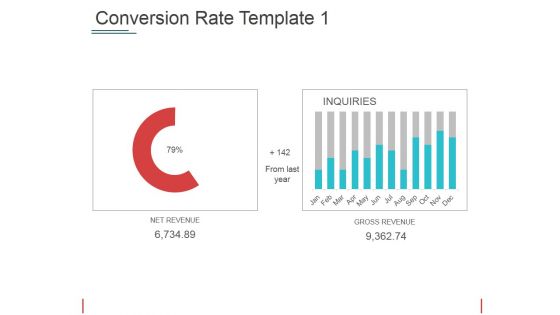
Conversion Rate Template 1 Ppt PowerPoint Presentation Visual Aids Files
This is a conversion rate template 1 ppt powerpoint presentation visual aids files. This is a two stage process. The stages in this process are net revenue gross revenue from last year.
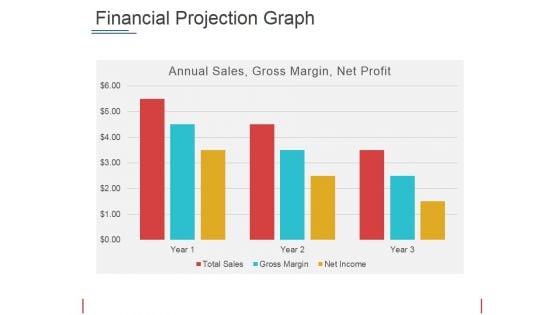
Financial Projection Graph Template 2 Ppt PowerPoint Presentation Show Picture
This is a financial projection graph template 2 ppt powerpoint presentation show picture. This is a three stage process. The stages in this process are annual sales, gross margin, net profit, years.
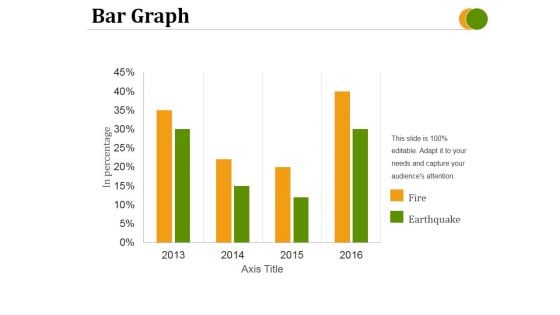
Bar Graph Ppt PowerPoint Presentation Layouts Pictures
This is a bar graph ppt powerpoint presentation layouts pictures. This is a four stage process. The stages in this process are fire, earthquake, axis title, in percentage.
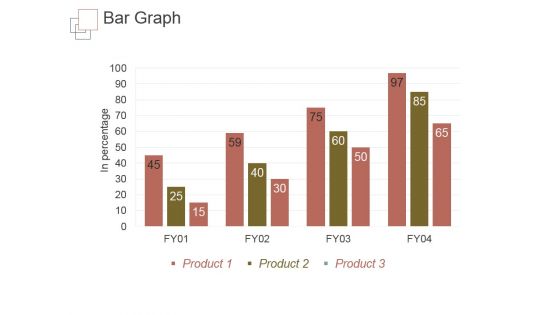
Bar Graph Ppt PowerPoint Presentation Gallery Skills
This is a bar graph ppt powerpoint presentation gallery skills. This is a four stage process. The stages in this process are in percentage, bar graph, business, marketing, product.
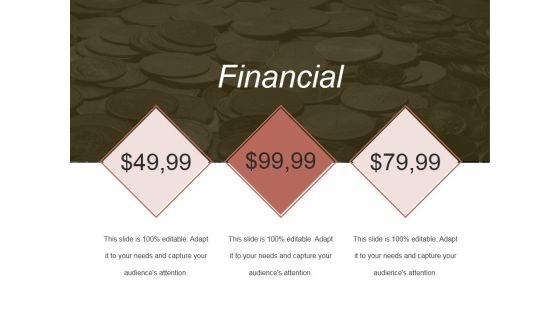
Financial Ppt PowerPoint Presentation Model Rules
This is a financial ppt powerpoint presentation model rules. This is a three stage process. The stages in this process are financial, sales, sales plan, business, marketing.
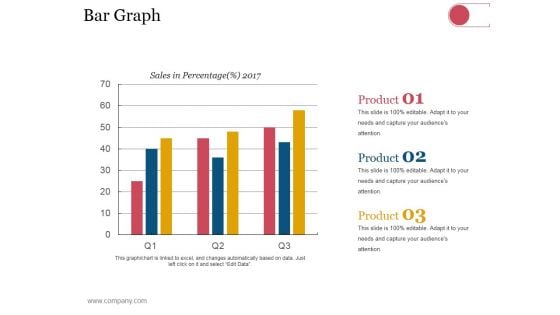
Bar Graph Ppt PowerPoint Presentation Visual Aids Model
This is a bar graph ppt powerpoint presentation visual aids model. This is a three stage process. The stages in this process are business, strategy, analysis, planning, sales in percentage.

 Home
Home