Finance Kpi

Marketing Success Metrics Ways To Analyze Enterprises Marketing Performance Ppt PowerPoint Presentation Complete Deck With Slides
This Marketing Success Metrics Ways To Analyze Enterprises Marketing Performance Ppt PowerPoint Presentation Complete Deck With Slides is designed to help you retain your audiences attention. This content-ready PowerPoint Template enables you to take your audience on a journey and share information in a way that is easier to recall. It helps you highlight the crucial parts of your work so that the audience does not get saddled with information download. This sixty five slide PPT Deck comes prepared with the graphs and charts you could need to showcase your information through visuals. You only need to enter your own data in them. Download this editable PowerPoint Theme and walk into that meeting with confidence.
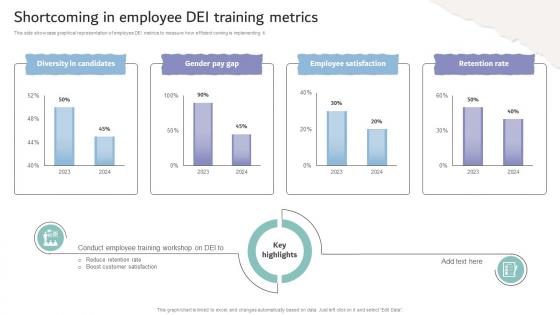
Inclusive Workplace Training Program Shortcoming In Employee Dei Training Metrics DTE SS V
This side showcase graphical representation of employee DEI metrics to measure how efficient coming is implementing it. Welcome to our selection of the Inclusive Workplace Training Program Shortcoming In Employee Dei Training Metrics DTE SS V. These are designed to help you showcase your creativity and bring your sphere to life. Planning and Innovation are essential for any business that is just starting out. This collection contains the designs that you need for your everyday presentations. All of our PowerPoints are 100Percent editable, so you can customize them to suit your needs. This multi-purpose template can be used in various situations. Grab these presentation templates today. This side showcase graphical representation of employee DEI metrics to measure how efficient coming is implementing it.
Consumer Lead Generation Process Enhanced Lead Performance Tracking Dashboard Portrait PDF
This slide covers the KPI dashboard for tracking improved lead management system performance. It includes metrics such as visitors, social media followers, email subscribers, organic leads, etc. Slidegeeks is here to make your presentations a breeze with Consumer Lead Generation Process Enhanced Lead Performance Tracking Dashboard Portrait PDF With our easy-to-use and customizable templates, you can focus on delivering your ideas rather than worrying about formatting. With a variety of designs to choose from, youre sure to find one that suits your needs. And with animations and unique photos, illustrations, and fonts, you can make your presentation pop. So whether youre giving a sales pitch or presenting to the board, make sure to check out Slidegeeks first.
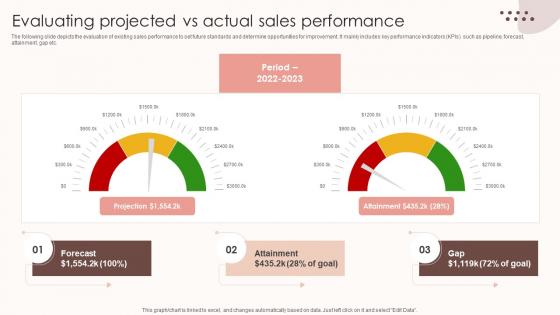
Assessing Sales Risks Evaluating Projected Vs Actual Sales Performance Mockup PDF
The following slide depicts the evaluation of existing sales performance to set future standards and determine opportunities for improvement. It mainly includes key performance indicators KPIs such as pipeline, forecast, attainment, gap etc. Are you in need of a template that can accommodate all of your creative concepts This one is crafted professionally and can be altered to fit any style. Use it with Google Slides or PowerPoint. Include striking photographs, symbols, depictions, and other visuals. Fill, move around, or remove text boxes as desired. Test out color palettes and font mixtures. Edit and save your work, or work with colleagues. Download Assessing Sales Risks Evaluating Projected Vs Actual Sales Performance Mockup PDF and observe how to make your presentation outstanding. Give an impeccable presentation to your group and make your presentation unforgettable. The following slide depicts the evaluation of existing sales performance to set future standards and determine opportunities for improvement. It mainly includes key performance indicators KPIs such as pipeline, forecast, attainment, gap etc.
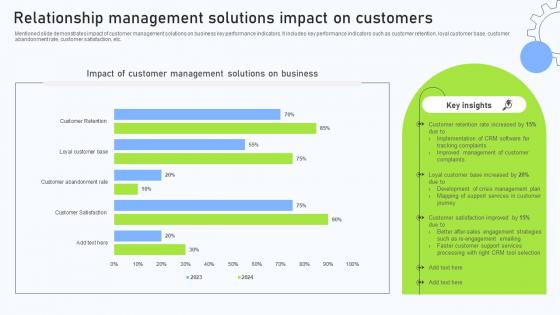
Relationship Management Automation Relationship Management Solutions Impact
Mentioned slide demonstrates impact of customer management solutions on business key performance indicators. It includes key performance indicators such as customer retention, loyal customer base, customer abandonment rate, customer satisfaction, etc. This Relationship Management Automation Relationship Management Solutions Impact from Slidegeeks makes it easy to present information on your topic with precision. It provides customization options, so you can make changes to the colors, design, graphics, or any other component to create a unique layout. It is also available for immediate download, so you can begin using it right away. Slidegeeks has done good research to ensure that you have everything you need to make your presentation stand out. Make a name out there for a brilliant performance. Mentioned slide demonstrates impact of customer management solutions on business key performance indicators. It includes key performance indicators such as customer retention, loyal customer base, customer abandonment rate, customer satisfaction, etc.
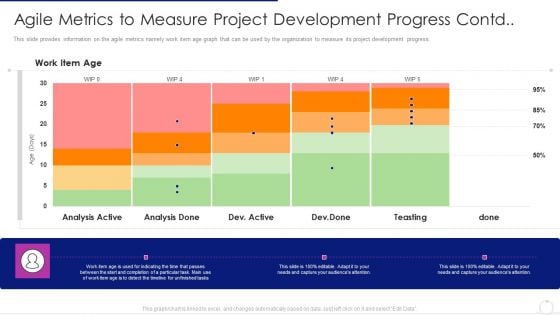
Software Development Life Cycle Agile Model It Agile Metrics To Measure Project Development Progress Contd Work Diagrams PDF
This slide provides information on the agile metrics namely work item age graph that can be used by the organization to measure its project development progress. Deliver and pitch your topic in the best possible manner with this software development life cycle agile model it agile metrics to measure project development progress contd work diagrams pdf. Use them to share invaluable insights on agile metrics to measure project development progress contd and impress your audience. This template can be altered and modified as per your expectations. So, grab it now.
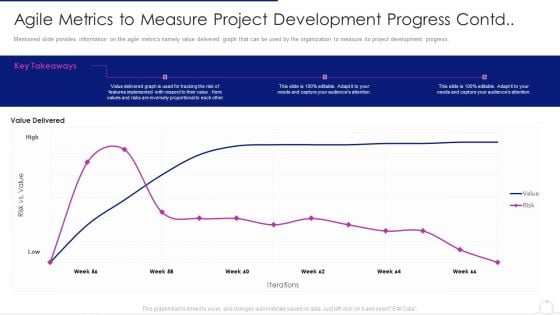
Software Development Life Cycle Agile Model It Agile Metrics To Measure Project Development Progress Contd Download PDF
Mentioned slide provides information on the agile metrics namely value delivered graph that can be used by the organization to measure its project development progress. Deliver an awe inspiring pitch with this creative software development life cycle agile model it addressing the principles that shape agile model pictures pdf bundle. Topics like agile metrics to measure project development progress contd can be discussed with this completely editable template. It is available for immediate download depending on the needs and requirements of the user.
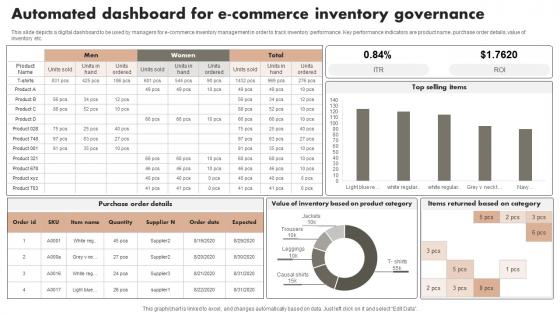
Automated Dashboard For E Commerce Inventory Governance Download Pdf
This slide depicts a digital dashboard to be used by managers for e commerce inventory management in order to track inventory performance. Key performance indicators are product name, purchase order details, value of inventory etc. Showcasing this set of slides titled Automated Dashboard For E Commerce Inventory Governance Download Pdf. The topics addressed in these templates are Governance, Automated, Commerce. All the content presented in this PPT design is completely editable. Download it and make adjustments in color, background, font etc. as per your unique business setting. This slide depicts a digital dashboard to be used by managers for e commerce inventory management in order to track inventory performance. Key performance indicators are product name, purchase order details, value of inventory etc.
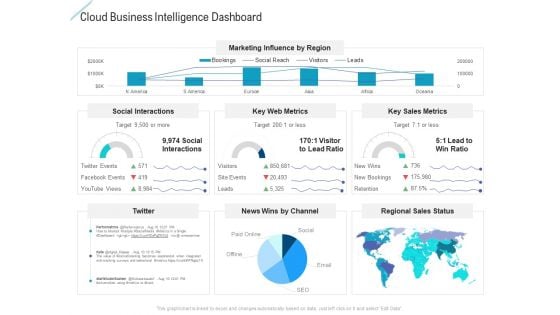
Cloud Business Intelligence Dashboard Graphics PDF
Deliver and pitch your topic in the best possible manner with this cloud business intelligence dashboard graphics pdf. Use them to share invaluable insights on social interactions, key web metrics, key sales metrics and impress your audience. This template can be altered and modified as per your expectations. So, grab it now.
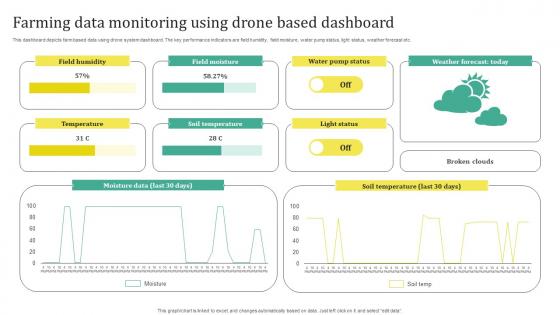
Farming Data Monitoring Using Drone Based Dashboard Sample Pdf
This dashboard depicts farm based data using drone system dashboard. The key performance indicators are field humidity, field moisture, water pump status, light status, weather forecast etc. Pitch your topic with ease and precision using this Farming Data Monitoring Using Drone Based Dashboard Sample Pdf. This layout presents information on Temperature, Soil Temperature, Light Status. It is also available for immediate download and adjustment. So, changes can be made in the color, design, graphics or any other component to create a unique layout. This dashboard depicts farm based data using drone system dashboard. The key performance indicators are field humidity, field moisture, water pump status, light status, weather forecast etc.
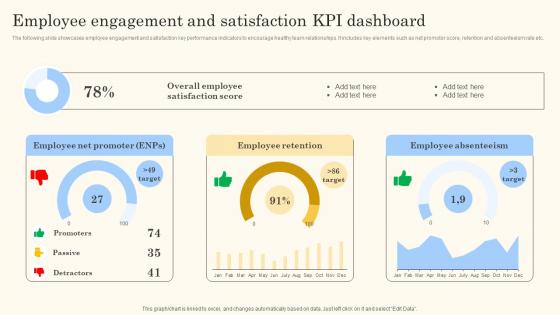
Employee Engagement And Satisfaction Action Steps For Employee Engagement Guidelines Pdf
The following slide showcases employee engagement and satisfaction key performance indicators to encourage healthy team relationships. It includes key elements such as net promotor score, retention and absenteeism rate etc.This Employee Engagement And Satisfaction Action Steps For Employee Engagement Guidelines Pdf from Slidegeeks makes it easy to present information on your topic with precision. It provides customization options, so you can make changes to the colors, design, graphics, or any other component to create a unique layout. It is also available for immediate download, so you can begin using it right away. Slidegeeks has done good research to ensure that you have everything you need to make your presentation stand out. Make a name out there for a brilliant performance. The following slide showcases employee engagement and satisfaction key performance indicators to encourage healthy team relationships. It includes key elements such as net promotor score, retention and absenteeism rate etc.
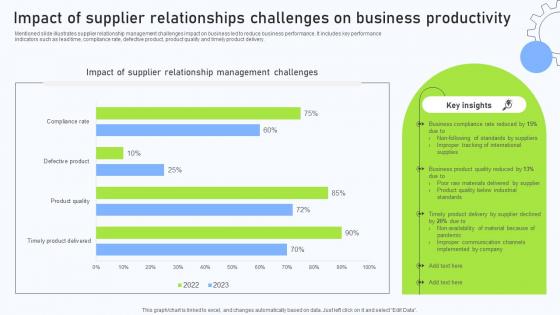
Relationship Management Automation Software Impact Of Supplier Relationships Challenges
Mentioned slide illustrates supplier relationship management challenges impact on business led to reduce business performance. It includes key performance indicators such as lead time, compliance rate, defective product, product quality and timely product delivery. Slidegeeks is one of the best resources for PowerPoint templates. You can download easily and regulate Relationship Management Automation Software Impact Of Supplier Relationships Challenges for your personal presentations from our wonderful collection. A few clicks is all it takes to discover and get the most relevant and appropriate templates. Use our Templates to add a unique zing and appeal to your presentation and meetings. All the slides are easy to edit and you can use them even for advertisement purposes. Mentioned slide illustrates supplier relationship management challenges impact on business led to reduce business performance. It includes key performance indicators such as lead time, compliance rate, defective product, product quality and timely product delivery.
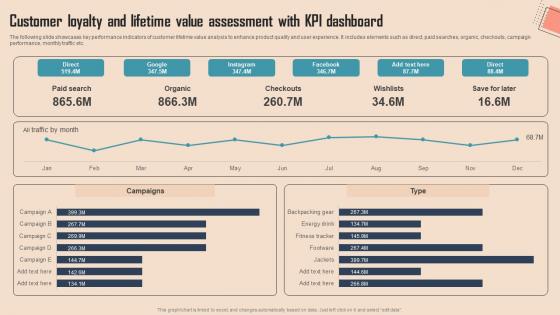
Customer Loyalty And Lifetime Value Comprehensive CDP Guide For Promoters Summary Pdf
The following slide showcases key performance indicators of customer lifetime value analysis to enhance product quality and user experience. It includes elements such as direct, paid searches, organic, checkouts, campaign performance, monthly traffic etc.Present like a pro with Customer Loyalty And Lifetime Value Comprehensive CDP Guide For Promoters Summary Pdf Create beautiful presentations together with your team, using our easy-to-use presentation slides. Share your ideas in real-time and make changes on the fly by downloading our templates. So whether you are in the office, on the go, or in a remote location, you can stay in sync with your team and present your ideas with confidence. With Slidegeeks presentation got a whole lot easier. Grab these presentations today. The following slide showcases key performance indicators of customer lifetime value analysis to enhance product quality and user experience. It includes elements such as direct, paid searches, organic, checkouts, campaign performance, monthly traffic etc.
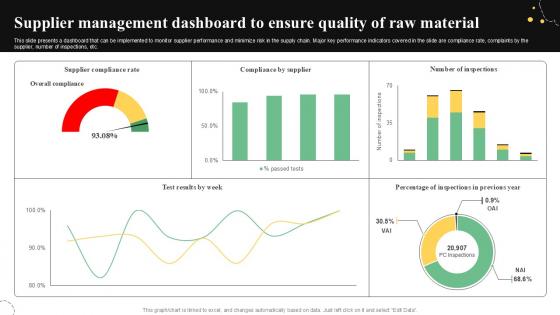
Supplier Management Dashboard Quality Control Guide For Food PPT Sample
This slide presents a dashboard that can be implemented to monitor supplier performance and minimize risk in the supply chain. Major key performance indicators covered in the slide are compliance rate, complaints by the supplier, number of inspections, etc. Present like a pro with Supplier Management Dashboard Quality Control Guide For Food PPT Sample. Create beautiful presentations together with your team, using our easy-to-use presentation slides. Share your ideas in real-time and make changes on the fly by downloading our templates. So whether you are in the office, on the go, or in a remote location, you can stay in sync with your team and present your ideas with confidence. With Slidegeeks presentation got a whole lot easier. Grab these presentations today. This slide presents a dashboard that can be implemented to monitor supplier performance and minimize risk in the supply chain. Major key performance indicators covered in the slide are compliance rate, complaints by the supplier, number of inspections, etc.
Cryptocurrency Portfolio Tracking Dashboard Summary Cryptocurrency Management With Blockchain
This slide represents the cryptocurrency performance indicators for the individual. The key components include invested money, profit and loss, rate of investment ROI, current valuation of money, etc.Formulating a presentation can take up a lot of effort and time, so the content and message should always be the primary focus. The visuals of the PowerPoint can enhance the presenters message, so our Cryptocurrency Portfolio Tracking Dashboard Summary Cryptocurrency Management With Blockchain was created to help save time. Instead of worrying about the design, the presenter can concentrate on the message while our designers work on creating the ideal templates for whatever situation is needed. Slidegeeks has experts for everything from amazing designs to valuable content, we have put everything into Cryptocurrency Portfolio Tracking Dashboard Summary Cryptocurrency Management With Blockchain. This slide represents the cryptocurrency performance indicators for the individual. The key components include invested money, profit and loss, rate of investment ROI, current valuation of money, etc.
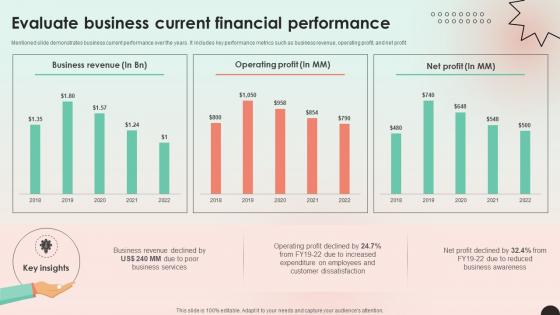
Web Consulting Business Evaluate Business Current Financial Performance
Mentioned slide demonstrates business current performance over the years. It includes key performance metrics such as business revenue, operating profit, and net profit. Are you searching for a Web Consulting Business Evaluate Business Current Financial Performance that is uncluttered, straightforward, and original Its easy to edit, and you can change the colors to suit your personal or business branding. For a presentation that expresses how much effort you have put in, this template is ideal With all of its features, including tables, diagrams, statistics, and lists, its perfect for a business plan presentation. Make your ideas more appealing with these professional slides. Download Web Consulting Business Evaluate Business Current Financial Performance from Slidegeeks today. Mentioned slide demonstrates business current performance over the years. It includes key performance metrics such as business revenue, operating profit, and net profit.
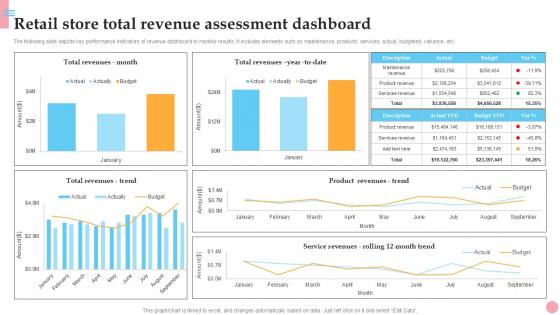
Retail Store Total Revenue Assessment How To Improve Company PPT Presentation Strategy SS V
The following slide depicts key performance indicators of revenue dashboard to monitor results. It includes elements such as maintenance, products, services, actual, budgeted, variance, etc. Take your projects to the next level with our ultimate collection of Retail Store Total Revenue Assessment How To Improve Company PPT Presentation Strategy SS V. Slidegeeks has designed a range of layouts that are perfect for representing task or activity duration, keeping track of all your deadlines at a glance. Tailor these designs to your exact needs and give them a truly corporate look with your own brand colors they will make your projects stand out from the rest The following slide depicts key performance indicators of revenue dashboard to monitor results. It includes elements such as maintenance, products, services, actual, budgeted, variance, etc.
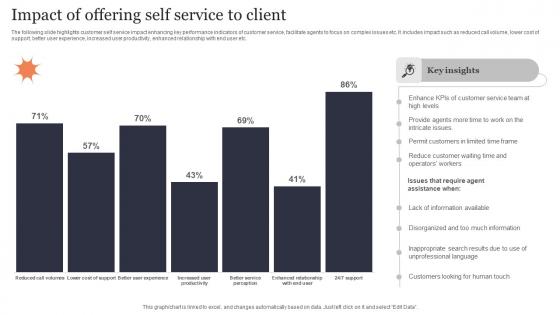
Impact Of Offering Self Service To Client Structure Pdf
The following slide highlights customer self service impact enhancing key performance indicators of customer service, facilitate agents to focus on complex issues etc. It includes impact such as reduced call volume, lower cost of support, better user experience, increased user productivity, enhanced relationship with end user etc. Showcasing this set of slides titled Impact Of Offering Self Service To Client Structure Pdf. The topics addressed in these templates are Impact Of Offering, Self Service. All the content presented in this PPT design is completely editable. Download it and make adjustments in color, background, font etc. as per your unique business setting. The following slide highlights customer self service impact enhancing key performance indicators of customer service, facilitate agents to focus on complex issues etc. It includes impact such as reduced call volume, lower cost of support, better user experience, increased user productivity, enhanced relationship with end user etc.

Graph Illustrating Impact Of Prescriptive Analytics Data Analytics SS V
This slide showcases graph highlighting impact analysis of prescriptive analytics on businesses via use of major performance indicators. It provides information total revenue, inventory levels and labour costs with key insights.Take your projects to the next level with our ultimate collection of Graph Illustrating Impact Of Prescriptive Analytics Data Analytics SS V. Slidegeeks has designed a range of layouts that are perfect for representing task or activity duration, keeping track of all your deadlines at a glance. Tailor these designs to your exact needs and give them a truly corporate look with your own brand colors they will make your projects stand out from the rest This slide showcases graph highlighting impact analysis of prescriptive analytics on businesses via use of major performance indicators. It provides information total revenue, inventory levels and labour costs with key insights.
Data Breach Prevention Status Tracking Dashboard Data Breach Prevention Information Pdf
This slide represents the critical cyber security performance indicators for the organization. The key components include application health, encryption status, license consumption, windows defender, etc. Crafting an eye-catching presentation has never been more straightforward. Let your presentation shine with this tasteful yet straightforward Data Breach Prevention Status Tracking Dashboard Data Breach Prevention Information Pdf template. It offers a minimalistic and classy look that is great for making a statement. The colors have been employed intelligently to add a bit of playfulness while still remaining professional. Construct the ideal Data Breach Prevention Status Tracking Dashboard Data Breach Prevention Information Pdf that effortlessly grabs the attention of your audience Begin now and be certain to wow your customers This slide represents the critical cyber security performance indicators for the organization. The key components include application health, encryption status, license consumption, windows defender, etc.
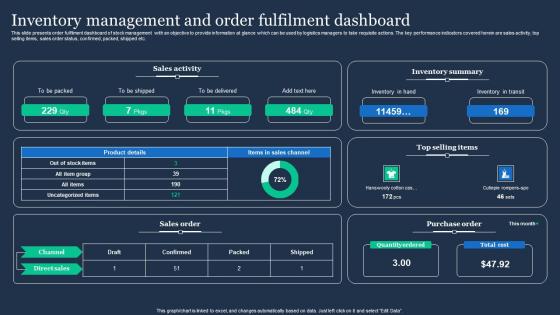
Inventory Management And Order Fulfilment Dashboard Slides Pdf
This slide presents order fulfilment dashboard of stock management with an objective to provide information at glance which can be used by logistics managers to take requisite actions. The key performance indicators covered herein are sales activity, top selling items, sales order status, confirmed, packed, shipped etc. Pitch your topic with ease and precision using this Inventory Management And Order Fulfilment Dashboard Slides Pdf. This layout presents information on Sales Activity, Inventory Summary, Sales Order. It is also available for immediate download and adjustment. So, changes can be made in the color, design, graphics or any other component to create a unique layout. This slide presents order fulfilment dashboard of stock management with an objective to provide information at glance which can be used by logistics managers to take requisite actions. The key performance indicators covered herein are sales activity, top selling items, sales order status, confirmed, packed, shipped etc.
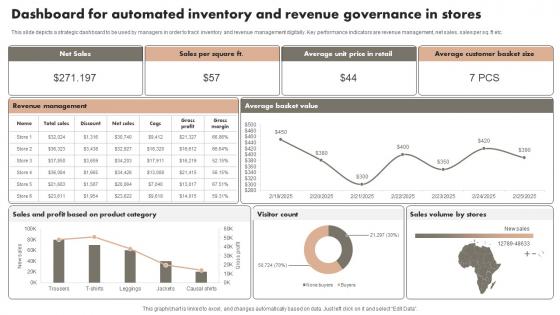
Dashboard For Automated Inventory And Revenue Governance In Stores Microsoft Pdf
This slide depicts a strategic dashboard to be used by managers in order to track inventory and revenue management digitally. Key performance indicators are revenue management, net sales, sales per sq. ft etc. Pitch your topic with ease and precision using this Dashboard For Automated Inventory And Revenue Governance In Stores Microsoft Pdf. This layout presents information on Net Sales, Stores, Category. It is also available for immediate download and adjustment. So, changes can be made in the color, design, graphics or any other component to create a unique layout. This slide depicts a strategic dashboard to be used by managers in order to track inventory and revenue management digitally. Key performance indicators are revenue management, net sales, sales per sq. ft etc.
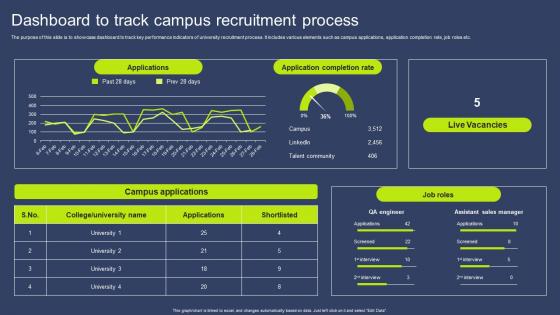
Dashboard To Track Campus Recruitment Process Clipart Pdf
The purpose of this slide is to showcase dashboard to track key performance indicators of university recruitment process. It includes various elements such as campus applications, application completion rate, job roles etc. Showcasing this set of slides titled Dashboard To Track Campus Recruitment Process Clipart Pdf. The topics addressed in these templates are Applications, Application Completion Rate, Live Vacancies. All the content presented in this PPT design is completely editable. Download it and make adjustments in color, background, font etc. as per your unique business setting. The purpose of this slide is to showcase dashboard to track key performance indicators of university recruitment process. It includes various elements such as campus applications, application completion rate, job roles etc.
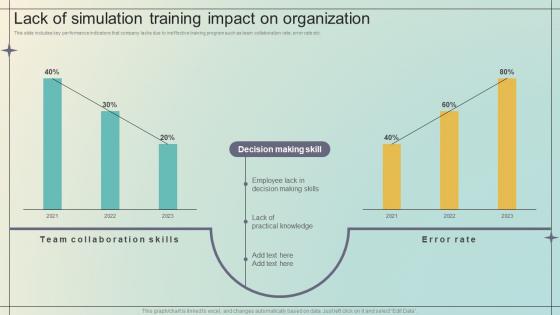
Immersive Training For Practical Lack Of Simulation Training Impact On Organization DTE SS V
This slide includes key performance indicators that company lacks due to ineffective training program such as team collaboration rate, error rate etc. If you are looking for a format to display your unique thoughts, then the professionally designed Immersive Training For Practical Lack Of Simulation Training Impact On Organization DTE SS V is the one for you. You can use it as a Google Slides template or a PowerPoint template. Incorporate impressive visuals, symbols, images, and other charts. Modify or reorganize the text boxes as you desire. Experiment with shade schemes and font pairings. Alter, share or cooperate with other people on your work. Download Immersive Training For Practical Lack Of Simulation Training Impact On Organization DTE SS V and find out how to give a successful presentation. Present a perfect display to your team and make your presentation unforgettable. This slide includes key performance indicators that company lacks due to ineffective training program such as team collaboration rate, error rate etc.
Data Breach Prevention Status Tracking Dashboard Data Fortification Strengthening Defenses
This slide represents the critical cyber security performance indicators for the organization. The key components include application health, encryption status, license consumption, windows defender, etc.Are you in need of a template that can accommodate all of your creative concepts This one is crafted professionally and can be altered to fit any style. Use it with Google Slides or PowerPoint. Include striking photographs, symbols, depictions, and other visuals. Fill, move around, or remove text boxes as desired. Test out color palettes and font mixtures. Edit and save your work, or work with colleagues. Download Data Breach Prevention Status Tracking Dashboard Data Fortification Strengthening Defenses and observe how to make your presentation outstanding. Give an impeccable presentation to your group and make your presentation unforgettable. This slide represents the critical cyber security performance indicators for the organization. The key components include application health, encryption status, license consumption, windows defender, etc.
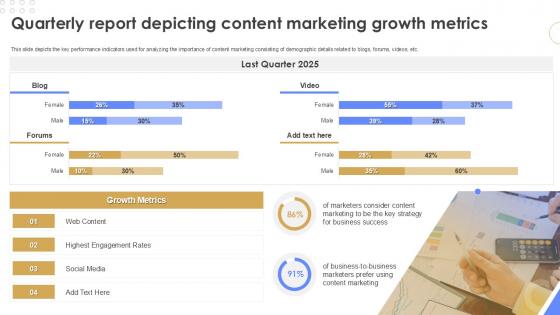
Quarterly Report Depicting Content Marketing Growth Metrics Quarterly Report Ppt Example
This slide depicts the key performance indicators used for analyzing the importance of content marketing consisting of demographic details related to blogs, forums, videos, etc. Slidegeeks is here to make your presentations a breeze with Quarterly Report Depicting Content Marketing Growth Metrics Quarterly Report Ppt Example With our easy-to-use and customizable templates, you can focus on delivering your ideas rather than worrying about formatting. With a variety of designs to choose from, you are sure to find one that suits your needs. And with animations and unique photos, illustrations, and fonts, you can make your presentation pop. So whether you are giving a sales pitch or presenting to the board, make sure to check out Slidegeeks first This slide depicts the key performance indicators used for analyzing the importance of content marketing consisting of demographic details related to blogs, forums, videos, etc.
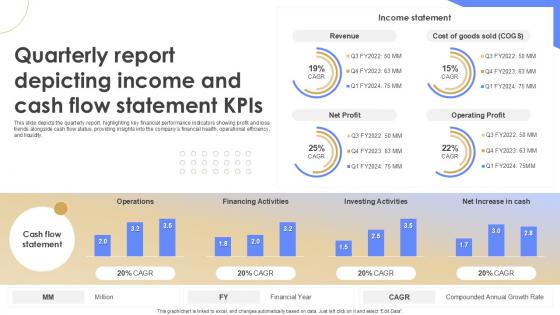
Quarterly Report Depicting Income And Cash Flow Statement KPIS Quarterly Report Ppt Example
This slide depicts the quarterly report, highlighting key financial performance indicators showing profit and loss trends alongside cash flow status, providing insights into the companys financial health, operational efficiency, and liquidity. Do you have an important presentation coming up Are you looking for something that will make your presentation stand out from the rest Look no further than Quarterly Report Depicting Income And Cash Flow Statement KPIS Quarterly Report Ppt Example With our professional designs, you can trust that your presentation will pop and make delivering it a smooth process. And with Slidegeeks, you can trust that your presentation will be unique and memorable. So why wait Grab Quarterly Report Depicting Income And Cash Flow Statement KPIS Quarterly Report Ppt Example today and make your presentation stand out from the rest This slide depicts the quarterly report, highlighting key financial performance indicators showing profit and loss trends alongside cash flow status, providing insights into the companys financial health, operational efficiency, and liquidity.
Dashboard For Tracking Social Media Kpis Mockup PDF
This slide shows dashboard for tracking social media key performance indicators KPIs. It provides details about average social engagement, reactions, comments, shares, clicks, thumbnail, platform, post message, etc. Deliver and pitch your topic in the best possible manner with this Dashboard For Tracking Social Media Kpis Mockup PDF. Use them to share invaluable insights on Social Engagements, Dashboard, Tracking Social Media KPIS and impress your audience. This template can be altered and modified as per your expectations. So, grab it now.
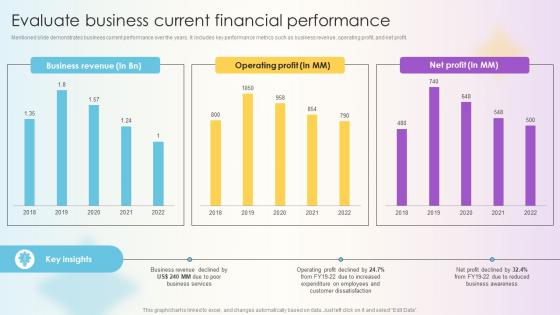
Managing Technical And Non Evaluate Business Current Financial Performance
Mentioned slide demonstrates business current performance over the years. It includes key performance metrics such as business revenue, operating profit, and net profit. The best PPT templates are a great way to save time, energy, and resources. Slidegeeks have 100 percent editable powerpoint slides making them incredibly versatile. With these quality presentation templates, you can create a captivating and memorable presentation by combining visually appealing slides and effectively communicating your message. Download Managing Technical And Non Evaluate Business Current Financial Performance from Slidegeeks and deliver a wonderful presentation. Mentioned slide demonstrates business current performance over the years. It includes key performance metrics such as business revenue, operating profit, and net profit.
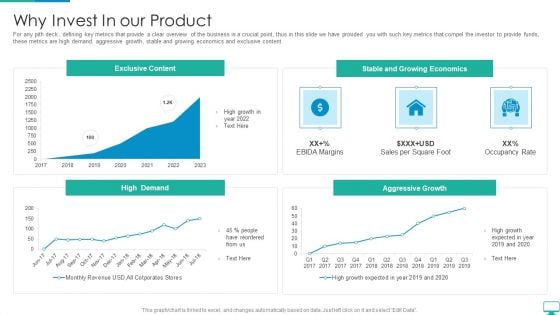
Cyberspace Simulation Platform Fundraising Elevator Why Invest In Our Product Demonstration PDF
For any pith deck, defining key metrics that provide a clear overview of the business is a crucial point, thus in this slide we have provided you with such key metrics that compel the investor to provide funds, these metrics are high demand, aggressive growth, stable and growing economics and exclusive content. Deliver an awe inspiring pitch with this creative cyberspace simulation platform fundraising elevator why invest in our product demonstration pdf bundle. Topics like exclusive content, stable and growing economics, aggressive growth can be discussed with this completely editable template. It is available for immediate download depending on the needs and requirements of the user.
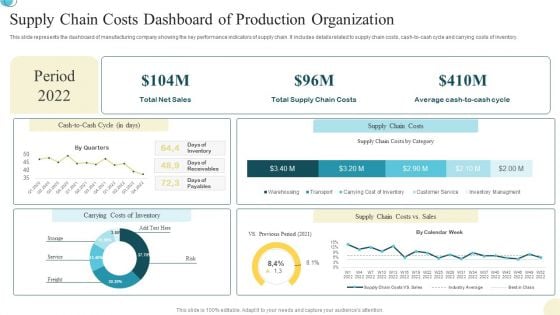
Supply Chain Costs Dashboard Of Production Organization Background PDF
This slide represents the dashboard of manufacturing company showing the key performance indicators of supply chain. It includes details related to supply chain costs, cash to cash cycle and carrying costs of inventory. Pitch your topic with ease and precision using this Supply Chain Costs Dashboard Of Production Organization Background PDF. This layout presents information on Supply Chain Costs, Dashboard Of Production, Organization. It is also available for immediate download and adjustment. So, changes can be made in the color, design, graphics or any other component to create a unique layout.
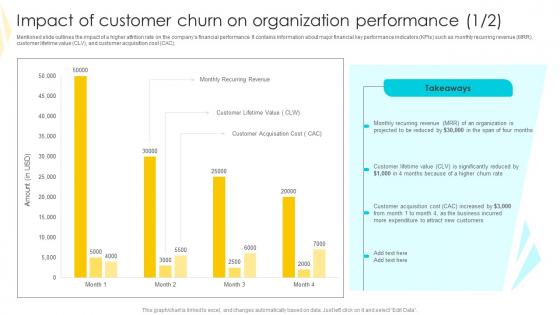
Impact Of Customer Churn On Strategies To Mitigate Customer Churn Template Pdf
Mentioned slide outlines the impact of a higher attrition rate on the companys financial performance. It contains information about major financial key performance indicators KPIs such as monthly recurring revenue MRR, customer lifetime value CLV, and customer acquisition cost CAC. If you are looking for a format to display your unique thoughts, then the professionally designed Impact Of Customer Churn On Strategies To Mitigate Customer Churn Template Pdf is the one for you. You can use it as a Google Slides template or a PowerPoint template. Incorporate impressive visuals, symbols, images, and other charts. Modify or reorganize the text boxes as you desire. Experiment with shade schemes and font pairings. Alter, share or cooperate with other people on your work. Download Impact Of Customer Churn On Strategies To Mitigate Customer Churn Template Pdf and find out how to give a successful presentation. Present a perfect display to your team and make your presentation unforgettable. Mentioned slide outlines the impact of a higher attrition rate on the companys financial performance. It contains information about major financial key performance indicators KPIs such as monthly recurring revenue MRR, customer lifetime value CLV, and customer acquisition cost CAC.
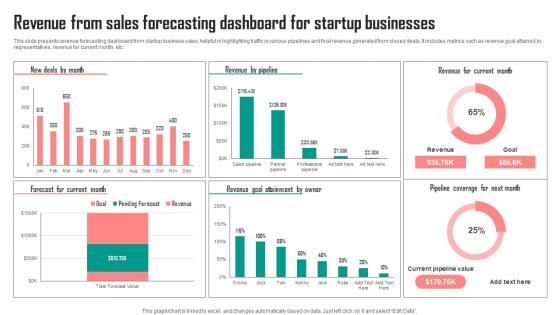
Revenue From Sales Forecasting Dashboard For Startup Businesses Graphics Pdf
This slide presents revenue forecasting dashboard from startup business sales, helpful in highlighting traffic in various pipelines and final revenue generated from closed deals. It includes metrics such as revenue goal attained by representatives, revenue for current month, etc. Showcasing this set of slides titled Revenue From Sales Forecasting Dashboard For Startup Businesses Graphics Pdf. The topics addressed in these templates are Owner, Current Month, Businesses. All the content presented in this PPT design is completely editable. Download it and make adjustments in color, background, font etc. as per your unique business setting. This slide presents revenue forecasting dashboard from startup business sales, helpful in highlighting traffic in various pipelines and final revenue generated from closed deals. It includes metrics such as revenue goal attained by representatives, revenue for current month, etc.
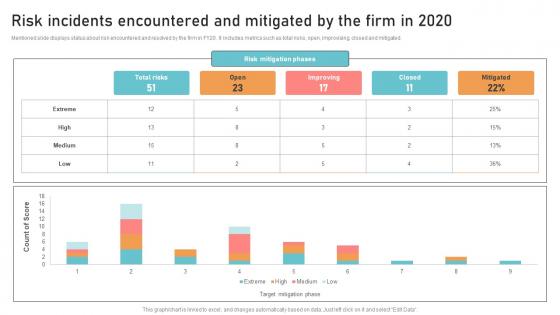
Risk Incidents Encountered And Optimizing Business Integration Designs Pdf
Mentioned slide displays status about risk encountered and resolved by the firm in FY20. It includes metrics such as total risks, open, improvising, closed and mitigated. Retrieve professionally designed Risk Incidents Encountered And Optimizing Business Integration Designs Pdf to effectively convey your message and captivate your listeners. Save time by selecting pre made slideshows that are appropriate for various topics, from business to educational purposes. These themes come in many different styles, from creative to corporate, and all of them are easily adjustable and can be edited quickly. Access them as PowerPoint templates or as Google Slides themes. You do not have to go on a hunt for the perfect presentation because Slidegeeks got you covered from everywhere. Mentioned slide displays status about risk encountered and resolved by the firm in FY20. It includes metrics such as total risks, open, improvising, closed and mitigated.
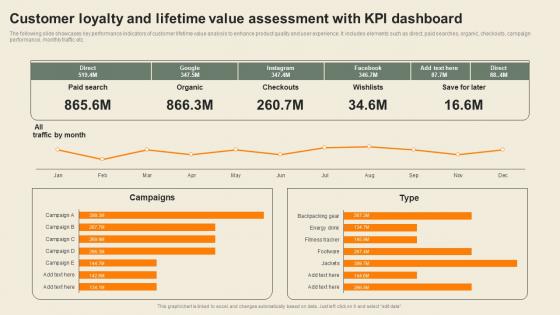
Customer Loyalty And Lifetime Value Usability Of CDP Software Tool Information Pdf
The following slide showcases key performance indicators of customer lifetime value analysis to enhance product quality and user experience. It includes elements such as direct, paid searches, organic, checkouts, campaign performance, monthly traffic etc. Are you in need of a template that can accommodate all of your creative concepts This one is crafted professionally and can be altered to fit any style. Use it with Google Slides or PowerPoint. Include striking photographs, symbols, depictions, and other visuals. Fill, move around, or remove text boxes as desired. Test out color palettes and font mixtures. Edit and save your work, or work with colleagues. Download Customer Loyalty And Lifetime Value Usability Of CDP Software Tool Information Pdf and observe how to make your presentation outstanding. Give an impeccable presentation to your group and make your presentation unforgettable. The following slide showcases key performance indicators of customer lifetime value analysis to enhance product quality and user experience. It includes elements such as direct, paid searches, organic, checkouts, campaign performance, monthly traffic etc.

Post Digitalization Analysing The Impact On Retail Optimizing Retail Operations With Digital DT SS V
This slide help analyses the improving performance of key performance indicators of retail companies after successful digitalization. It includes online sales growth, cart abandonment rate, customer complaints, inventory inaccuracy, time-to-market, supply chain efficiency, foot traffic, and marketing ROI.This Post Digitalization Analysing The Impact On Retail Optimizing Retail Operations With Digital DT SS V is perfect for any presentation, be it in front of clients or colleagues. It is a versatile and stylish solution for organizing your meetings. The Post Digitalization Analysing The Impact On Retail Optimizing Retail Operations With Digital DT SS V features a modern design for your presentation meetings. The adjustable and customizable slides provide unlimited possibilities for acing up your presentation. Slidegeeks has done all the homework before launching the product for you. So, do not wait, grab the presentation templates today This slide help analyses the improving performance of key performance indicators of retail companies after successful digitalization. It includes online sales growth, cart abandonment rate, customer complaints, inventory inaccuracy, time-to-market, supply chain efficiency, foot traffic, and marketing ROI.
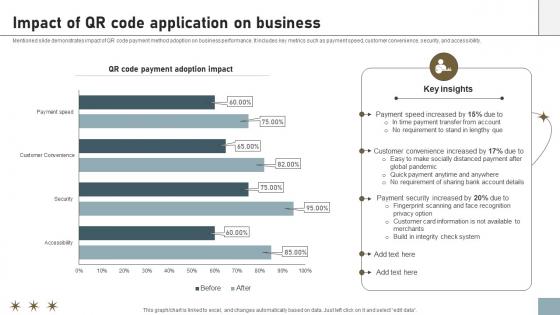
Online Payment Techniques Impact Of QR Code Application On Business
Mentioned slide demonstrates impact of QR code payment method adoption on business performance. It includes key metrics such as payment speed, customer convenience, security, and accessibility. Present like a pro with Online Payment Techniques Impact Of QR Code Application On Business. Create beautiful presentations together with your team, using our easy-to-use presentation slides. Share your ideas in real-time and make changes on the fly by downloading our templates. So whether you are in the office, on the go, or in a remote location, you can stay in sync with your team and present your ideas with confidence. With Slidegeeks presentation got a whole lot easier. Grab these presentations today. Mentioned slide demonstrates impact of QR code payment method adoption on business performance. It includes key metrics such as payment speed, customer convenience, security, and accessibility.
Dashboard For Tracking Viral Marketing Techniques For Generating Brand Awareness Graphics Pdf
This slide showcases the parameters for business organizations to evaluate viral marketing performance. It includes KPIs such as user metrics, campaign metrics, social metrics, engagement rate, viral sign ups, etc. Find highly impressive Dashboard For Tracking Viral Marketing Techniques For Generating Brand Awareness Graphics Pdf on Slidegeeks to deliver a meaningful presentation. You can save an ample amount of time using these presentation templates. No need to worry to prepare everything from scratch because Slidegeeks experts have already done a huge research and work for you. You need to download Dashboard For Tracking Viral Marketing Techniques For Generating Brand Awareness Graphics Pdf for your upcoming presentation. All the presentation templates are 100 percent editable and you can change the color and personalize the content accordingly. Download now This slide showcases the parameters for business organizations to evaluate viral marketing performance. It includes KPIs such as user metrics, campaign metrics, social metrics, engagement rate, viral sign ups, etc.
Dashboard For Tracking Viral Marketing Tracking Word Mouth Marketing Inspiration PDF
This slide showcases the parameters for business organizations to evaluate viral marketing performance. It includes KPIs such as user metrics, campaign metrics, social metrics, engagement rate, viral sign-ups, etc. Find highly impressive Dashboard For Tracking Viral Marketing Tracking Word Mouth Marketing Inspiration PDF on Slidegeeks to deliver a meaningful presentation. You can save an ample amount of time using these presentation templates. No need to worry to prepare everything from scratch because Slidegeeks experts have already done a huge research and work for you. You need to download Dashboard For Tracking Viral Marketing Tracking Word Mouth Marketing Inspiration PDF for your upcoming presentation. All the presentation templates are 100 percent editable and you can change the color and personalize the content accordingly. Download now This slide showcases the parameters for business organizations to evaluate viral marketing performance. It includes KPIs such as user metrics, campaign metrics, social metrics, engagement rate, viral sign-ups, etc.
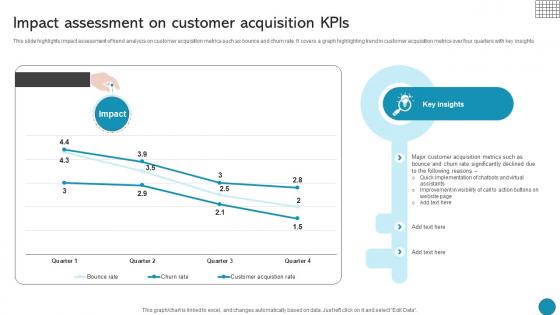
Impact Assessment On Customer Acquisition Kpis Driving Business Success Integrating Product
This slide highlights impact assessment of trend analysis on customer acquisition metrics such as bounce and churn rate. It covers a graph highlighting trend in customer acquisition metrics over four quarters with key insights Are you searching for a Impact Assessment On Customer Acquisition Kpis Driving Business Success Integrating Product that is uncluttered, straightforward, and original Its easy to edit, and you can change the colors to suit your personal or business branding. For a presentation that expresses how much effort you have put in, this template is ideal With all of its features, including tables, diagrams, statistics, and lists, its perfect for a business plan presentation. Make your ideas more appealing with these professional slides. Download Impact Assessment On Customer Acquisition Kpis Driving Business Success Integrating Product from Slidegeeks today. This slide highlights impact assessment of trend analysis on customer acquisition metrics such as bounce and churn rate. It covers a graph highlighting trend in customer acquisition metrics over four quarters with key insights

Increasing Business Awareness Dashboard To Monitor Pay Per Click Advertising Strategy SS V
This slide represent a search engine marketing KPIs indicating crucial aspects of pay per click advertising. It includes metrics such as cost per conversion by month, overall spend, top keywords, monthly conversion and interaction by day. Get a simple yet stunning designed Increasing Business Awareness Dashboard To Monitor Pay Per Click Advertising Strategy SS V. It is the best one to establish the tone in your meetings. It is an excellent way to make your presentations highly effective. So, download this PPT today from Slidegeeks and see the positive impacts. Our easy-to-edit Increasing Business Awareness Dashboard To Monitor Pay Per Click Advertising Strategy SS V can be your go-to option for all upcoming conferences and meetings. So, what are you waiting for Grab this template today. This slide represent a search engine marketing KPIs indicating crucial aspects of pay per click advertising. It includes metrics such as cost per conversion by month, overall spend, top keywords, monthly conversion and interaction by day.
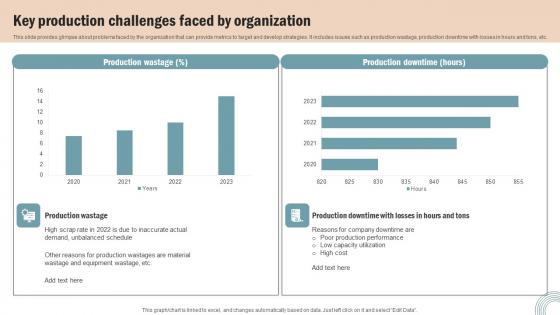
Key Production Challenges Faced Operations Strategy Improve Business Productivity Information Pdf
This slide provides glimpse about problems faced by the organization that can provide metrics to target and develop strategies. It includes issues such as production wastage, production downtime with losses in hours and tons, etc. Make sure to capture your audiences attention in your business displays with our gratis customizable Key Production Challenges Faced Operations Strategy Improve Business Productivity Information Pdf. These are great for business strategies, office conferences, capital raising or task suggestions. If you desire to acquire more customers for your tech business and ensure they stay satisfied, create your own sales presentation with these plain slides. This slide provides glimpse about problems faced by the organization that can provide metrics to target and develop strategies. It includes issues such as production wastage, production downtime with losses in hours and tons, etc.
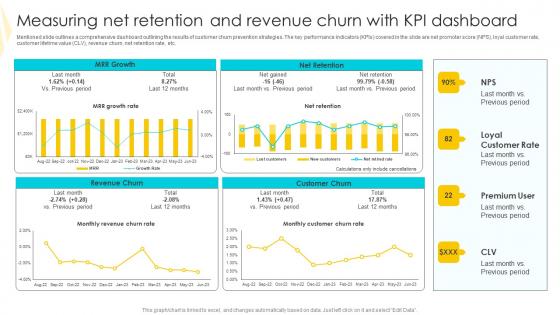
Measuring Net Retention And Strategies To Mitigate Customer Churn Elements Pdf
Mentioned slide outlines a comprehensive dashboard outlining the results of customer churn prevention strategies. The key performance indicators KPIs covered in the slide are net promoter score NPS, loyal customer rate, customer lifetime value CLV, revenue churn, net retention rate, etc. The Measuring Net Retention And Strategies To Mitigate Customer Churn Elements Pdf is a compilation of the most recent design trends as a series of slides. It is suitable for any subject or industry presentation, containing attractive visuals and photo spots for businesses to clearly express their messages. This template contains a variety of slides for the user to input data, such as structures to contrast two elements, bullet points, and slides for written information. Slidegeeks is prepared to create an impression. Mentioned slide outlines a comprehensive dashboard outlining the results of customer churn prevention strategies. The key performance indicators KPIs covered in the slide are net promoter score NPS, loyal customer rate, customer lifetime value CLV, revenue churn, net retention rate, etc.
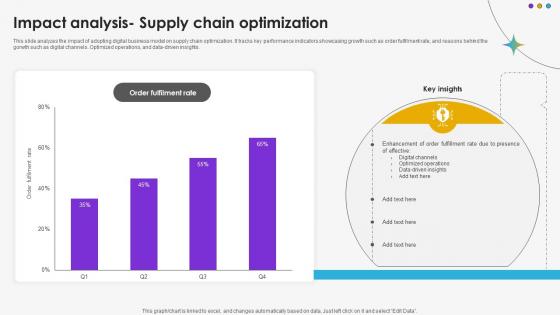
Impact Analysis Supply Chain Optimization DT SS V
This slide analyzes the impact of adopting digital business model on supply chain optimization. It tracks key performance indicators showcasing growth such as order fulfilment rate, and reasons behind the gorwth such as digital channels. Optimized operations, and data-driven insights.Whether you have daily or monthly meetings, a brilliant presentation is necessary. Impact Analysis Supply Chain Optimization DT SS V can be your best option for delivering a presentation. Represent everything in detail using Impact Analysis Supply Chain Optimization DT SS V and make yourself stand out in meetings. The template is versatile and follows a structure that will cater to your requirements. All the templates prepared by Slidegeeks are easy to download and edit. Our research experts have taken care of the corporate themes as well. So, give it a try and see the results. This slide analyzes the impact of adopting digital business model on supply chain optimization. It tracks key performance indicators showcasing growth such as order fulfilment rate, and reasons behind the gorwth such as digital channels. Optimized operations, and data-driven insights.
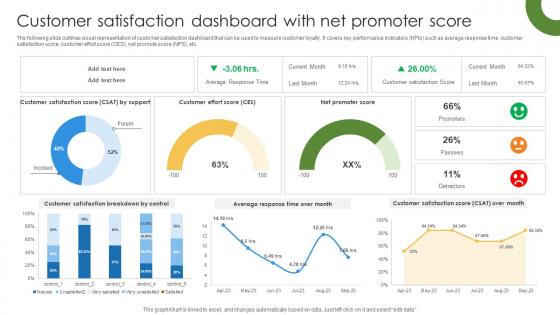
Marketing Growth Strategy Customer Satisfaction Dashboard With Net Promoter Strategy SS V
The following slide outlines visual representation of customer satisfaction dashboard that can be used to measure customer loyalty. It covers key performance indicators KPIs such as average response time, customer satisfaction score, customer effort score CES, net promote score NPS, etc. Get a simple yet stunning designed Marketing Growth Strategy Customer Satisfaction Dashboard With Net Promoter Strategy SS V. It is the best one to establish the tone in your meetings. It is an excellent way to make your presentations highly effective. So, download this PPT today from Slidegeeks and see the positive impacts. Our easy-to-edit Marketing Growth Strategy Customer Satisfaction Dashboard With Net Promoter Strategy SS V can be your go-to option for all upcoming conferences and meetings. So, what are you waiting for Grab this template today. The following slide outlines visual representation of customer satisfaction dashboard that can be used to measure customer loyalty. It covers key performance indicators KPIs such as average response time, customer satisfaction score, customer effort score CES, net promote score NPS, etc.

Immersive Training For Practical Post Training Impact Of Simulation Training On Decision DTE SS V
This slide includes key performance indicators that the company has a positive impact on due to effective training programs such as team collaboration rate, error rate, etc. Formulating a presentation can take up a lot of effort and time, so the content and message should always be the primary focus. The visuals of the PowerPoint can enhance the presenters message, so our Immersive Training For Practical Post Training Impact Of Simulation Training On Decision DTE SS V was created to help save time. Instead of worrying about the design, the presenter can concentrate on the message while our designers work on creating the ideal templates for whatever situation is needed. Slidegeeks has experts for everything from amazing designs to valuable content, we have put everything into Immersive Training For Practical Post Training Impact Of Simulation Training On Decision DTE SS V. This slide includes key performance indicators that the company has a positive impact on due to effective training programs such as team collaboration rate, error rate, etc.
Tracking First Response Time Improving Customer Retention PPT Presentation
The following slide depicts key performance indicators to review call resolution time and offer real time support. It also includes elements such as unsolved calls, weekly response time analysis, best day to call etc. Presenting this PowerPoint presentation, titled Tracking First Response Time Improving Customer Retention PPT Presentation, with topics curated by our researchers after extensive research. This editable presentation is available for immediate download and provides attractive features when used. Download now and captivate your audience. Presenting this Tracking First Response Time Improving Customer Retention PPT Presentation. Our researchers have carefully researched and created these slides with all aspects taken into consideration. This is a completely customizable Tracking First Response Time Improving Customer Retention PPT Presentation that is available for immediate downloading. Download now and make an impact on your audience. Highlight the attractive features available with our PPTs. The following slide depicts key performance indicators to review call resolution time and offer real time support. It also includes elements such as unsolved calls, weekly response time analysis, best day to call etc.
Tracking First Response Time Enhancing Customer Experience Ppt Presentation
The following slide depicts key performance indicators to review call resolution time and offer real time support. It also includes elements such as unsolved calls, weekly response time analysis, best day to call etc. Presenting this PowerPoint presentation, titled Tracking First Response Time Enhancing Customer Experience Ppt Presentation, with topics curated by our researchers after extensive research. This editable presentation is available for immediate download and provides attractive features when used. Download now and captivate your audience. Presenting this Tracking First Response Time Enhancing Customer Experience Ppt Presentation. Our researchers have carefully researched and created these slides with all aspects taken into consideration. This is a completely customizable Tracking First Response Time Enhancing Customer Experience Ppt Presentation that is available for immediate downloading. Download now and make an impact on your audience. Highlight the attractive features available with our PPTs. The following slide depicts key performance indicators to review call resolution time and offer real time support. It also includes elements such as unsolved calls, weekly response time analysis, best day to call etc.
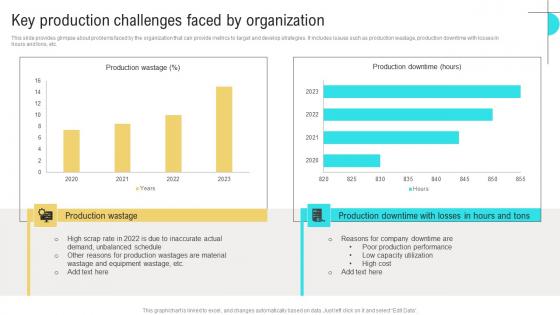
Key Production Challenges Faced Business Performance Optimization New Operations Strategy Pictures Pdf
This slide provides glimpse about problems faced by the organization that can provide metrics to target and develop strategies. It includes issues such as production wastage, production downtime with losses in hours and tons, etc. This Key Production Challenges Faced Business Performance Optimization New Operations Strategy Pictures Pdf is perfect for any presentation, be it in front of clients or colleagues. It is a versatile and stylish solution for organizing your meetings. The Key Production Challenges Faced Business Performance Optimization New Operations Strategy Pictures Pdf features a modern design for your presentation meetings. The adjustable and customizable slides provide unlimited possibilities for acing up your presentation. Slidegeeks has done all the homework before launching the product for you. So, do not wait, grab the presentation templates today This slide provides glimpse about problems faced by the organization that can provide metrics to target and develop strategies. It includes issues such as production wastage, production downtime with losses in hours and tons, etc.
Increasing Business Awareness Tracking Dashboard For Social Media Engagement Strategy SS V
This slide represents a dashboard tracking multiple social media campaigns performance KPIs. It includes metrics such as average impressions per post, average reach, engagement rate, click through rate, reactions and CTR. This Increasing Business Awareness Tracking Dashboard For Social Media Engagement Strategy SS V is perfect for any presentation, be it in front of clients or colleagues. It is a versatile and stylish solution for organizing your meetings. The Increasing Business Awareness Tracking Dashboard For Social Media Engagement Strategy SS V features a modern design for your presentation meetings. The adjustable and customizable slides provide unlimited possibilities for acing up your presentation. Slidegeeks has done all the homework before launching the product for you. So, do not wait, grab the presentation templates today This slide represents a dashboard tracking multiple social media campaigns performance KPIs. It includes metrics such as average impressions per post, average reach, engagement rate, click through rate, reactions and CTR.
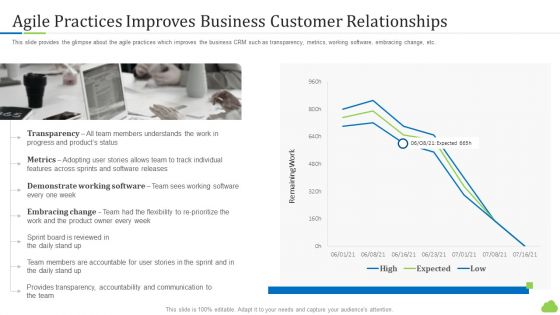
Agile Customer Relationship Management It Agile Practices Improves Business Customer Relationships Topics PDF
This slide provides the glimpse about the agile practices which improves the business CRM such as transparency, metrics, working software, embracing change, etc. Deliver an awe inspiring pitch with this creative agile customer relationship management it agile practices improves business customer relationships topics pdf bundle. Topics like transparency, demonstrate working software, embracing change can be discussed with this completely editable template. It is available for immediate download depending on the needs and requirements of the user.
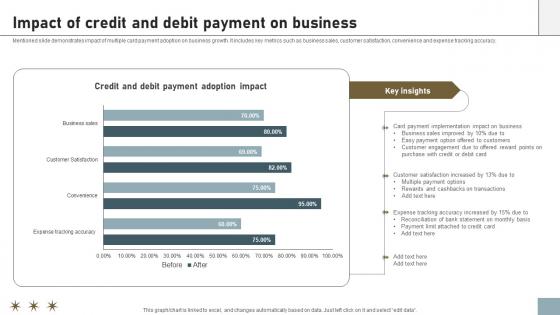
Online Payment Techniques Impact Of Credit And Debit Payment On Business
Mentioned slide demonstrates impact of multiple card payment adoption on business growth. It includes key metrics such as business sales, customer satisfaction, convenience and expense tracking accuracy. Get a simple yet stunning designed Online Payment Techniques Impact Of Credit And Debit Payment On Business. It is the best one to establish the tone in your meetings. It is an excellent way to make your presentations highly effective. So, download this PPT today from Slidegeeks and see the positive impacts. Our easy-to-edit Online Payment Techniques Impact Of Credit And Debit Payment On Business can be your go-to option for all upcoming conferences and meetings. So, what are you waiting for Grab this template today. Mentioned slide demonstrates impact of multiple card payment adoption on business growth. It includes key metrics such as business sales, customer satisfaction, convenience and expense tracking accuracy.
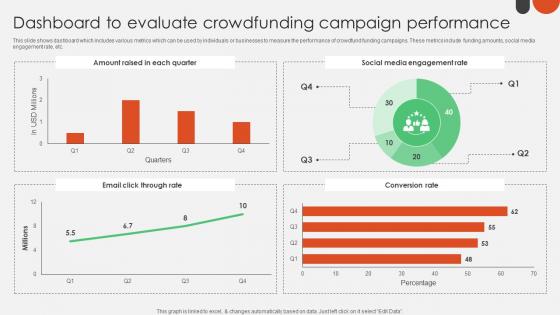
Dashboard To Evaluate Crowdfunding For Nonprofits To Support Fin SS V
This slide shows dashboard which includes various metrics which can be used by individuals or businesses to measure the performance of crowdfund funding campaigns. These metrics include funding amounts, social media engagement rate, etc. Find highly impressive Dashboard To Evaluate Crowdfunding For Nonprofits To Support Fin SS V on Slidegeeks to deliver a meaningful presentation. You can save an ample amount of time using these presentation templates. No need to worry to prepare everything from scratch because Slidegeeks experts have already done a huge research and work for you. You need to download Dashboard To Evaluate Crowdfunding For Nonprofits To Support Fin SS V for your upcoming presentation. All the presentation templates are 100 percent editable and you can change the color and personalize the content accordingly. Download now This slide shows dashboard which includes various metrics which can be used by individuals or businesses to measure the performance of crowdfund funding campaigns. These metrics include funding amounts, social media engagement rate, etc.
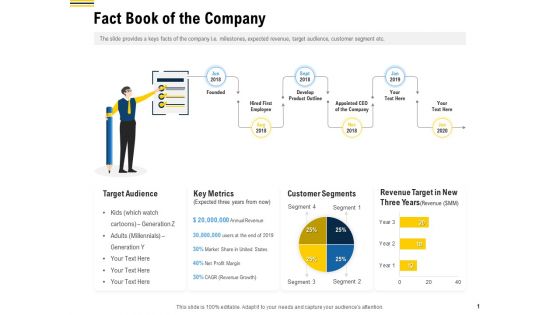
Raise Funding From Pre Seed Money Fact Book Of The Company Sample PDF
Showcasing this set of slides titled raise funding from pre seed money fact book of the company sample pdf. The topics addressed in these templates are target audience, key metrics, customer segments. All the content presented in this PPT design is completely editable. Download it and make adjustments in color, background, font etc. as per your unique business setting.
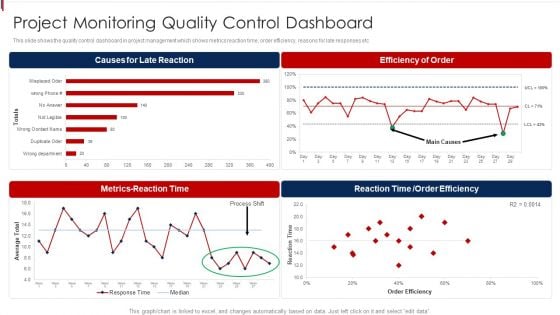
Project Monitoring Quality Control Dashboard Clipart PDF
This slide shows the quality control dashboard in project management which shows metrics reaction time, order efficiency, reasons for late responses etc Showcasing this set of slides titled Project Monitoring Quality Control Dashboard Clipart PDF. The topics addressed in these templates are Causes Late Reaction, Metrics Reaction Time, Efficiency Of Order. All the content presented in this PPT design is completely editable. Download it and make adjustments in color, background, font etc. as per your unique business setting.
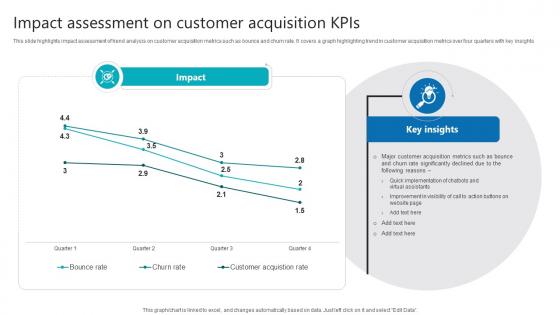
Impact Assessment On Customer Acquisition Kpis Product Analytics Implementation Data Analytics V
This slide highlights impact assessment of trend analysis on customer acquisition metrics such as bounce and churn rate. It covers a graph highlighting trend in customer acquisition metrics over four quarters with key insights The Impact Assessment On Customer Acquisition Kpis Product Analytics Implementation Data Analytics V is a compilation of the most recent design trends as a series of slides. It is suitable for any subject or industry presentation, containing attractive visuals and photo spots for businesses to clearly express their messages. This template contains a variety of slides for the user to input data, such as structures to contrast two elements, bullet points, and slides for written information. Slidegeeks is prepared to create an impression. This slide highlights impact assessment of trend analysis on customer acquisition metrics such as bounce and churn rate. It covers a graph highlighting trend in customer acquisition metrics over four quarters with key insights
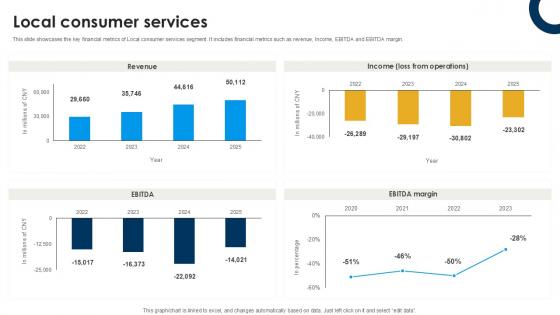
Local Consumer Services International Trade Of Products And Services PPT Example CP SS V
This slide showcases the key financial metrics of Local consumer services segment. It includes financial metrics such as revenue, Income, EBITDA and EBITDA margin. Welcome to our selection of the Local Consumer Services International Trade Of Products And Services PPT Example CP SS V. These are designed to help you showcase your creativity and bring your sphere to life. Planning and Innovation are essential for any business that is just starting out. This collection contains the designs that you need for your everyday presentations. All of our PowerPoints are 100Percent editable, so you can customize them to suit your needs. This multi-purpose template can be used in various situations. Grab these presentation templates today. This slide showcases the key financial metrics of Local consumer services segment. It includes financial metrics such as revenue, Income, EBITDA and EBITDA margin.
Dashboard For Tracking Viral Implementing Social Media Tactics For Boosting WOM Professional Pdf
This slide showcases the parameters for business organizations to evaluate viral marketing performance. It includes KPIs such as user metrics, campaign metrics, social metrics, engagement rate, viral sign ups, etc. Whether you have daily or monthly meetings, a brilliant presentation is necessary. Dashboard For Tracking Viral Implementing Social Media Tactics For Boosting WOM Professional Pdf can be your best option for delivering a presentation. Represent everything in detail using Dashboard For Tracking Viral Implementing Social Media Tactics For Boosting WOM Professional Pdf and make yourself stand out in meetings. The template is versatile and follows a structure that will cater to your requirements. All the templates prepared by Slidegeeks are easy to download and edit. Our research experts have taken care of the corporate themes as well. So, give it a try and see the results. This slide showcases the parameters for business organizations to evaluate viral marketing performance. It includes KPIs such as user metrics, campaign metrics, social metrics, engagement rate, viral sign ups, etc.
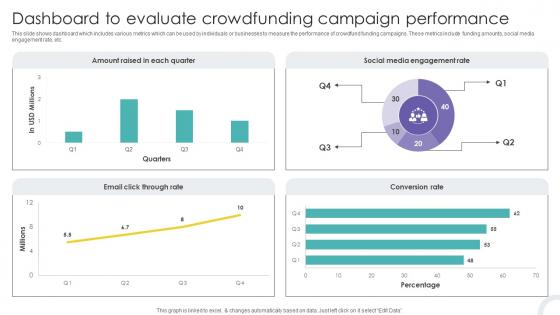
Dashboard To Evaluate Crowdfunding Campaign Crowdfunding Strategies To Raise Funds Fin SS V
This slide shows dashboard which includes various metrics which can be used by individuals or businesses to measure the performance of crowdfund funding campaigns. These metrics include funding amounts, social media engagement rate, etc. Find highly impressive Dashboard To Evaluate Crowdfunding Campaign Crowdfunding Strategies To Raise Funds Fin SS V on Slidegeeks to deliver a meaningful presentation. You can save an ample amount of time using these presentation templates. No need to worry to prepare everything from scratch because Slidegeeks experts have already done a huge research and work for you. You need to download Dashboard To Evaluate Crowdfunding Campaign Crowdfunding Strategies To Raise Funds Fin SS V for your upcoming presentation. All the presentation templates are 100 percent editable and you can change the color and personalize the content accordingly. Download now This slide shows dashboard which includes various metrics which can be used by individuals or businesses to measure the performance of crowdfund funding campaigns. These metrics include funding amounts, social media engagement rate, etc.
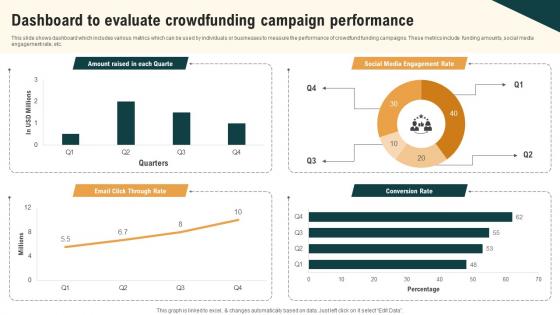
Dashboard To Evaluate Crowdfunding Campaign Real Estate Crowdfunding To Unlock Fin SS V
This slide shows dashboard which includes various metrics which can be used by individuals or businesses to measure the performance of crowdfund funding campaigns. These metrics include funding amounts, social media engagement rate, etc. Find highly impressive Dashboard To Evaluate Crowdfunding Campaign Real Estate Crowdfunding To Unlock Fin SS V on Slidegeeks to deliver a meaningful presentation. You can save an ample amount of time using these presentation templates. No need to worry to prepare everything from scratch because Slidegeeks experts have already done a huge research and work for you. You need to download Dashboard To Evaluate Crowdfunding Campaign Real Estate Crowdfunding To Unlock Fin SS V for your upcoming presentation. All the presentation templates are 100 percent editable and you can change the color and personalize the content accordingly. Download now This slide shows dashboard which includes various metrics which can be used by individuals or businesses to measure the performance of crowdfund funding campaigns. These metrics include funding amounts, social media engagement rate, etc.


 Continue with Email

 Home
Home


