Finance Templates
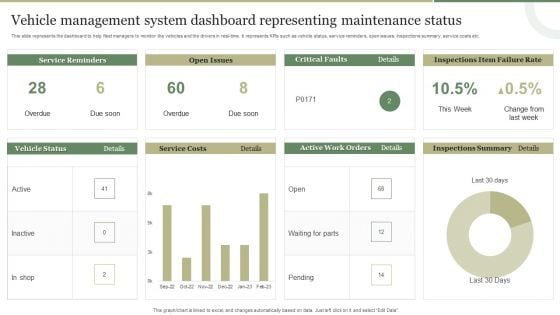
Vehicle Management System Dashboard Representing Maintenance Status Template PDF
This slide represents the dashboard representing the key metrics of the vehicle management system to monitor the vehicles and drivers in real-time. It includes key metrics such as service reminders, fuel costs, open issues, recent comments etc. Pitch your topic with ease and precision using this Vehicle Management System Dashboard Representing Maintenance Status Template PDF This layout presents information on Fuel Costs, Total Cost, Service Reminder, Recent Comments. It is also available for immediate download and adjustment. So, changes can be made in the color, design, graphics or any other component to create a unique layout.
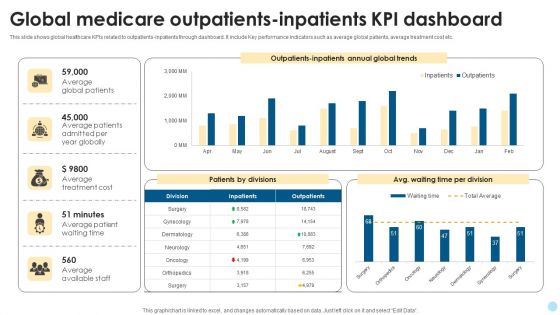
Global Medicare Outpatients Inpatients Kpi Dashboard Template PDF
This slide shows global healthcare KPIs related to outpatients-inpatients through dashboard. It include Key performance indicators such as average global patients, average treatment cost etc. Pitch your topic with ease and precision using this Global Medicare Outpatients Inpatients Kpi Dashboard Template PDF. This layout presents information on Average Treatment Cost, Average Global Patients, Average Available Staff. It is also available for immediate download and adjustment. So, changes can be made in the color, design, graphics or any other component to create a unique layout.
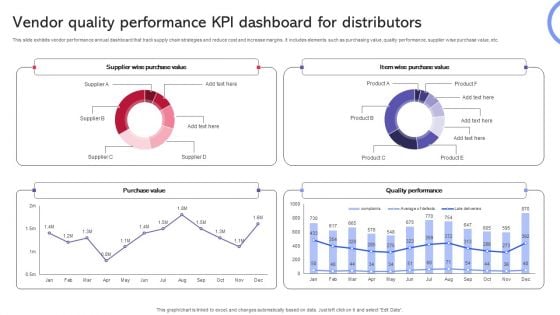
Vendor Quality Performance KPI Dashboard For Distributors Template PDF
This slide exhibits vendor performance annual dashboard that track supply chain strategies and reduce cost and increase margins. It includes elements such as purchasing value, quality performance, supplier wise purchase value, etc. Pitch your topic with ease and precision using this Vendor Quality Performance KPI Dashboard For Distributors Template PDF. This layout presents information on Purchase Value, Quality Performance, Supplier Wise Purchase Value. It is also available for immediate download and adjustment. So, changes can be made in the color, design, graphics or any other component to create a unique layout.
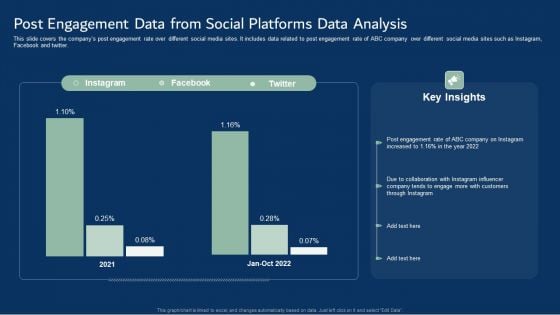
Post Engagement Data From Social Platforms Data Analysis Template PDF
This slide covers the companys post engagement rate over different social media sites. It includes data related to post engagement rate of ABC company over different social media sites such as Instagram, Facebook and twitter. Pitch your topic with ease and precision using this Post Engagement Data From Social Platforms Data Analysis Template PDF. This layout presents information on Post Engagement Data, Social Platforms Data Analysis. It is also available for immediate download and adjustment. So, changes can be made in the color, design, graphics or any other component to create a unique layout.
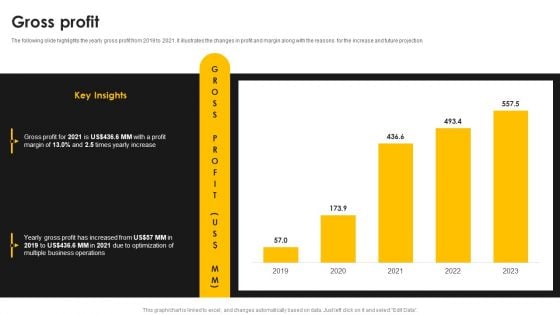
Kantar Consulting Company Outline Gross Profit Template PDF
The following slide highlights the yearly gross profit from 2019 to 2021. it illustrates the changes in profit and margin along with the reasons for the increase and future projection. Take your projects to the next level with our ultimate collection of Kantar Consulting Company Outline Gross Profit Template PDF. Slidegeeks has designed a range of layouts that are perfect for representing task or activity duration, keeping track of all your deadlines at a glance. Tailor these designs to your exact needs and give them a truly corporate look with your own brand colors they will make your projects stand out from the rest.

Financial Highlights For Construction Company Yearly Report Template PDF
This slide showcases report for construction company annual financial highlights that can help in analyzing the financial health of organization and help investors to make informed decisions. It outlines information about turnover, profit before tax, profit after, equity capital and reserves. Pitch your topic with ease and precision using this Financial Highlights For Construction Company Yearly Report Template PDF. This layout presents information on Reserve And Surplus, Profit, Turnover. It is also available for immediate download and adjustment. So, changes can be made in the color, design, graphics or any other component to create a unique layout.
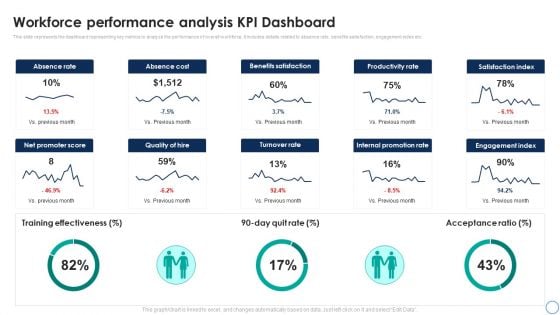
Business Analytics Application Workforce Performance Analysis KPI Dashboard Template PDF
This slide represents the dashboard representing key metrics to analyze the performance of overall workforce. It includes details related to absence rate, benefits satisfaction, engagement index etc. Take your projects to the next level with our ultimate collection of Business Analytics Application Workforce Performance Analysis KPI Dashboard Template PDF. Slidegeeks has designed a range of layouts that are perfect for representing task or activity duration, keeping track of all your deadlines at a glance. Tailor these designs to your exact needs and give them a truly corporate look with your own brand colors theyll make your projects stand out from the rest.
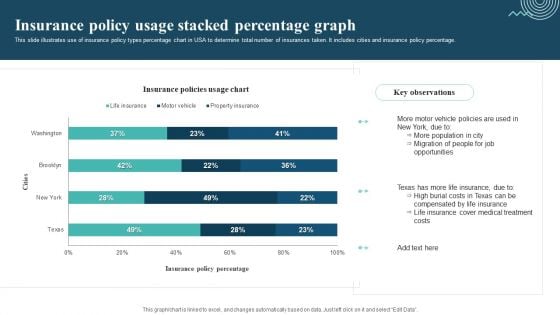
Insurance Policy Usage Stacked Percentage Graph Template PDF
This slide illustrates use of insurance policy types percentage chart in USA to determine total number of insurances taken. It includes cities and insurance policy percentage. Pitch your topic with ease and precision using this Insurance Policy Usage Stacked Percentage Graph Template PDF. This layout presents information on Motor Vehicle Policies, More Population, Migration Of People. It is also available for immediate download and adjustment. So, changes can be made in the color, design, graphics or any other component to create a unique layout.
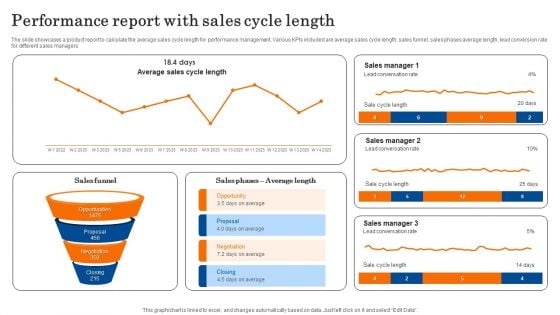
Performance Report With Sales Cycle Length Template PDF
The slide showcases a product report to calculate the average sales cycle length for performance management. Various KPIs included are average sales cycle length, sales funnel, sales phases average length, lead conversion rate for different sales managers. sPitch your topic with ease and precision using this Performance Report With Sales Cycle Length Template PDF. This layout presents information on Sales Manager, Conversation Rate, Opportunity. It is also available for immediate download and adjustment. So, changes can be made in the color, design, graphics or any other component to create a unique layout.
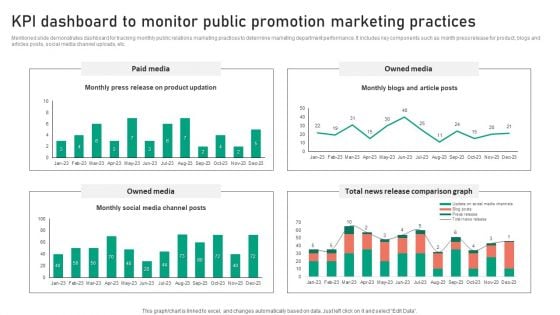
KPI Dashboard To Monitor Public Promotion Marketing Practices Template PDF
Mentioned slide demonstrates dashboard for tracking monthly public relations marketing practices to determine marketing department performance. It includes key components such as month press release for product, blogs and articles posts, social media channel uploads, etc. Pitch your topic with ease and precision using this KPI Dashboard To Monitor Public Promotion Marketing Practices Template PDF. This layout presents information on Paid Media, Owned Media, Total News Release, Comparison Graph. It is also available for immediate download and adjustment. So, changes can be made in the color, design, graphics or any other component to create a unique layout.
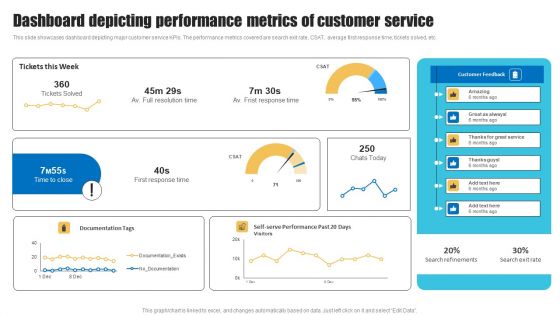
Dashboard Depicting Performance Metrics Of Customer Service Template PDF
This slide showcases dashboard depicting major customer service KPIs. The performance metrics covered are search exit rate, CSAT, average first response time, tickets solved, etc. Take your projects to the next level with our ultimate collection of Dashboard Depicting Performance Metrics Of Customer Service Template PDF. Slidegeeks has designed a range of layouts that are perfect for representing task or activity duration, keeping track of all your deadlines at a glance. Tailor these designs to your exact needs and give them a truly corporate look with your own brand colors they will make your projects stand out from the rest.
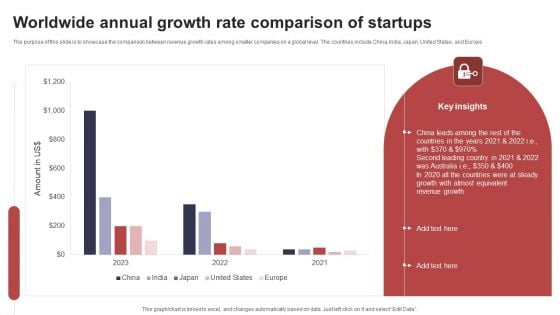
Worldwide Annual Growth Rate Comparison Of Startups Template PDF
The purpose of this slide is to showcase the comparison between revenue growth rates among smaller companies on a global level. The countries include China, India, Japan, United States, and Europe. Pitch your topic with ease and precision using this Worldwide Annual Growth Rate Comparison Of Startups Template PDF. This layout presents information on China Leads Among, Almost Equivalent, Revenue Growth. It is also available for immediate download and adjustment. So, changes can be made in the color, design, graphics or any other component to create a unique layout.
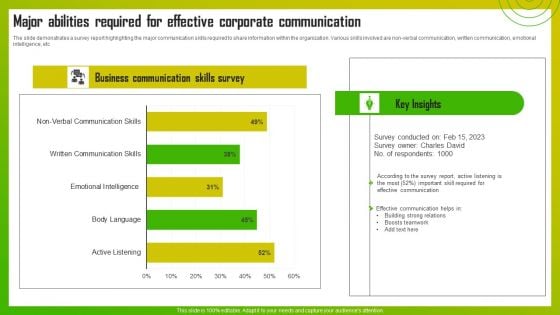
Major Abilities Required For Effective Corporate Communication Template PDF
The slide demonstrates a survey report highlighting the major communication skills required to share information within the organization. Various skills involved are non-verbal communication, written communication, emotional intelligence, etc. Pitch your topic with ease and precision using this Major Abilities Required For Effective Corporate Communication Template PDF. This layout presents information on Effective Communication, Skill Required, Boosts Teamwork. It is also available for immediate download and adjustment. So, changes can be made in the color, design, graphics or any other component to create a unique layout.
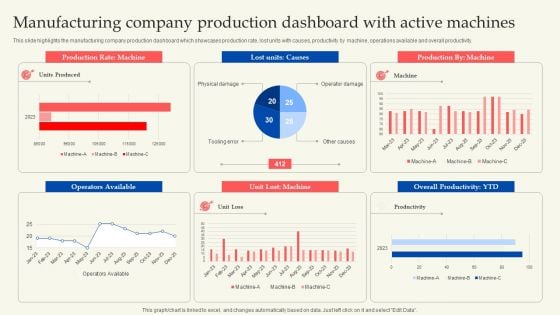
Manufacturing Company Production Dashboard With Active Machines Template PDF
This slide highlights the manufacturing company production dashboard which showcases production rate, lost units with causes, productivity by machine, operations available and overall productivity. Take your projects to the next level with our ultimate collection of Manufacturing Company Production Dashboard With Active Machines Template PDF. Slidegeeks has designed a range of layouts that are perfect for representing task or activity duration, keeping track of all your deadlines at a glance. Tailor these designs to your exact needs and give them a truly corporate look with your own brand colors they will make your projects stand out from the rest.
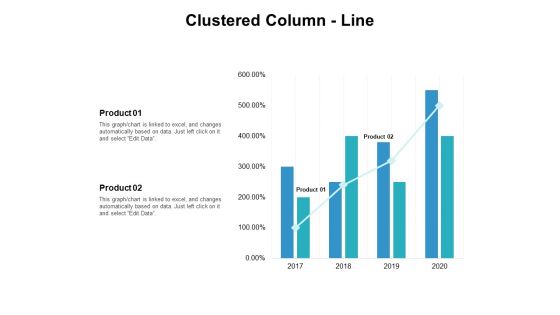
Clustered Column Line Ppt PowerPoint Presentation Pictures Infographic Template
Presenting this set of slides with name clustered column line ppt powerpoint presentation pictures infographic template. The topics discussed in this slide is clustered column line. This is a completely editable PowerPoint presentation and is available for immediate download. Download now and impress your audience.
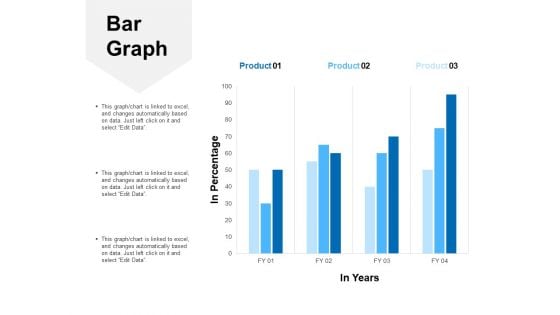
Bar Graph Analysis Ppt PowerPoint Presentation Show Template
Presenting this set of slides with name bar graph analysis ppt powerpoint presentation show template. The topics discussed in these slides are bar graph, product 01 to product 03. This is a completely editable PowerPoint presentation and is available for immediate download. Download now and impress your audience.
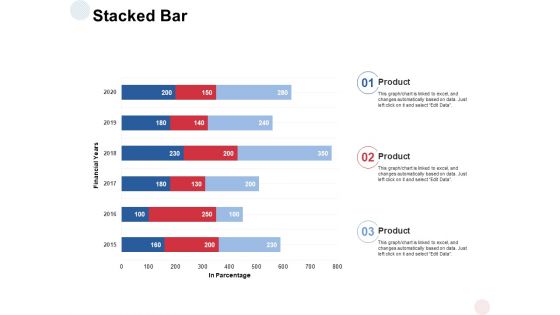
Stacked Bar Analysis Ppt PowerPoint Presentation Styles Graphics Template
Presenting this set of slides with name stacked bar analysis ppt powerpoint presentation styles graphics template. The topics discussed in these slides are stacked bar, financial years, percentage. This is a completely editable PowerPoint presentation and is available for immediate download. Download now and impress your audience.
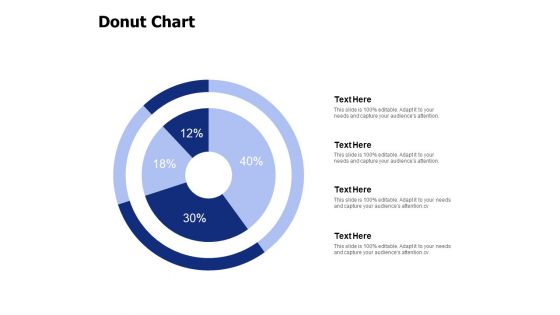
Donut Chart Ppt PowerPoint Presentation File Infographic Template
Presenting this set of slides with name donut chart ppt powerpoint presentation file infographic template. The topics discussed in these slide is donut chart. This is a completely editable PowerPoint presentation and is available for immediate download. Download now and impress your audience.
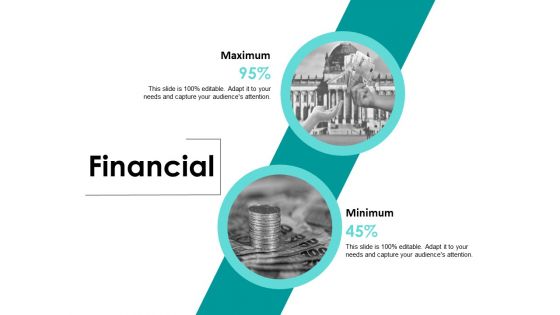
Financial Medium Ppt PowerPoint Presentation Inspiration Graphics Template
Presenting this set of slides with name financial medium ppt powerpoint presentation inspiration graphics template. This is a two stage process. The stages in this process are maximum, minimum, financial. This is a completely editable PowerPoint presentation and is available for immediate download. Download now and impress your audience.
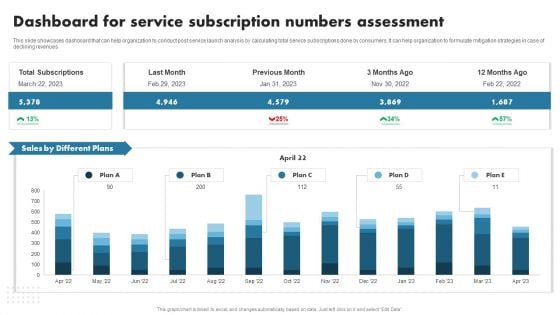
Enhancing Customer Outreach Dashboard For Service Subscription Numbers Template PDF
This slide showcases dashboard that can help organization to conduct post service launch analysis by calculating total service subscriptions done by consumers. It can help organization to formulate mitigation strategies in case of declining revenues. This Enhancing Customer Outreach Dashboard For Service Subscription Numbers Template PDF from Slidegeeks makes it easy to present information on your topic with precision. It provides customization options, so you can make changes to the colors, design, graphics, or any other component to create a unique layout. It is also available for immediate download, so you can begin using it right away. Slidegeeks has done good research to ensure that you have everything you need to make your presentation stand out. Make a name out there for a brilliant performance.
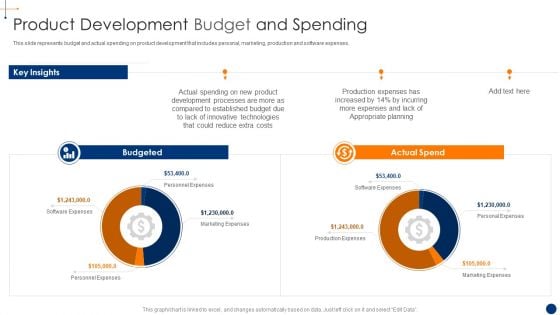
New Product Development Process Optimization Product Development Budget Template PDF
This slide represents budget and actual spending on product development that includes personal, marketing, production and software expenses. Deliver an awe inspiring pitch with this creative new product development process optimization product cost management microsoft pdf bundle. Topics like product development budget and spending can be discussed with this completely editable template. It is available for immediate download depending on the needs and requirements of the user.
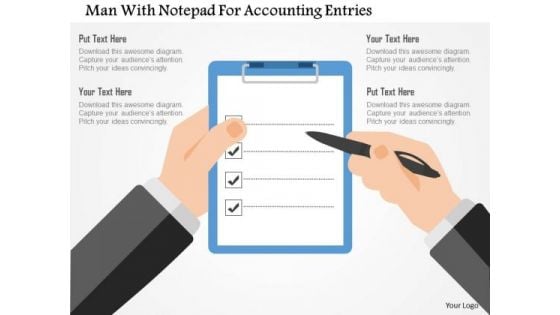
Business Diagram Man With Notepad For Accounting Entries Presentation Template
This business slide has been designed man and note pad. You may download this slide to depict accounting entries. Grab the attention of your listeners with this professional slide.
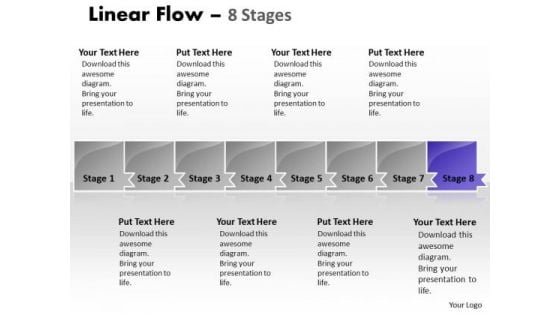
Usa Ppt Background Parellel Representation Video Of 8 Issues 9 Graphic
We present our USA PPT Background parallel representation video of 8 issues 9 Graphic.Use our Advertising PowerPoint Templates because, Present your views using our innovative slides and be assured of leaving a lasting impression. Use our Shapes PowerPoint Templates because, Stable ideas are the building blocks of a successful structure. Use our Business PowerPoint Templates because,Blaze a brilliant trail from point to point. Use our Finance PowerPoint Templates because,Use our templates for your colleagues knowledge to feed. Use our Process and Flows PowerPoint Templates because, Profit fairly earned is what you believe infused these PowerPoint slides for presentations relating to abstract, algorithm, arrow, business, chart, color, connection, design, development, direction, element, flow, graph, linear, management, model, organization, plan, process, program, section, segment, set, sign, solution, strategy, symbol, technology. The prominent colors used in the PowerPoint template are Purple, Gray, and Black Our Usa Ppt Background Parellel Representation Video Of 8 Issues 9 Graphic are based on experience. They do not contain anything fanciful.
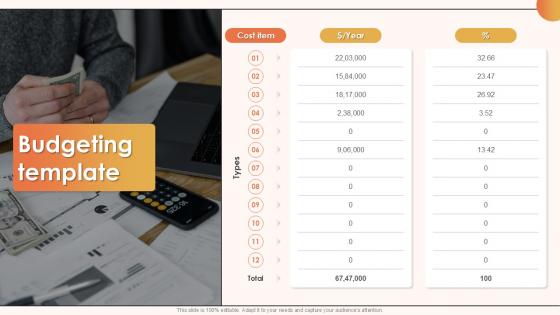
Budgeting Template Ppt Slides Structure
Create an editable Budgeting Template Ppt Slides Structure that communicates your idea and engages your audience. Whether you are presenting a business or an educational presentation, pre-designed presentation templates help save time. Budgeting Template Ppt Slides Structure is highly customizable and very easy to edit, covering many different styles from creative to business presentations. Slidegeeks has creative team members who have crafted amazing templates. So, go and get them without any delay. Break into exclusive circles by using our professionally crafted Budgeting template ppt slides structure . This visually appealing design assure to make compelling impression that helps to position your business effectively in high level discussion.
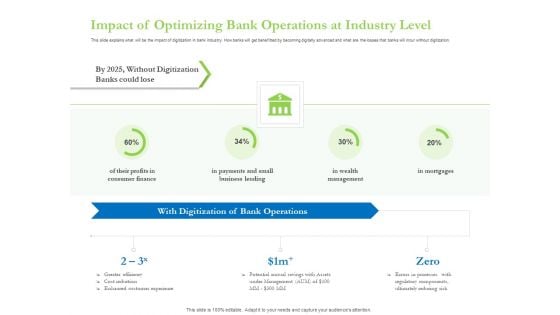
Enhancing Financial Institution Operations Impact Of Optimizing Bank Operations At Industry Level Guidelines PDF
Deliver and pitch your topic in the best possible manner with this enhancing financial institution operations impact of optimizing bank operations at industry level guidelines pdf. Use them to share invaluable insights on management, business, consumer, finance and impress your audience. This template can be altered and modified as per your expectations. So, grab it now.
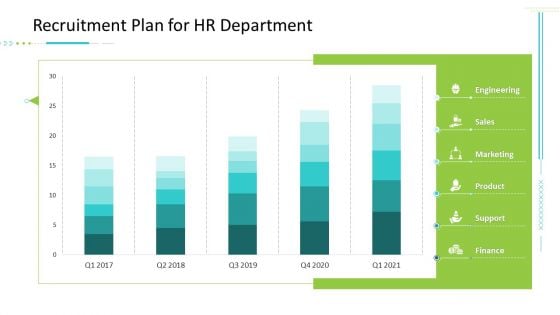
Strategic Action Plan For Business Organization Recruitment Plan For Hr Department Sales Slides PDF
Deliver and pitch your topic in the best possible manner with this strategic action plan for business organization recruitment plan for hr department sales slides pdf. Use them to share invaluable insights on engineering, marketing, product, support, finance and impress your audience. This template can be altered and modified as per your expectations. So, grab it now.
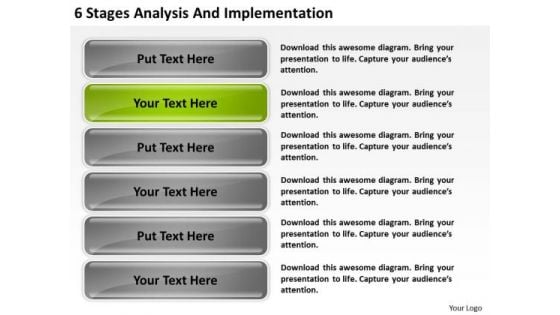
Implementation Non Emergency Transportation Business Plan PowerPoint Slides
We present our implementation non emergency transportation business plan PowerPoint Slides.Download our Business PowerPoint Templates because It will let you Set new benchmarks with our PowerPoint Templates and Slides. They will keep your prospects well above par. Download and present our Signs PowerPoint Templates because It is Aesthetically crafted by artistic young minds. Our PowerPoint Templates and Slides are designed to display your dexterity. Download and present our Sales PowerPoint Templates because Our PowerPoint Templates and Slides are topically designed to provide an attractive backdrop to any subject. Download our Finance PowerPoint Templates because Watching this your Audience will Grab their eyeballs, they wont even blink. Use our Marketing PowerPoint Templates because Our PowerPoint Templates and Slides are effectively colour coded to prioritise your plans They automatically highlight the sequence of events you desire.Use these PowerPoint slides for presentations relating to list, layout, business, poster, banner, new, vector, abstract, modern, sale, design, booklet, pattern, wallpaper, page, breadboard, model, form, funky, print, red, glowing, yellow, line, celebrate, template, circle, brochure, graphic, finance, decor, element, digital, card, title, creative, illustration, pink, shiny, backdrop, web, cover, trendy, colorful, empty, art, style, background, commerce, advertising. The prominent colors used in the PowerPoint template are Green, Gray, Black. Win easily with our Implementation Non Emergency Transportation Business Plan PowerPoint Slides. Dont pass up this opportunity to shine.
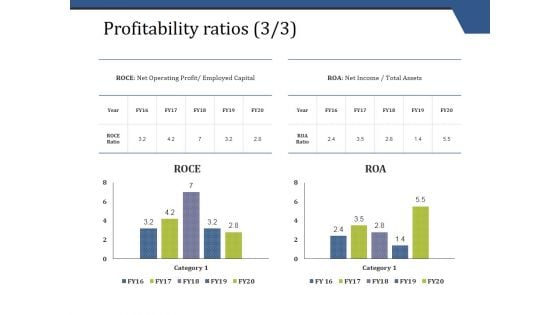
Profitability Ratios Template 3 Ppt PowerPoint Presentation Infographic Template Visual Aids
This is a profitability ratios template 3 ppt powerpoint presentation infographic template visual aids. This is a two stage process. The stages in this process are business, finance, marketing, analysis, investment.
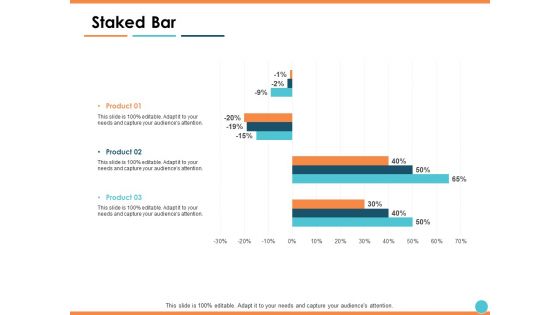
Staked Bar Planning Business Ppt PowerPoint Presentation Infographic Template Infographic Template
This is a staked bar planning business ppt powerpoint presentation infographic template infographic template. This is a three stage process. The stages in this process are finance, marketing, analysis, business, investment.
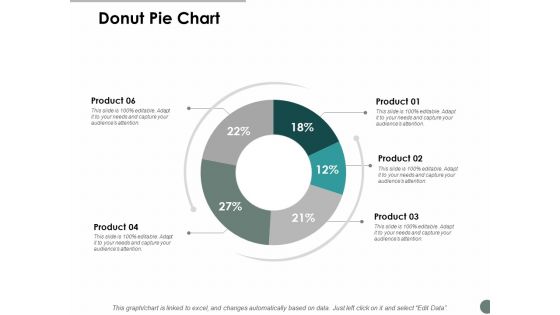
Donut Pie Chart Marketing Ppt Powerpoint Presentation Infographic Template Graphics Template
This is a donut pie chart marketing ppt powerpoint presentation infographic template graphics template. This is a six stage process. The stages in this process are finance, marketing, management, investment, analysis.
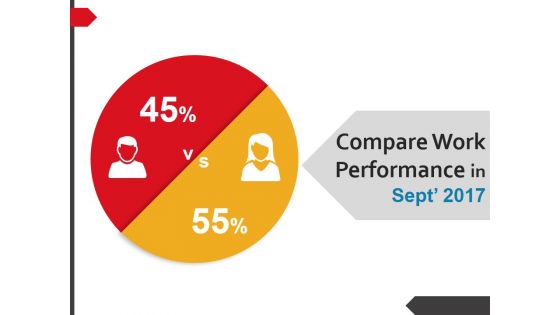
Compare Work Performance In Ppt PowerPoint Presentation Infographic Template Graphics Template
This is a compare work performance in ppt powerpoint presentation infographic template graphics template. This is a two stage process. The stages in this process are business, management, finance, marketing, strategy, analysis, compare.
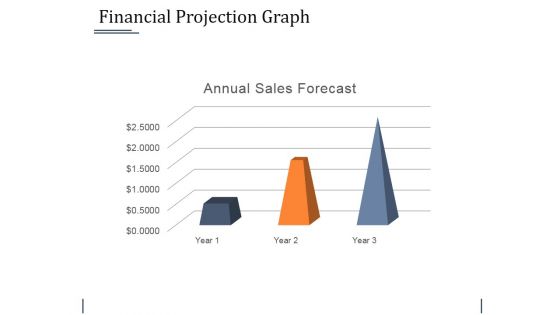
Financial Projection Graph Template 2 Ppt PowerPoint Presentation Infographic Template Gallery
This is a financial projection graph template 2 ppt powerpoint presentation infographic template gallery. This is a three stage process. The stages in this process are business, bar graph, finance, marketing, strategy, analysis.
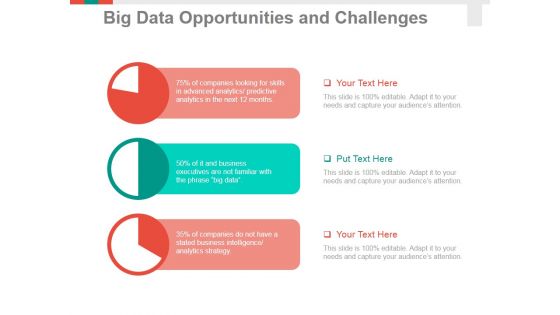
Big Data Opportunities And Challenges Template 1 Ppt PowerPoint Presentation Infographic Template Summary
This is a big data opportunities and challenges template 1 ppt powerpoint presentation infographic template summary. This is a three stage process. The stages in this process are business, pie chart, finance, marketing, analysis, strategy.
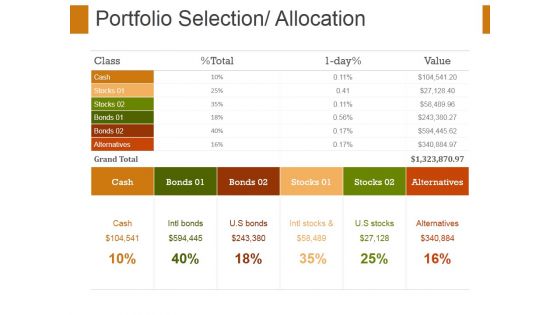
Portfolio Selection Allocation Template 1 Ppt PowerPoint Presentation Infographic Template Guidelines
This is a portfolio selection allocation template 1 ppt powerpoint presentation infographic template guidelines. This is a two stage process. The stages in this process are business, finance, marketing, strategy, comparison, success.
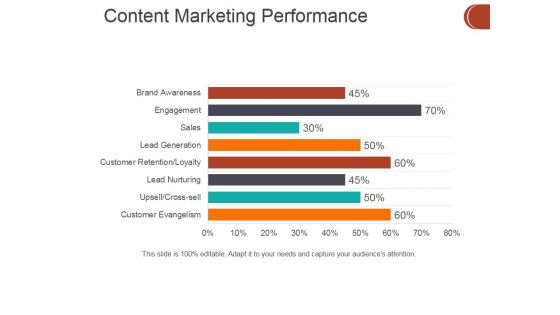
Content Marketing Performance Template 1 Ppt PowerPoint Presentation Infographic Template Brochure
This is a content marketing performance template 1 ppt powerpoint presentation infographic template brochure. This is a eight stage process. The stages in this process are business, finance, marketing, strategy, analysis.
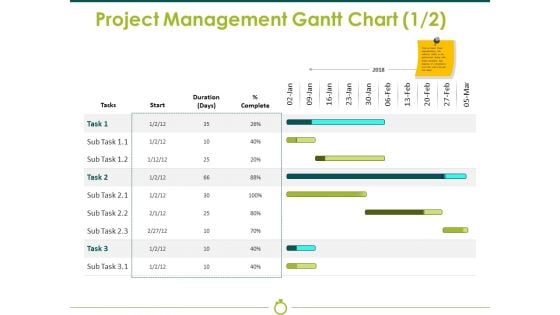
Project Management Gantt Chart Template 1 Ppt PowerPoint Presentation Gallery Graphics Template
This is a project management gantt chart template 1 ppt powerpoint presentation gallery graphics template. This is a two stage process. The stages in this process are start, duration, complete, business, finance.
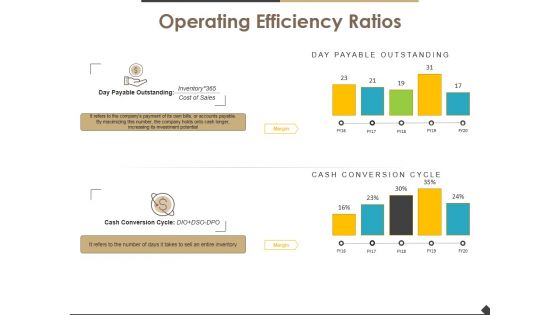
Operating Efficiency Ratios Template 2 Ppt PowerPoint Presentation Infographic Template Guide
This is a operating efficiency ratios template 2 ppt powerpoint presentation infographic template guide. This is a two stage process. The stages in this process are operating efficiency ratios, finance, marketing, strategy, business.
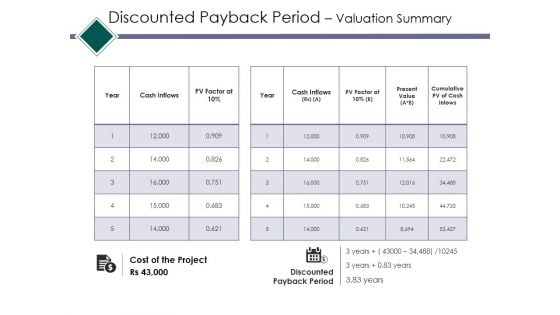
Discounted Payback Period Valuation Summary Ppt PowerPoint Presentation Infographic Template Infographic Template
This is a discounted payback period valuation summary ppt powerpoint presentation infographic template infographic template. This is a two stage process. The stages in this process are advantages, disadvantages, finance, marketing, strategy, business.
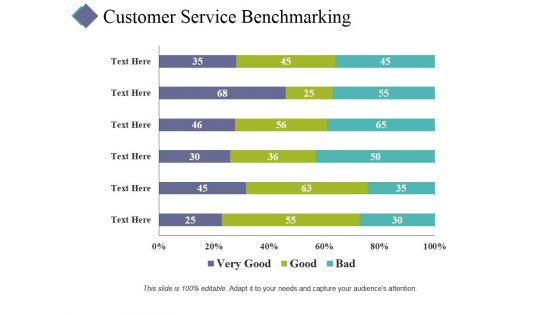
Customer Service Benchmarking Template 1 Ppt PowerPoint Presentation Infographic Template Shapes
This is a customer service benchmarking template 1 ppt powerpoint presentation infographic template shapes. This is a three stage process. The stages in this process are business, finance, marketing, strategy, analysis.
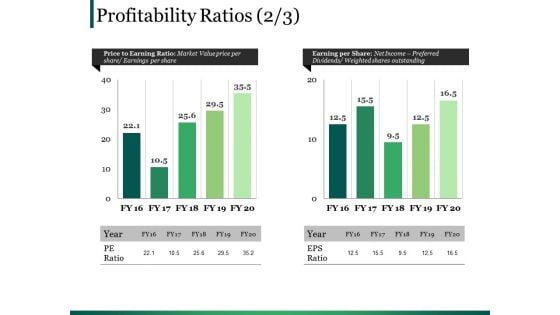
Profitability Ratios Template 4 Ppt PowerPoint Presentation Infographic Template Clipart Images
This is a profitability ratios template 4 ppt powerpoint presentation infographic template clipart images. This is a two stage process. The stages in this process are business, marketing, bar, finance, planning.
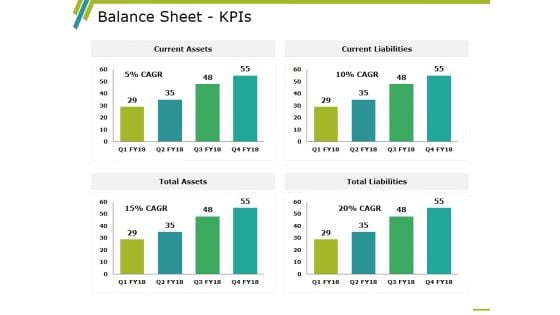
Balance Sheet Kpis Template 3 Ppt PowerPoint Presentation Infographic Template Demonstration
This is a balance sheet kpis template 3 ppt powerpoint presentation infographic template demonstration. This is a four stage process. The stages in this process are balance sheet, finance, marketing, strategy, analysis.
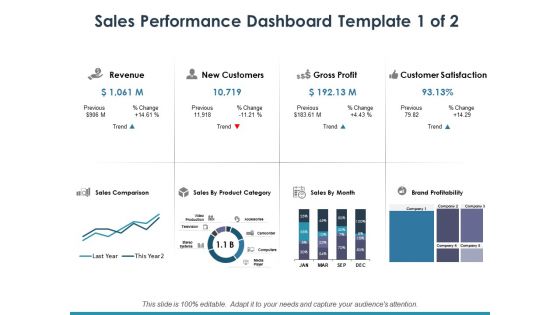
Sales Performance Dashboard Template 1 Ppt PowerPoint Presentation Infographic Template Maker
This is a sales performance dashboard template 1 ppt powerpoint presentation infographic template maker. This is a eight stage process. The stages in this process are dollar, business, finance, marketing.
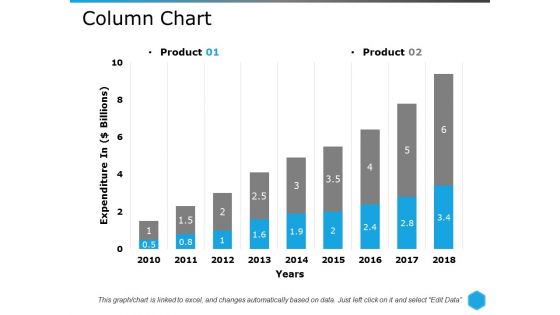
Column Chart Template 2 Ppt PowerPoint Presentation Infographic Template Example Introduction
This is a column chart template 2 ppt powerpoint presentation infographic template example introduction. This is a two stage process. The stages in this process are column chart, finance, analysis, marketing, strategy.
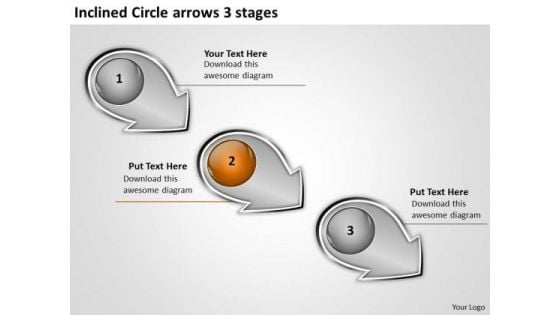
Inclined Circle Arrows 3 Stages Ppt Flowcharts Vision PowerPoint Slides
We present our inclined circle arrows 3 stages ppt flowcharts vision PowerPoint Slides. Use our Finance PowerPoint Templates because, this one depicts the popular chart. Use our Process and Flows PowerPoint Templates because, Now use this slide to bullet point your views. Use our Business PowerPoint Templates because, Marketing Strategy Business Template:- Maximizing sales of your product is the intended destination. Use our Circle Charts PowerPoint Templates because, you have it all down to a T. Use our Shapes PowerPoint Templates because, Different people with differing ideas and priorities perform together to score. Use these PowerPoint slides for presentations relating to Arrow, business, circle, circular, collection, connection, cursor, decoration, design, dimensional, direction, element, icon, illustration, information, modern, motion, perspective, process, recycle, recycling, reflective, shape, shiny, sign, symbol, technology. The prominent colors used in the PowerPoint template are Orange, White, and Black Breathe easy with our Inclined Circle Arrows 3 Stages Ppt Flowcharts Vision PowerPoint Slides. Maintain a steady rate of thought.
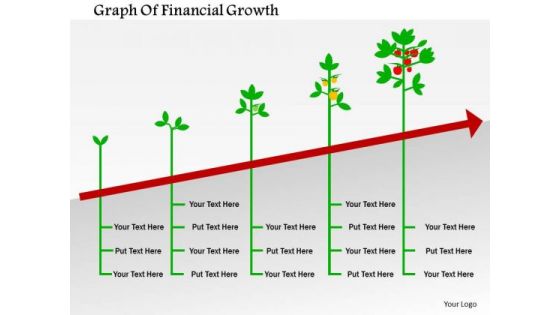
Business Diagram Graph Of Financial Growth Presentation Template
Tree design bar graph has been used to craft this power point template diagram. This PPT contains the concept of financial growth. Use this PPT diagram for finance and business related presentations.
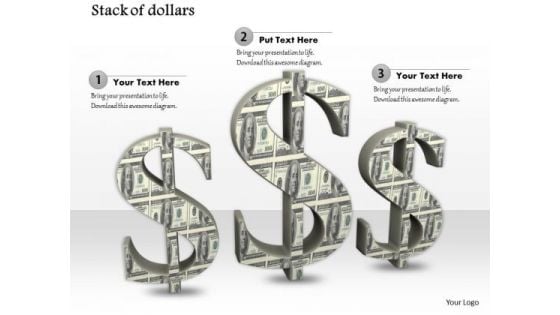
0814 Dollar Currency Symbols PowerPoint Template Image Graphics For PowerPoint
The above image provides background of dollar currency symbols. Adjust the above image of dollar symbols in presentations relating to finance and money. Dazzle the audience with your thoughts.
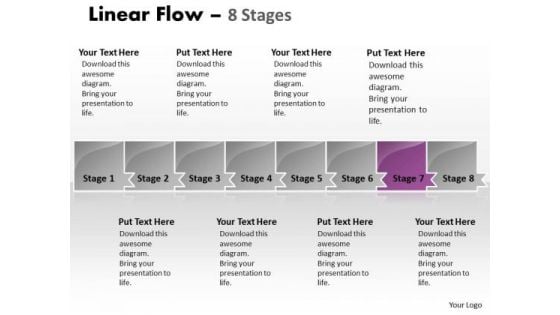
Usa Ppt Background Parellel Representation Video Of 8 Issues Graphic
We present our USA PPT Background parallel representation video of 8 issues Graphic. Use our Advertising PowerPoint Templates because, Like your thoughts arrows are inherently precise and true. Use our Shapes PowerPoint Templates because, It is in your DNA to analyst possible causes to the minutest detail. Use our Business PowerPoint Templates because; motivate your team to cross all barriers. Use our Finance PowerPoint Templates because; Employ the right colors for your brilliant ideas. Use our Process and Flows PowerPoint Templates because, Clarity of thought has been the key to your growth. Use these PowerPoint slides for presentations relating to abstract, algorithm, arrow, business, chart, color, connection, design, development, direction, element, flow, graph, linear, management, model, organization, plan, process, program, section, segment, set, sign, solution, strategy, symbol, technology. The prominent colors used in the PowerPoint template are Purple, Gray, and Black Smash the ceiling with our Usa Ppt Background Parellel Representation Video Of 8 Issues Graphic. Blow thru with your thoughts.
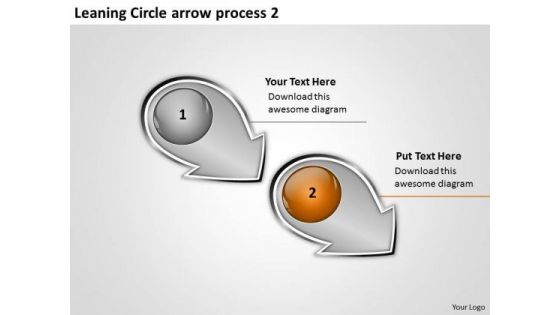
Leaning Circle Arrow Process 2 Flow Diagram Slides PowerPoint
We present our leaning circle arrow process 2 flow diagram Slides PowerPoint. Use our Finance PowerPoint Templates because; emphasize the process of your business/corporate growth. Use our Process and Flows PowerPoint Templates because, you have analyzed the illness and know the need. Use our Business PowerPoint Templates because, determine your targets and sequence them as per your priorities. Use our Circle Charts PowerPoint Templates because; Help them align their arrows to consistently be accurate. Use our Shapes PowerPoint Templates because, an occasion for gifting and giving. Use these PowerPoint slides for presentations relating to Arrow, business, circle, circular, collection, connection, cursor, decoration, design, dimensional, direction, element, icon, illustration, information, modern, motion, perspective, process, recycle, recycling, reflective, shape, shiny, sign, symbol, technology. The prominent colors used in the PowerPoint template are Orange, White, and Black Our Leaning Circle Arrow Process 2 Flow Diagram Slides PowerPoint can be very feisty. They takeup cudgels on your behalf.
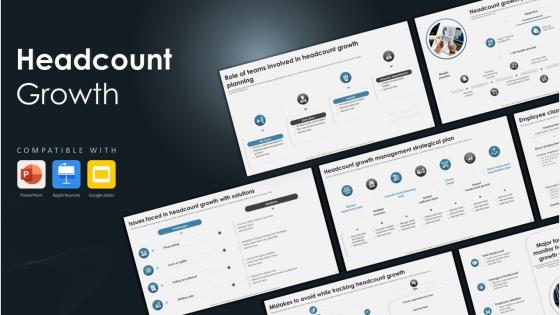
Headcount Growth Powerpoint Ppt Template
This Headcount Growth Powerpoint Ppt Template is designed to help you retain your audiences attention. This content-ready PowerPoint Template enables you to take your audience on a journey and share information in a way that is easier to recall. It helps you highlight the crucial parts of your work so that the audience does not get saddled with information download. This Headcount Growth Process,Headcount Growth Management,Headcount Growth Framework,Headcount Growth Practices,Headcount Growth Strategies-slide PPT Deck comes prepared with the graphs and charts you could need to showcase your information through visuals. You only need to enter your own data in them. Download this editable PowerPoint Theme and walk into that meeting with confidence. Introducing our comprehensive Headcount Growth PowerPoint PPT presentation your strategic guide to managing and optimizing workforce expansion. Dive into the intricacies of the headcount growth process, exploring methodologies and best practices for effective management. This presentation navigates through the stages of headcount growth, from planning and recruitment to retention strategies. Equip your team with insights into workforce scaling, resource allocation, and performance management. With visually engaging slides and expert insights, our Headcount Growth PPT serves as your compass for achieving sustainable and impactful growth. Whether you are an HR professional, business leader, or part of a strategic planning team, this presentation empowers you to navigate the complexities of expanding your workforce.
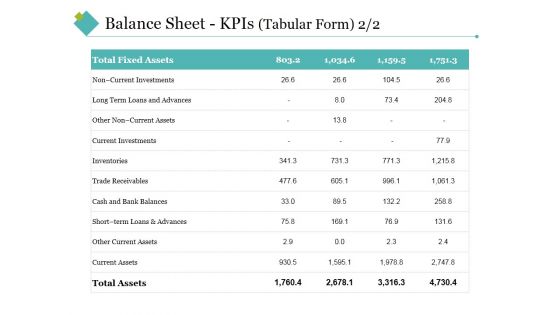
Balance Sheet Kpis Template 2 Ppt PowerPoint Presentation Infographic Template Background Images
This is a balance sheet kpis template 2 ppt powerpoint presentation infographic template background images. This is a four stage process. The stages in this process are total fixed assets, current assets, total assets, inventories, current investments.
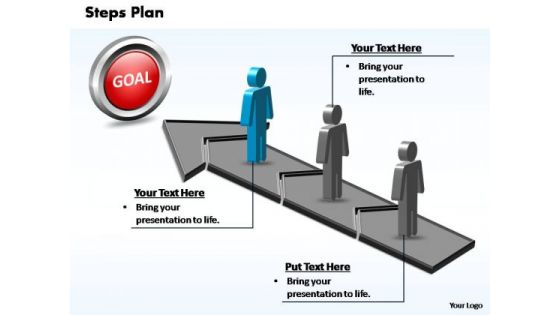
PowerPoint Template Teamwork Steps Plan 3 Stages Style 2 Ppt Template
PowerPoint Template Teamwork Steps Plan 3 Stages Style 2 PPT Template-This Business Powerpoint Template Shows the one step which consists of three stages to achieve the goal. Use this another graphic design to represent a continuing sequence of stages, tasks, or events and emphasize the connection between all components.-PowerPoint Template Teamwork Steps Plan 3 Stages Style 2 PPT Template Many feel defeated by what has befallen them. Brush up their courage with our PowerPoint Template Teamwork Steps Plan 3 Stages Style 2 Ppt Template.
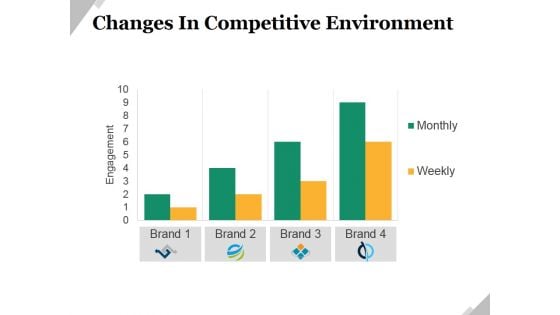
Changes In Competitive Environment Template 1 Ppt PowerPoint Presentation Infographic Template Slide Portrait
This is a changes in competitive environment template 1 ppt powerpoint presentation infographic template slide portrait. This is a four stage process. The stages in this process are competitive, business, marketing, engagement, growth.
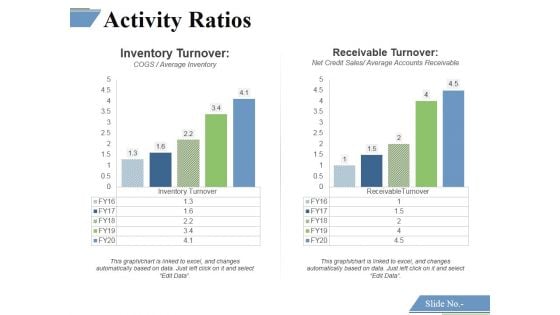
Activity Ratios Template 2 Ppt PowerPoint Presentation Infographic Template Slide Portrait
This is a activity ratios template 2 ppt powerpoint presentation infographic template slide portrait. This is a two stage process. The stages in this process are inventory turnover, receivable turnover.
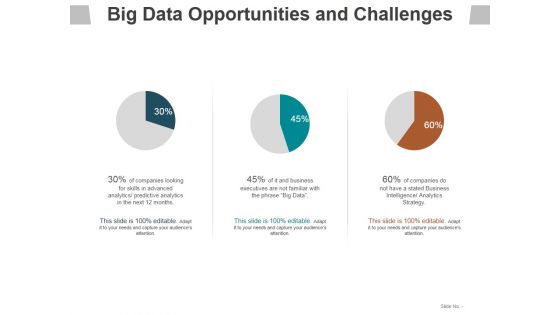
Big Data Opportunities And Challenges Template 2 Ppt PowerPoint Presentation Infographic Template Slides
This is a big data opportunities and challenges template 2 ppt powerpoint presentation infographic template slides. This is a three stage process. The stages in this process are business, management, marketing, process, success.
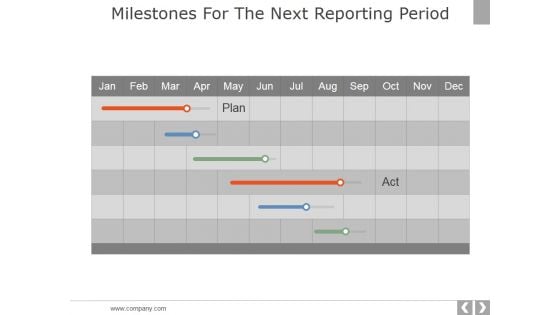
Milestones For The Next Reporting Period Template 2 Ppt PowerPoint Presentation Infographic Template Outfit
This is a milestones for the next reporting period template 2 ppt powerpoint presentation infographic template outfit. This is a six stage process. The stages in this process are business, strategy, marketing, analysis, compare.
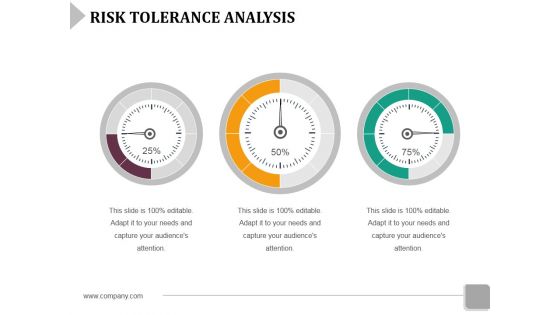
Risk Tolerance Analysis Template 1 Ppt Powerpoint Presentation File Infographic Template
This is a risk tolerance analysis template 1 ppt powerpoint presentation file infographic template. This is a three stage process. The stages in this process are dashboard, marketing, measure, business.
Product Roadmap Product Launch Deliverables Template Ppt PowerPoint Presentation Infographic Template Icon
This is a product roadmap product launch deliverables template ppt powerpoint presentation infographic template icon. This is a five stage process. The stages in this process are product launch deliverables, business, years, timeline, roadmap.
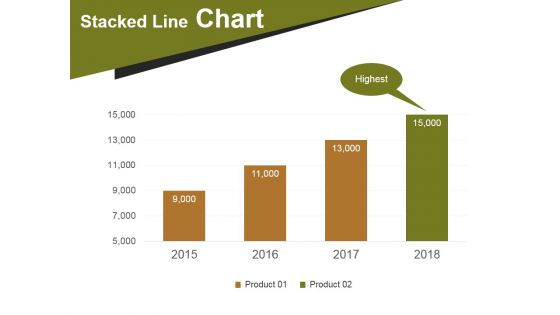
Stacked Line Chart Template 1 Ppt PowerPoint Presentation Infographic Template Layout
This is a stacked line chart template 1 ppt powerpoint presentation infographic template layout. This is a four stage process. The stages in this process are stacked line chart, highest, product.
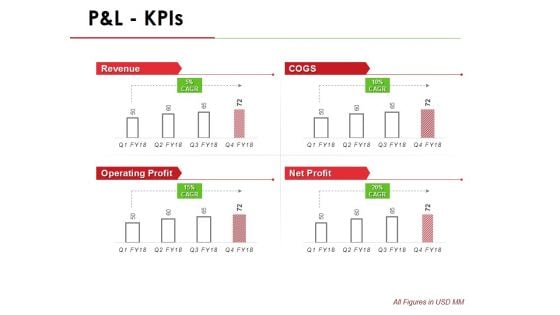
P And L Kpis Template 1 Ppt PowerPoint Presentation Infographic Template Outline
This is a p and l kpis template 1 ppt powerpoint presentation infographic template outline. This is a four stage process. The stages in this process are revenue, operating profit, cogs, net profit.
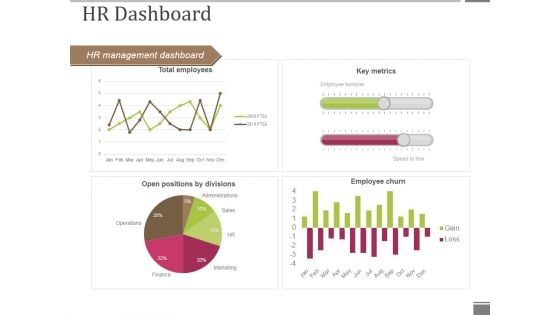
Hr Dashboard Template 1 Ppt PowerPoint Presentation Infographic Template Format Ideas
This is a hr dashboard template 1 ppt powerpoint presentation infographic template format ideas. This is a four stage process. The stages in this process are hr management dashboard, key metrics, employee churn, open positions by divisions, total employees.


 Continue with Email

 Home
Home


