Finance Templates
Our Goal Ppt PowerPoint Presentation Summary Infographic Template
Presenting this set of slides with name our goal ppt powerpoint presentation summary infographic template. This is a two stage process. The stages in this process are our goal. This is a completely editable PowerPoint presentation and is available for immediate download. Download now and impress your audience.
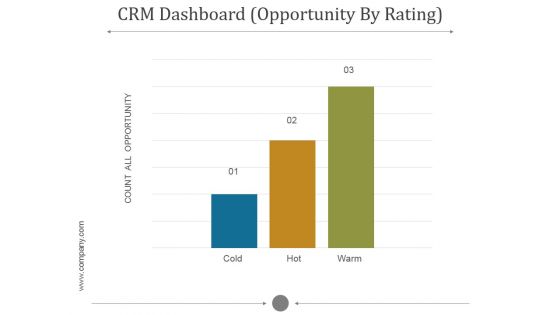
Crm Dashboard Opportunity By Rating Ppt PowerPoint Presentation Template
This is a crm dashboard opportunity by rating ppt powerpoint presentation template. This is a five stage process. The stages in this process are count all opportunity, cold, hot, warm.
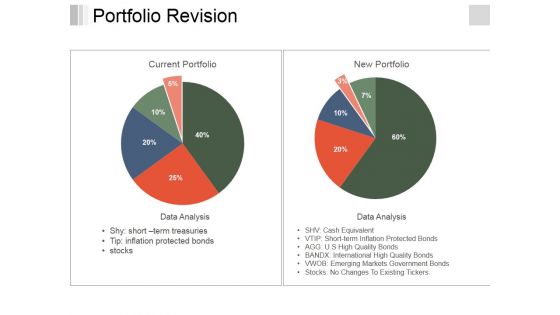
Portfolio Revision Ppt PowerPoint Presentation Visual Aids Infographic Template
This is a portfolio revision ppt powerpoint presentation visual aids infographic template. This is a two stage process. The stages in this process are current portfolio, data analysis, new portfolio, data analysis.
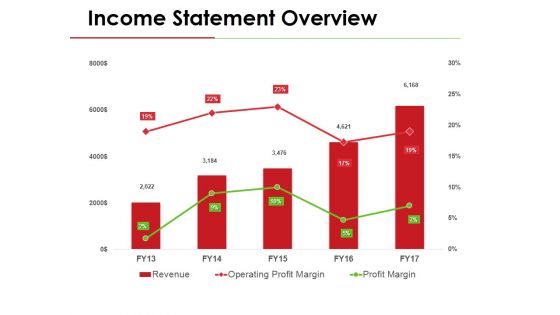
Income Statement Overview Ppt PowerPoint Presentation Gallery Template
This is a income statement overview ppt powerpoint presentation gallery template. This is a three stage process. The stages in this process are revenue, operating profit margin, profit margin.
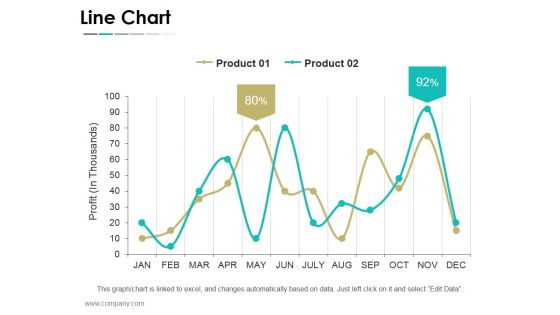
Line Chart Ppt PowerPoint Presentation File Graphics Template
This is a line chart ppt powerpoint presentation file graphics template. This is a twelve stage process. The stages in this process are business, strategy, marketing, success, line chart.
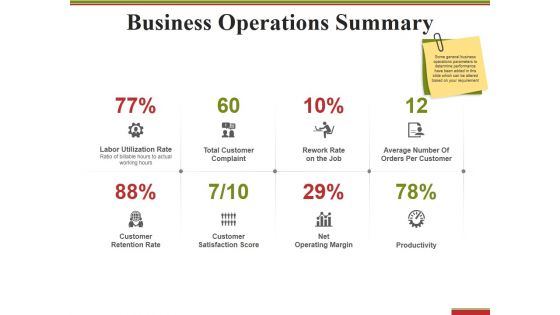
Business Operations Summary Ppt PowerPoint Presentation Model Graphics Template
This is a business operations summary ppt powerpoint presentation model graphics template. This is a eight stage process. The stages in this process are net operating margin, productivity customer, retention rate.
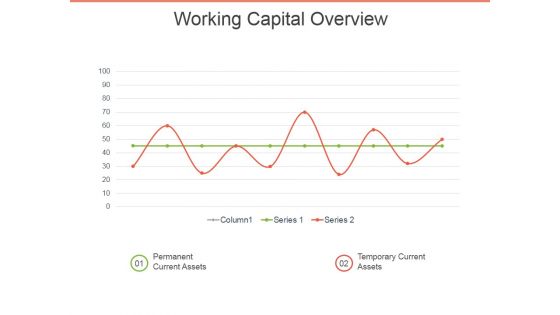
Working Capital Overview Ppt PowerPoint Presentation Model Graphics Template
This is a working capital overview ppt powerpoint presentation model graphics template. This is a two stage process. The stages in this process are permanent current assets, temporary current assets.
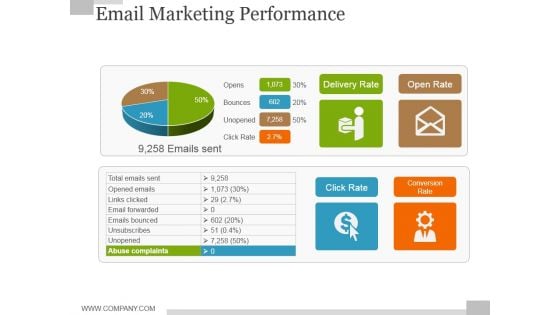
Email Marketing Performance Ppt PowerPoint Presentation Professional Graphics Template
This is a email marketing performance ppt powerpoint presentation professional graphics template. This is a two stage process. The stages in this process are opens, bounces, unopened, delivery rate, open rate.
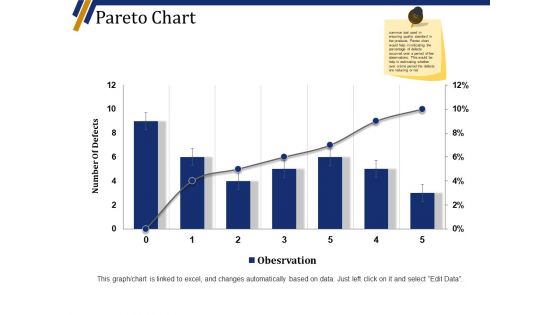
Pareto Chart Ppt PowerPoint Presentation File Infographic Template
This is a pareto chart ppt powerpoint presentation file infographic template. This is a six stage process. The stages in this process are number of defects, business, marketing, graph.

Our Goal Ppt PowerPoint Presentation Portfolio Infographic Template
This is a our goal ppt powerpoint presentation portfolio infographic template. This is a one stage process. The stages in this process are our goal, business, management, strategy, competition.
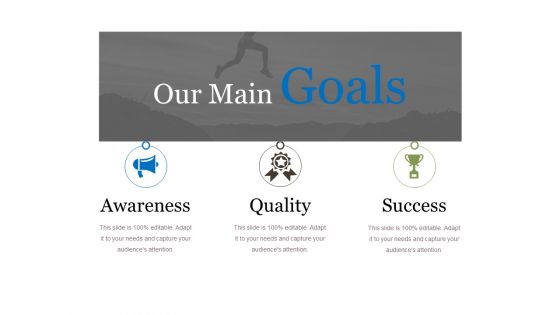
Our Main Goals Ppt PowerPoint Presentation Infographics Infographic Template
This is a our main goals ppt powerpoint presentation infographics infographic template. This is a three stage process. The stages in this process are awareness, quality, success, our main goals, business.

Sales Kpi Performance Summary Ppt PowerPoint Presentation Ideas Graphics Template
This is a sales kpi performance summary ppt powerpoint presentation ideas graphics template. This is a seven stage process. The stages in this process are revenue comparison, quantity comparison, product sales mix, regional sales mix.

Our Main Mission Ppt PowerPoint Presentation Ideas Template
This is a our main mission ppt powerpoint presentation ideas template. This is a one stage process. The stages in this process are our goal, competition, marketing, success, business.
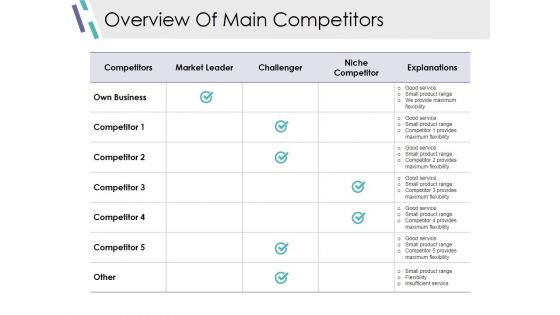
Overview Of Main Competitors Ppt PowerPoint Presentation Show Template
This is a overview of main competitors ppt powerpoint presentation show template. This is a five stage process. The stages in this process are competitors, market leader, challenger, niche competitor, explanations.
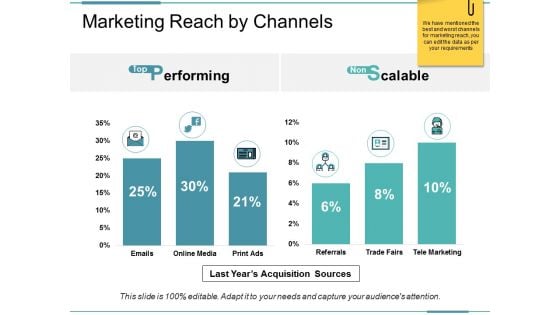
Marketing Reach By Channels Ppt PowerPoint Presentation Pictures Template
This is a marketing reach by channels ppt powerpoint presentation pictures template. This is a two stage process. The stages in this process are performing, scalable, last years acquisition sources.
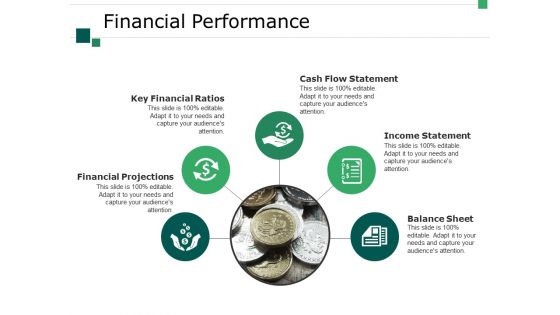
Financial Performance Ppt PowerPoint Presentation Gallery Infographic Template
This is a financial performance ppt powerpoint presentation gallery infographic template. This is a five stage process. The stages in this process are business, financial projections, key financial ratios, cash flow statement, income statement, balance sheet.
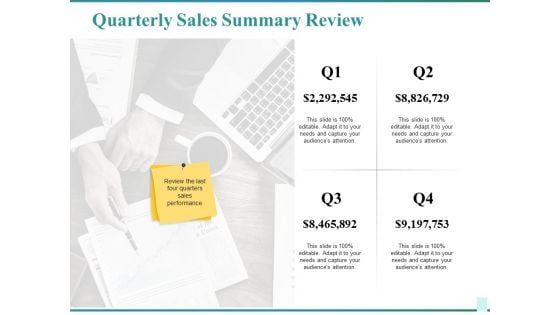
Quarterly Sales Summary Review Ppt PowerPoint Presentation Infographics Graphics Template
This is a quarterly sales summary review ppt powerpoint presentation infographics graphics template. This is a four stage process. The stages in this process are business, marketing, review, management, planning.
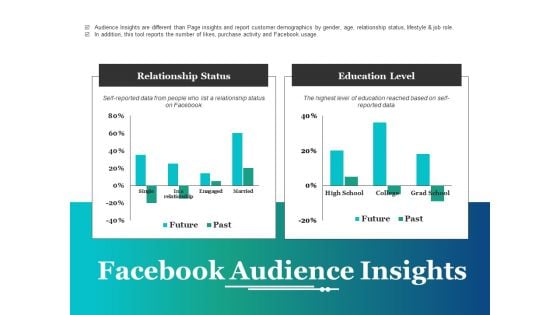
Facebook Audience Insights Ppt PowerPoint Presentation Outline Infographic Template
This is a facebook audience insights ppt powerpoint presentation outline infographic template. This is a two stage process. The stages in this process are facebook, relationship status, education level, future, past.

Content Distribution Matrix Ppt PowerPoint Presentation Professional Graphics Template
This is a content distribution matrix ppt powerpoint presentation professional graphics template. This is a two stage process. The stages in this process are business, management, financial, marketing, sales.
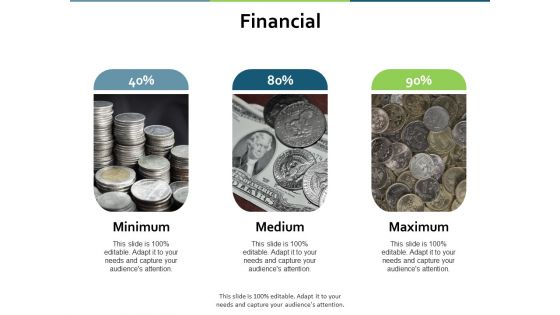
Financial Minimum Medium Ppt PowerPoint Presentation Outline Graphics Template
This is a financial minimum medium ppt powerpoint presentation outline graphics template. This is a three stage process. The stages in this process are financial, maximum, medium, minimum, marketing.
Four Stages Business Infographics Ppt PowerPoint Presentation Outline Infographic Template
This is a four stages business infographics ppt powerpoint presentation outline infographic template. This is a four stage process. The stages in this process are financial capital, working capital management, companys managerial accounting.
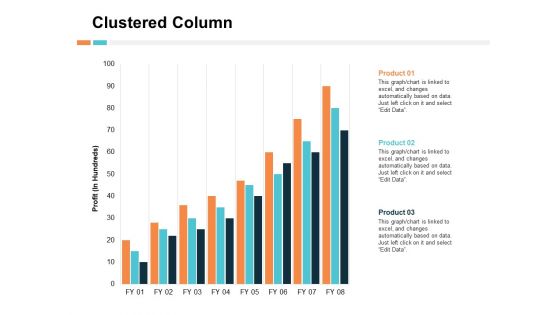
Clustered Column Product Ppt PowerPoint Presentation Outline Infographic Template
This is a clustered column product ppt powerpoint presentation outline infographic template. This is a three stage process. The stages in this process are product, percentage, business, management, marketing.
Business Diagram Graphic Of Podium With Multiple Icons PowerPoint Template
Graphic of podium and multiple icons has been used to craft this power point template. This PPT diagram contains the concept of success and victory. Use this PPT diagram for any related topics in your presentation.
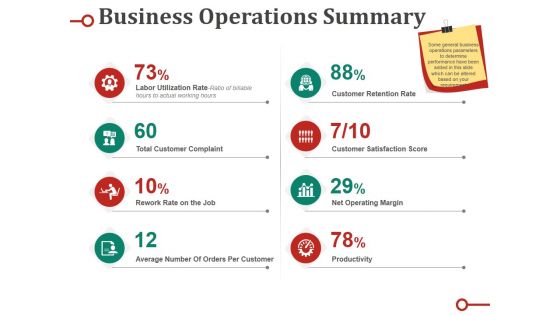
Business Operations Summary Ppt PowerPoint Presentation Infographics Infographic Template
This is a business operations summary ppt powerpoint presentation infographics infographic template. This is a eight stage process. The stages in this process are labor utilization rate, customer retention rate, total customer complaint, customer satisfaction score, rework rate on the job.
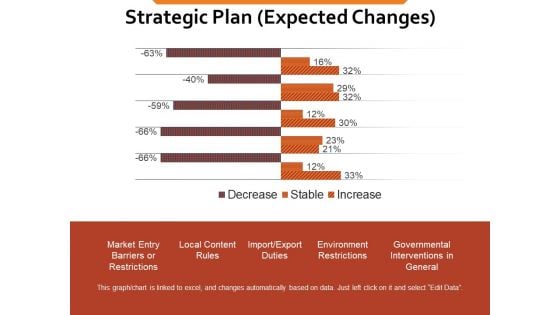
Strategic Plan Expected Changes Ppt PowerPoint Presentation Infographics Template
This is a strategic plan expected changes ppt powerpoint presentation infographics template. This is a two stage process. The stages in this process are market entry barriers or restrictions, local content rules, import export duties, environment restrictions, governmental interventions in general, percentage.
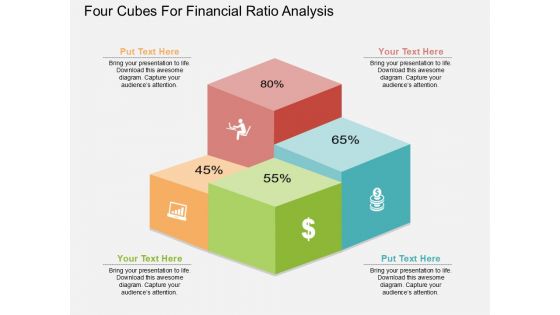
Four Cubes For Financial Ratio Analysis Powerpoint Template
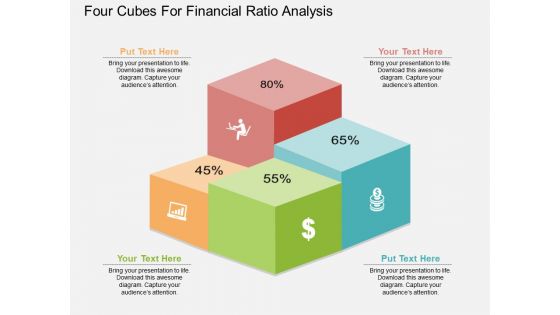
Four Cubes For Fnancial Ratio Analysis Powerpoint Template
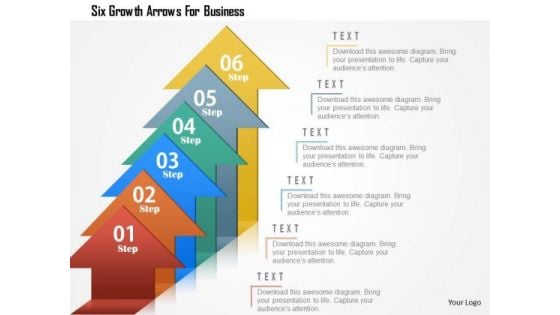
Business Diagram Six Growth Arrows For Business Presentation Template
Six staged arrow diagram has been used to design this power point template. This diagram contains the concept of growth. Amplify your thoughts via this appropriate business template.
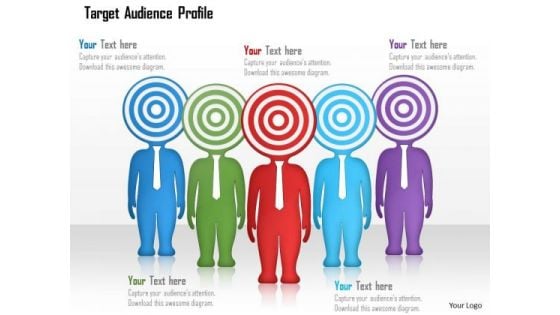
Business Diagram Of Target Audience Profile Presentation Template
Three staged flying thunderbirds jet planes has been used to craft this power point template. This PPT diagram contains the concept of travel and security. Use this PPT for your travel and business related presentations.
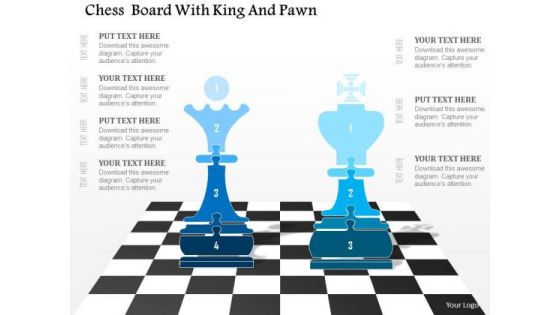
Business Diagram Chess Board With King And Pawn Presentation Template
Graphic of chess boards and king with pawn has been used to design this power point template. This PPT contains the concept of intelligence. Use this PPT for business and game related presentations.
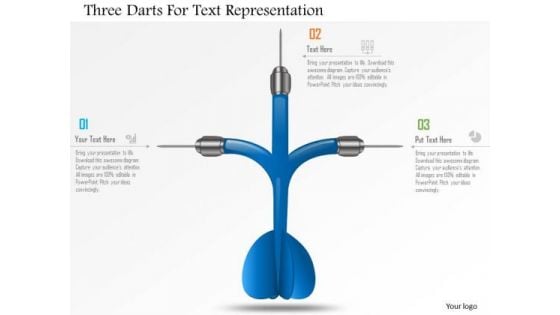
Business Diagram Three Darts For Text Representation Presentation Template
Graphic of three darts has been used to design this power point template. This PPT contains the concept of data representation. Use this PPT and build an exclusive presentation for your viewers.

Business Diagram Five Staged Fish Bowl Diagram Presentation Template
Five staged fish bowl diagram has been used to design this PowerPoint template. This diagram slide depicts the concept of timeline and process flow. Give professional appearance to your presentations using this business slide.
Business Diagram Icons Around Red Target Dart Presentation Template
Graphic of red target dart and arrow has been used to design this PowerPoint Template. This diagram helps to display concept of target selection. This slide can be used for business and sales target related presentations.
Target Business Dart With Business Icons Powerpoint Template
Download this exclusive business diagram to present strategy for target achievement. This PPT diagram slide contains the graphic of target board with arrow and icons. This diagram can be used for business presentations.
Business Diagram Illustration Of Mind Functions With Icons Presentation Template
This image slide displays illustrations of mind functions with icons. This image slide has been designed with graphic of human head with business icon dialogue box. This image slide exhibits planning. Use this PowerPoint template, in your presentations to express views on planning, management etc. in business. This image slide will enhance the quality of your presentations.
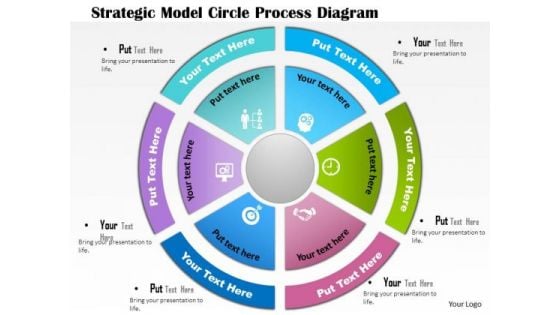
Business Diagram Strategic Model Circle Process Diagram Presentation Template
This image slide displays diagram of circle with various business symbols. This image slide exhibits strategic model in circle. Use this PowerPoint template, in your presentations to express strategies on growth , target, management and planning in any business. This image slide will make your presentations colorful.
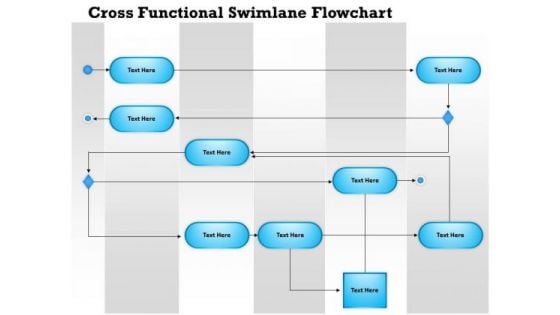
Business Diagram Cross Functional Swimlane Flowchart Presentation Template
This image slide displays cross functional swim lane flow chart. This image slide consists of flow chart on stripped background. Use this PowerPoint template, in your presentations to express various business views. This image slide will help you reach the target audience.
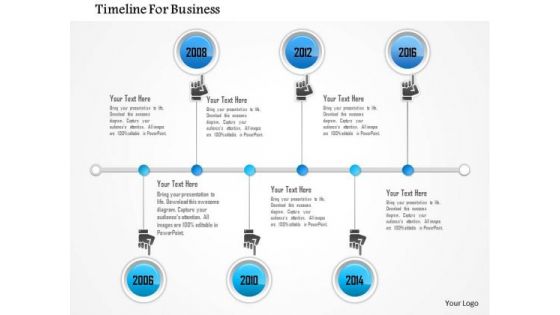
Business Diagram Six Staged Linear Business Timeline Diagram Presentation Template
Six staged linear timeline diagram has been used to design this PowerPoint template. Use this diagram, in your presentations to express views on process, steps, stages, progress, targets, goals, success and achievements. Give professional appearance to your presentations using this business slide.
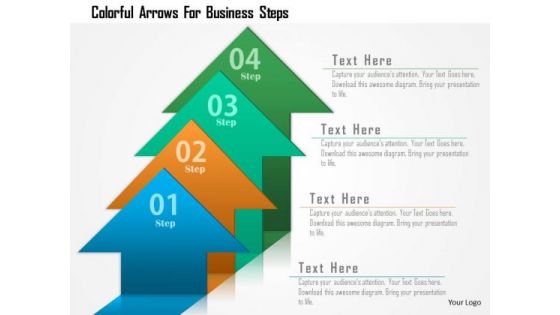
Business Diagram Colorful Arrows For Business Steps Presentation Template
Four colorful arrows have been used to design this power point template. This slide helps to depict growth steps. Illustrate your ideas and imprint them in the minds of your team with this template.
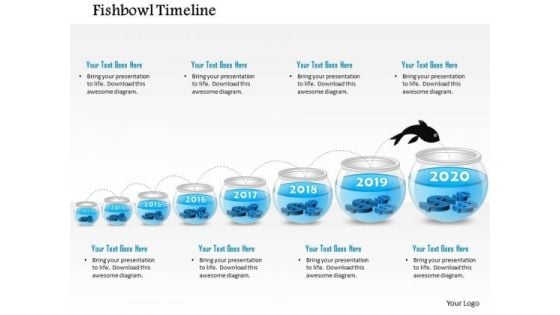
Business Diagram Eight Staged Fish Bowl Diagram Presentation Template
Eight staged fish bowl diagram has been used to design this power point template. This diagram slide helps to depict business timeline and process flow. Use this diagram to build exclusive presentation for your viewers.
Business Diagram Business Man With Puzzles Icon Presentation Template
Graphic of business man with puzzles icons has been used to design this power point template. This diagram slide helps to portray concept like business strategy and analysis. Use this diagram to organize your thoughts and ideas.
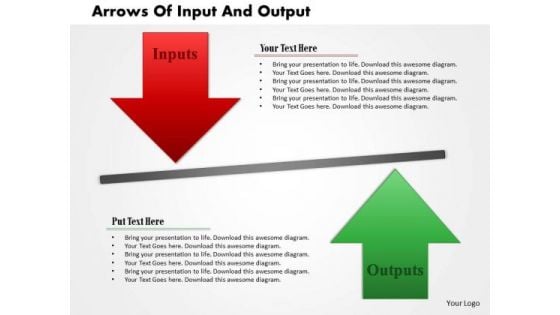
Business Diagram Arrows Of Input And Output Presentation Template
Concept of balance in input and output has been displayed in this power point template. This diagram contains the graphic of red and green arrow on balance line. Use this slide to display your ideas in effective manner.
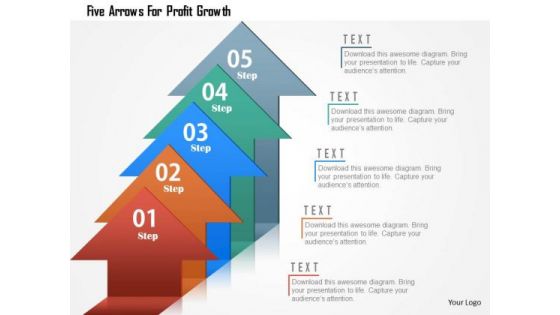
Business Diagram Five Arrows For Profit Growth Presentation Template
Five staged arrow diagram has been used to design this power point template. This business diagram contains the concept of growth. Use this diagram for business and marketing related presentations.
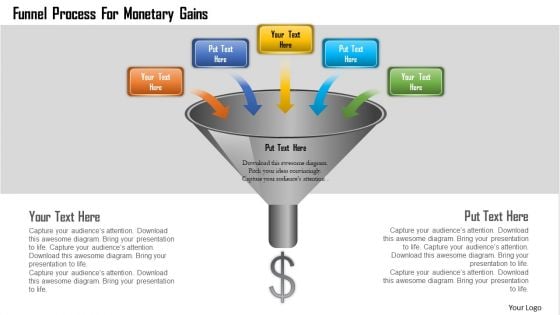
Business Diagram Funnel Process For Monetary Gains Presentation Template
Graphics of funnel diagram has been used to design this power point template. This diagram contains funnel graphics to display concept of monetary gains. Present your views and ideas with this impressive image.
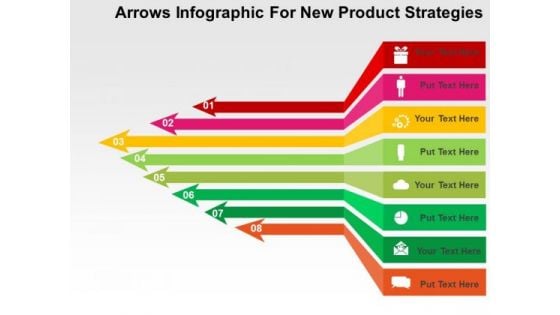
Arrows Infographic For New Product Strategies PowerPoint Template
Our above business slide contains arrows infographic. This slide can be used to present new product strategies. Capture the attention of your audience with this slide.
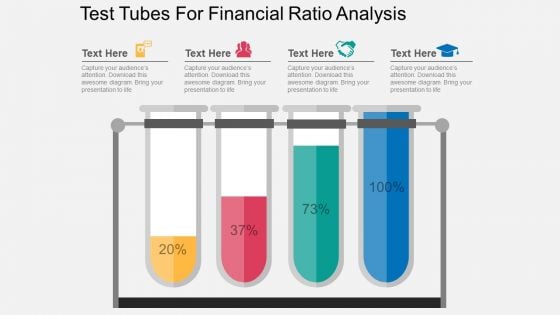
Test Tubes For Financial Ratio Analysis Powerpoint Template
Test tubes infographic diagram has been used to design this business slide. This diagram slide may be used to depict financial ratio analysis. Download this diagram for business research and analysis.
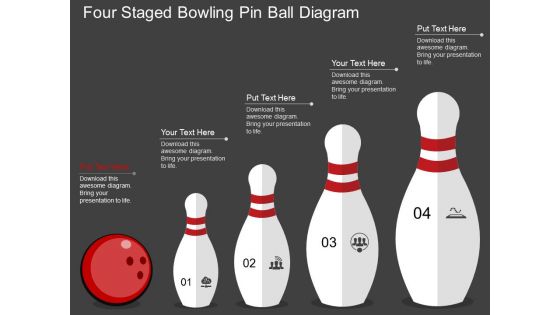
Four Staged Bowling Pin Ball Diagram Powerpoint Template
Our above business slide contains bowling pin diagram. These bowling pins can be used to display innovative business strategy. This diagram provides an effective way of displaying information you can edit text, color, shade and style as per you need.
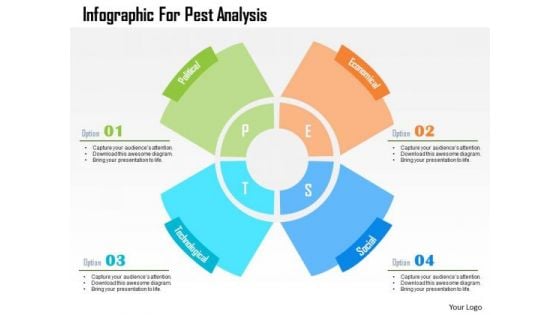
Business Diagram Infographic For Pest Analysis Presentation Template
Our above slide contains infographic for pest analysis. PEST Analysis is a simple and widely used tool that helps you analyze the Political, Economic, Socio-Cultural, and Technological changes in your business environment.
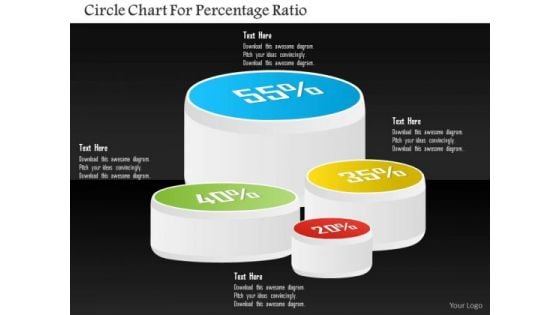
Business Diagram Circle Chart For Percentage Ratio Presentation Template
Four staged circular chart has been used to craft this PPT diagram. This PPT contains the concept of result analysis. Use this PPT in your business and sales presentation and display any kind of result analysis in a graphical way.
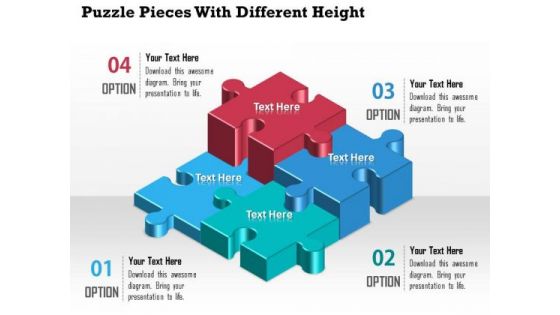
Business Diagram Puzzle Pieces With Different Height Presentation Template
A professional bar graph has been crafted with graphic of puzzles. All these puzzles are in different heights which shows the various levels of any data result representations. Use this diagram for your business result and data analysis related topics.
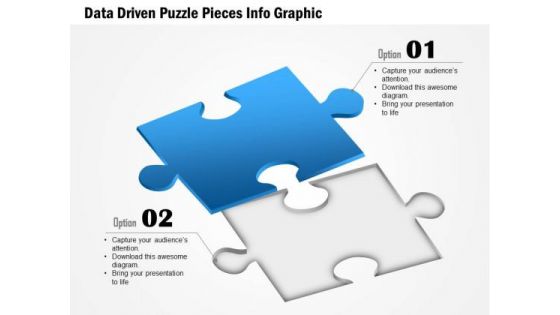
Business Diagram Data Driven Puzzle Pieces Info Graphic Presentation Template
Our above diagram provides data driven puzzle info graphic. This slide contains diagram of puzzle pieces depicting concepts like innovation strategy, research, solution, management and teamwork. Download this diagram to make professional presentations.
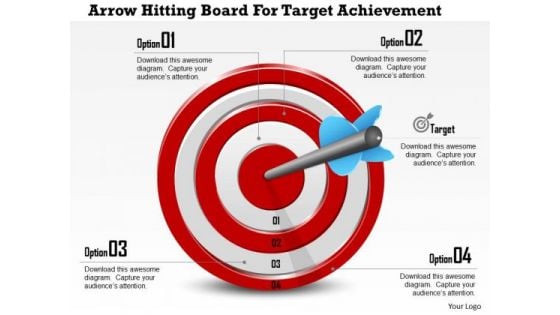
Business Diagram Arrow Hitting Board For Target Achievement Presentation Template
Above business diagram displays red colored target board with arrow hitting on center depicting concept of target achievement. Use this business slide to represent topics like marketing strategy, business target, success etc. Use this diagram to build professional presentation for your viewers.

Business Diagram Silver Capsule For Medication And Treatment Presentation Template
This business diagram displays graphics of capsule with currency symbol. It contains silver capsule with different currency signs inside it. Use this slide for health care and financial topics. Get professional with this exclusive business slide.
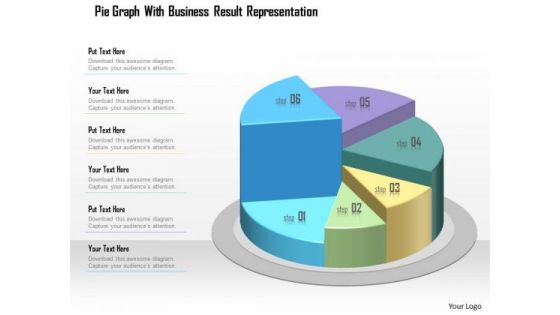
Business Diagram Pie Graph With Business Result Representation Presentation Template
This business diagram displays graphic of pie chart. This business slide contains the concept of business data representation. Use this diagram to build professional presentation for your viewers.
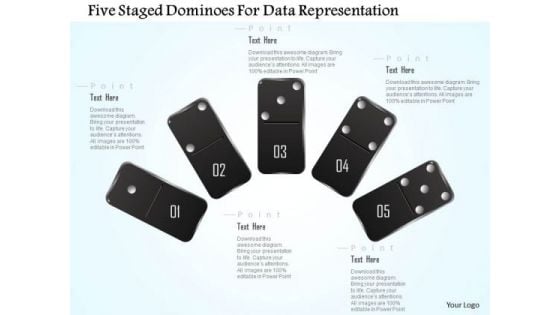
Busines Diagram Five Staged Dominoes For Data Representation Presentation Template
This business diagram displays graphics of five staged dominoes. Use this slide to represent your data in visual manner. This slide offers an excellent background to build professional presentations.
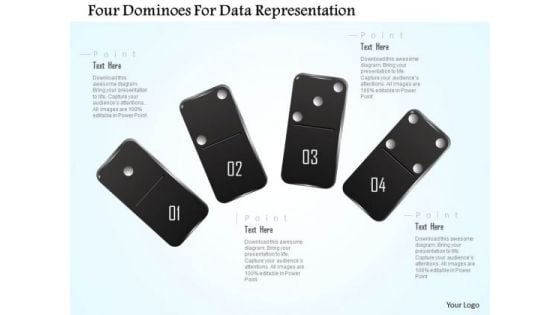
Busines Diagram Four Dominoes For Data Representation Presentation Template
This business diagram displays graphics of four staged dominoes. Use this slide to represent your data in visual manner. This slide offers an excellent background to build professional presentations.
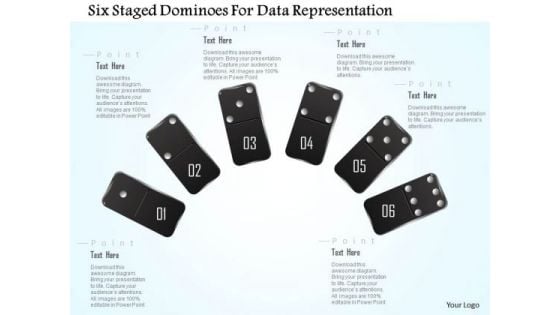
Busines Diagram Six Staged Dominoes For Data Representation Presentation Template
This business diagram displays graphics of six staged dominoes. Use this slide to represent your data in visual manner. This slide offers an excellent background to build professional presentations.
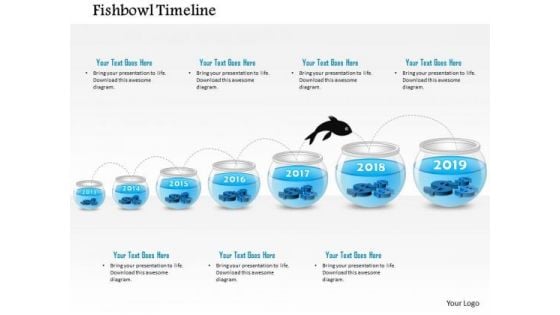
Business Diagram Seven Staged Fish Bowl Diagram Presentation Template
This business slide displays fish bowl diagram with 2013 and 2019 year numbers. This diagram depicts fish moving from year 2017 to year 2018. Use this diagram to build exclusive presentation for your viewers.
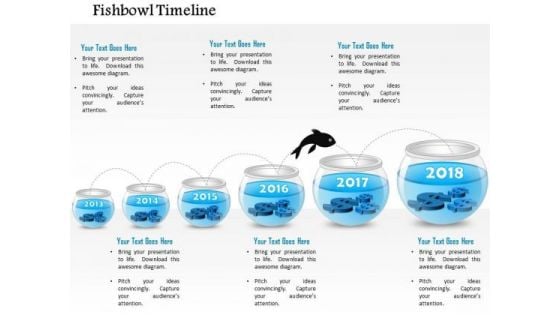
Business Diagram Six Staged Fish Bowl Diagram Presentation Template
This business slide displays fish bowl diagram with 2016 and 2017 year numbers. This diagram depicts fish moving from year 2017 to year 2018. Use this diagram to build exclusive presentation for your viewers.
Business Diagram Swing Design Timeline Diagram Icons Presentation Template
This business slide depicts swing design timeline diagram. This diagram provides an effective way of displaying information you can edit text, color, shade and style as per you need. Present your views using this innovative slide and be assured of leaving a lasting impression.


 Continue with Email

 Home
Home


