Financial Budget
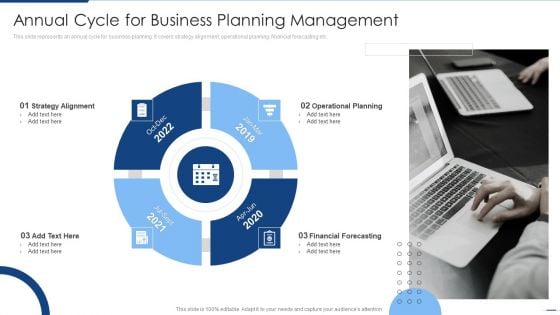
Annual Cycle For Business Planning Management Information PDF
This slide represents an annual cycle for business planning. It covers strategy alignment, operational planning, financial forecasting etc.Persuade your audience using this Annual Cycle For Business Planning Management Information PDF. This PPT design covers four stages, thus making it a great tool to use. It also caters to a variety of topics including Strategy Alignment, Operational Planning, Financial Forecasting. Download this PPT design now to present a convincing pitch that not only emphasizes the topic but also showcases your presentation skills.
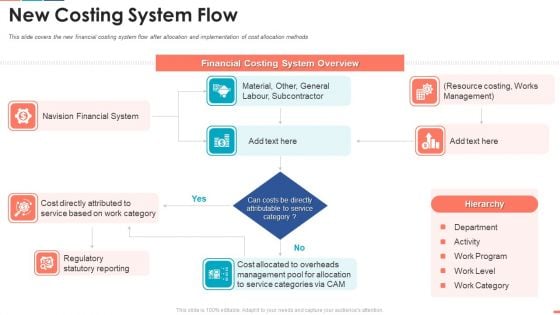
Summarize Techniques For Organization Cost Allocation New Costing System Flow Portrait PDF
This slide covers the new financial costing system flow after allocation and implementation of cost allocation methods Deliver an awe inspiring pitch with this creative summarize techniques for organization cost allocation new costing system flow portrait pdf bundle. Topics like financial system, service, cost, allocation can be discussed with this completely editable template. It is available for immediate download depending on the needs and requirements of the user.
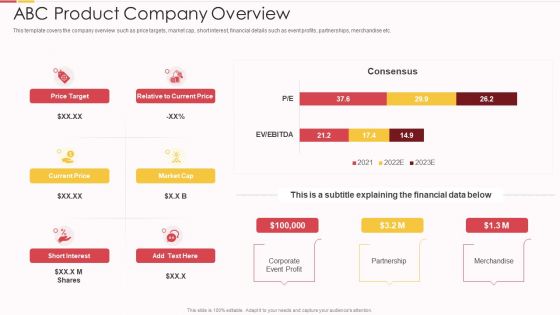
Packed Food Investor Funding Abc Product Company Overview Ppt Infographics Vector PDF
This template covers the company overview such as price targets, market cap, short interest, financial details such as event profits, partnerships, merchandise etc. Deliver an awe inspiring pitch with this creative packed food investor funding abc product company overview ppt infographics vector pdf bundle. Topics like financial, event profit, interest, price can be discussed with this completely editable template. It is available for immediate download depending on the needs and requirements of the user.
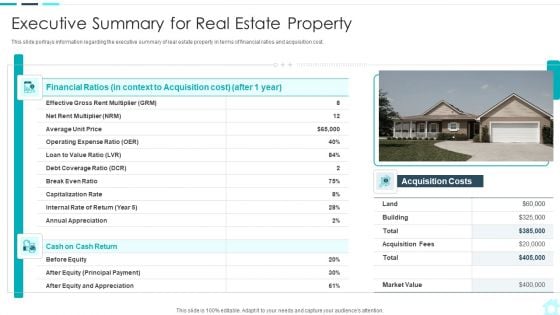
Real Estate Assets Financing Analysis Executive Summary For Real Estate Property Rules PDF
This slide portrays information regarding the executive summary of real estate property in terms of financial ratios and acquisition cost. Deliver an awe inspiring pitch with this creative real estate assets financing analysis executive summary for real estate property rules pdf bundle. Topics like average, price, financial ratios, before equity can be discussed with this completely editable template. It is available for immediate download depending on the needs and requirements of the user.

Success02 Business PowerPoint Templates And PowerPoint Backgrounds 0711
Microsoft PowerPoint Template and Background with laptop of financial growth Alert your team to possibilities with our Success02 Business PowerPoint Templates And PowerPoint Backgrounds 0711. You will come out on top.
What Should I Do Ppt Icon For Ppt Templates And Slides S
Microsoft PowerPoint Template and Background with a man ponders a question wondering Achieve strong & sustainable financial gains with our What Should I Do Ppt Icon For Ppt Templates And Slides S. They will make you look good.

Stock Photo Red Growth Arrow With Percentage Symbol PowerPoint Slide
This image has been designed with red growth arrow with percentage symbol. This Image clearly relates to concept of financial growth. Use our image to drive the point to your audience and constantly attract their attention.
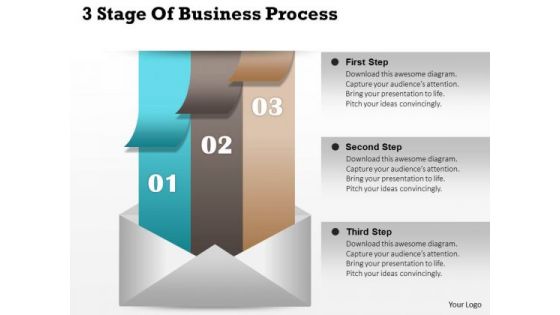
Consulting Slides 3 Stages Of Business Process Business Presentation
This Linear Flow diagram is a powerful tool for financial systems as well as business processed and marketing. Lay down the fundamentals to build upon and lead the way to spread good cheer to one and all.
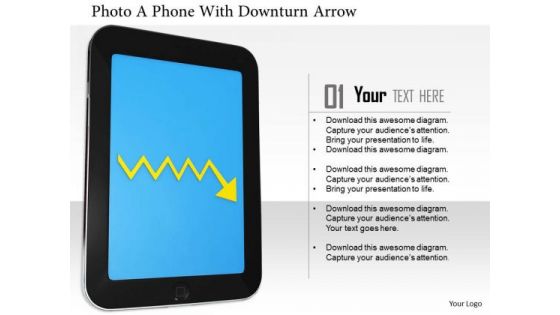
Stock Photo Smart Phone With Downturn Arrow At Display PowerPoint Slide
This image displays yellow downward arrow on tablet. This image has been designed to display progress in your presentations. Use this image, in your presentations to express views on financial degradation and losses. Create eye-catching presentations using this image.
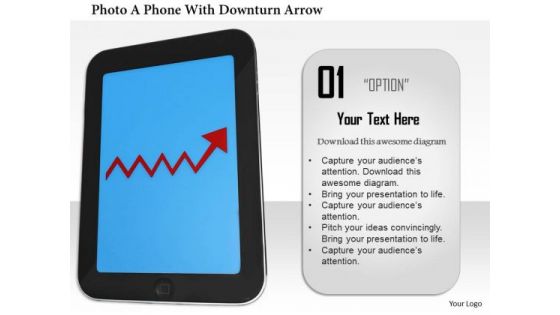
Stock Photo Smartphone With Red Upward Arrow PowerPoint Slide
This image displays red growth arrow on tablet. This image has been designed to display progress in your presentations. Use this image, in your presentations to express views on financial growth, success and marketing. Create eye-catching presentations using this image.
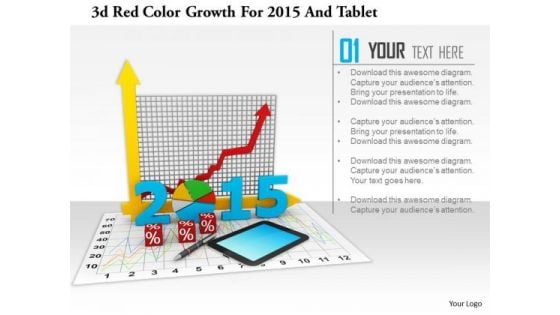
Stock Photo 3d Red Color Growth For 2015 And Tablet PowerPoint Slide
This image slide has graphics of financial charts and reports. This contains bar graph and pie chart to present business reports. Build an innovative presentation using this professional image slide.

Stock Photo Hundred Percentage Inside Lock Safety PowerPoint Slide
Concept of financial safety has been displayed in this image slide with suitable graphics. This slide has been designed with graphic of hundred percentage value and lock. Use this professional slide to make build innovative presentation on safety related topics.
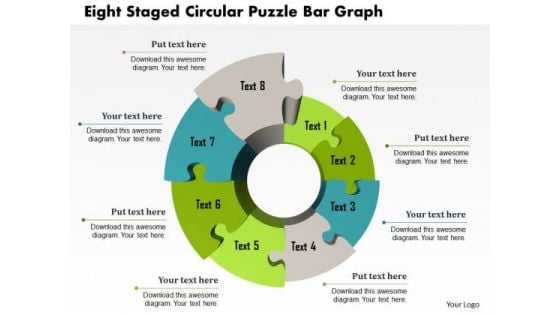
Business Diagram Eight Staged Circular Puzzle Bar Graph Presentation Template
This Power Point template has been crafted with graphic of eight staged circular puzzle and bar graph. This PPT contains the financial result analysis related concept. Use this PPT for your business and success related presentations.
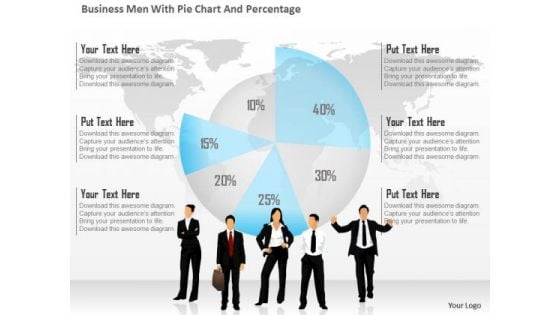
Business Diagram Business Men With Pie Chart And Percentage Presentation Template
This business diagram has been designed with graphic of business people and pie chart with percentage. This diagram is designed to depict team meeting on financial matter. This diagram offers a way for your audience to visually conceptualize the process.
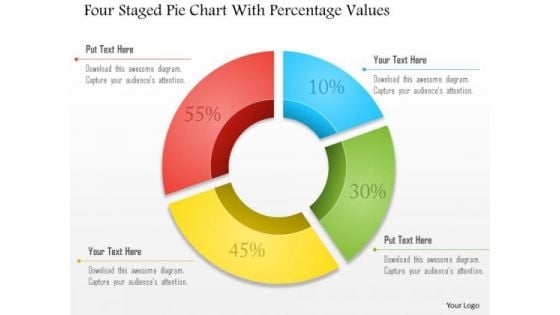
Business Diagram Four Staged Pie Chart With Percentage Values Presentation Template
Four staged pie chart and percentage values are used to design this business slide. Download this diagram to make business and financial reports. Use our above diagram to express information in a visual way.
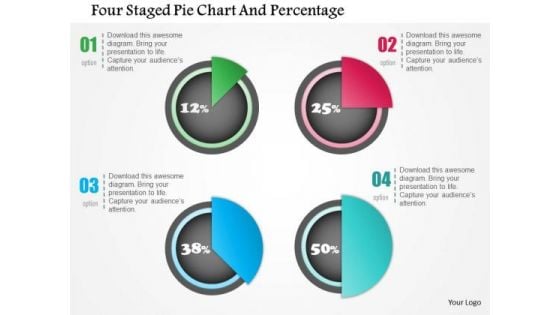
Business Diagram Four Staged Pie Chart And Percentage Presentation Template
Four staged pie chart and percentage values has been used to design this power point template. This PPT contains the concept of financial result analysis. Use this PPT for business and marketing related presentations.
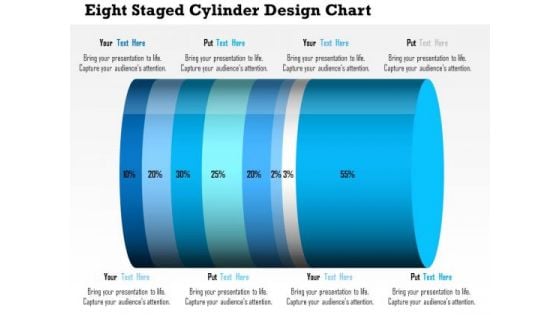
Business Daigram Eight Staged Cylinder Design Chart Presentation Templets
This business diagram contains eight staged cylinder design chart with percentage ratio. Download this diagram to display financial analysis. Use this diagram to make business and marketing related presentations.
Four Icons In Vertical Order PowerPoint Template
Concept of financial planning can be explained with this diagram. It contains graphics of four icons in vertical order. You can use this design to complement your business presentation.
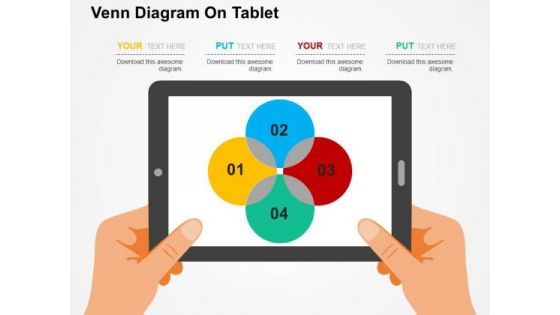
Venn Diagram On Tablet PowerPoint Template
Adjust the above image into your Presentations to visually support your content. This slide has been professionally designed with Venn diagram. This template offers an excellent background to display financial analysis.
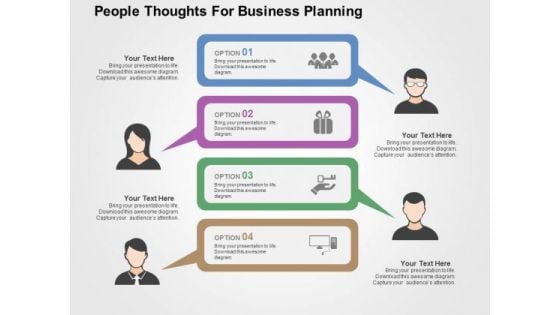
People Thoughts For Business Planning PowerPoint Templates
This creative slide has been designed with graphics of team icons. Use this unique slide in presentations related to business and financial planning. This template adds value to your idea.
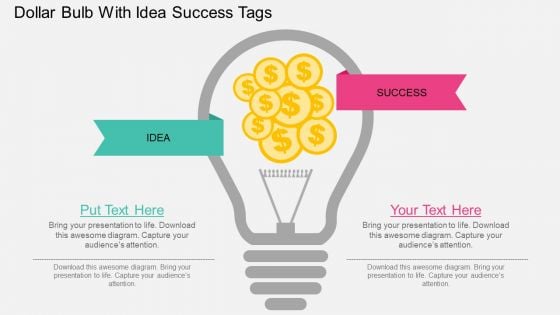
Dollar Bulb With Idea Success Tags Powerpoint Template
Our above slide contains graphics of light bulb with dollars and idea success tags. It helps to display concepts of financial idea planning and success. Develop your strategy and communicate with your team with this professional slide design.
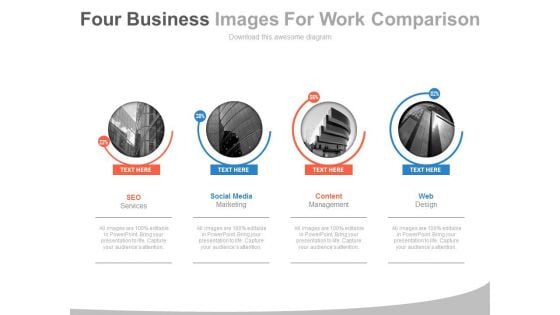
Four Companies With Web Services Powerpoint Slides
This PowerPoint template display graphics of four corporate buildings. You may use this PPT slide for financial and strategic analysis for web services companies. This dashboard slide may useful for multilevel status report creation and approval process.
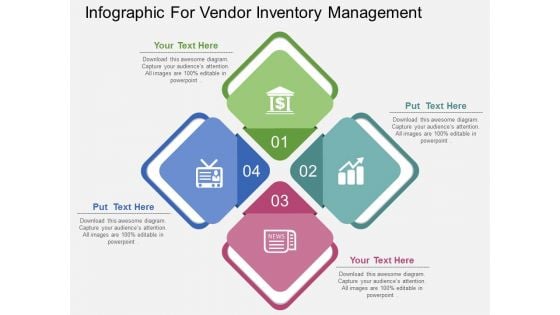
Infographic For Vendor Inventory Management Powerpoint Template
Our above slide display graphics of four connected steps with icons. Download this diagram slide to display financial management process. Adjust the above diagram in your business presentations to visually support your content.
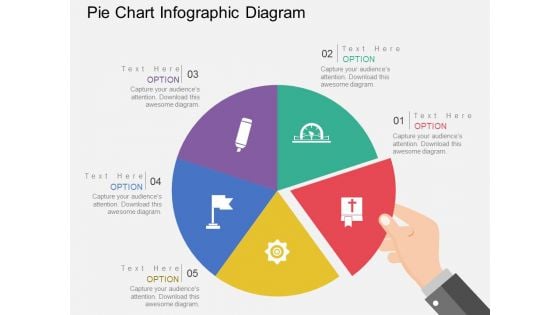
Pie Chart Infographic Diagram Powerpoint Templates
This Power Point template has been designed with pie chart infographic. This business slide is useful to present financial ratio analysis. Use this diagram to make business presentation. Illustrate these thoughts with this slide.
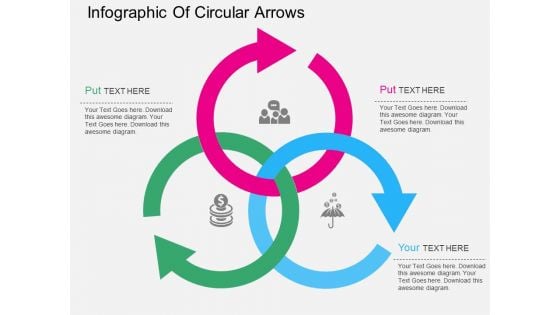
Infographic Of Circular Arrows Powerpoint Templates
This PPT slide has been designed with intersecting circular arrows. This PowerPoint template is suitable to present financial strategy for business. This professional slide helps in making an instant impact on viewers.
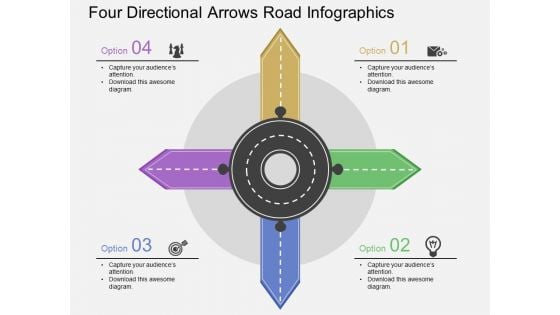
Four Directional Arrows Road Infographics Powerpoint Template
Download this exclusive business diagram to present four steps of financial reporting. This slide contains the four directional arrows road infographic. This PPT diagram slide is useful for business presentations.
Four Twisted Arrows With Creative Icons Powerpoint Template
This PowerPoint template has been designed with four twisted arrows and creative icons. This business diagram helps to exhibit financial accounting systems. Use this diagram to build an exclusive presentation.
Roadmap With Year Based Timeline And Icons Powerpoint Slides
This infographic roadmap template can be used for multiple purposes including financial planning, new milestones and tasks. It contains year based timeline diagram. Download this PowerPoint timeline template to make impressive presentations.
Colorful Cards With Icons For Technology Powerpoint Templates
This slide has been designed with graphics of colorful cards with icons of bulb, dollar, gear and magnifier. You may download this slide for financial analysis. Deliver amazing presentations to mesmerize your audience.

Three Human Faces In Question Mark Shape Powerpoint Templates
Adjust the above image into your Presentations to visually support your content. This slide has been professionally designed to financial targets. This template offers an excellent background to build impressive presentation.

Three Text Tags With Alphabets Powerpoint Templates
The above template displays a diagram of circular arrows with icons. This diagram has been professionally designed to display steps of financial planning. Capture the attention of your audience.
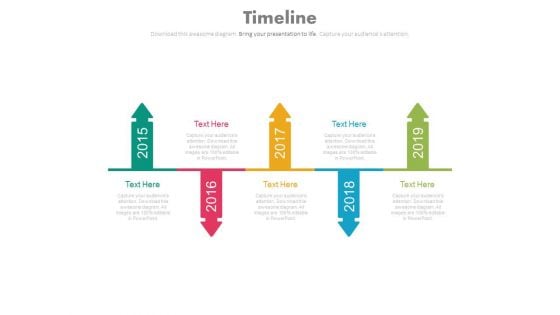
Linear Arrows Year Based Timeline For Business Powerpoint Slides
This linear arrows timeline template can be used for multiple purposes including event planning, new milestones and tasks. This PPT slide may be helpful to display financial strategy timeline. Download this PowerPoint timeline template to make impressive presentations.
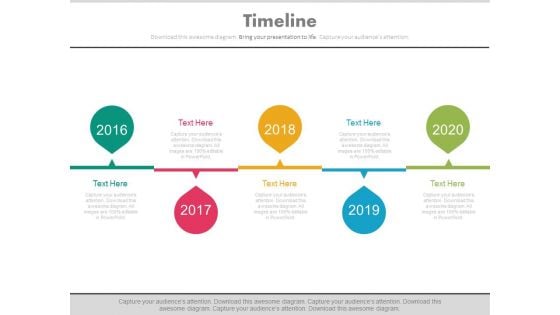
Linear Timeline For Specific Organizational Objectives Powerpoint Slides
This PowerPoint timeline template can be used for specific organizational objectives. This PPT slide may be helpful to display financial strategy timeline. Download this PowerPoint timeline template to make impressive presentations.
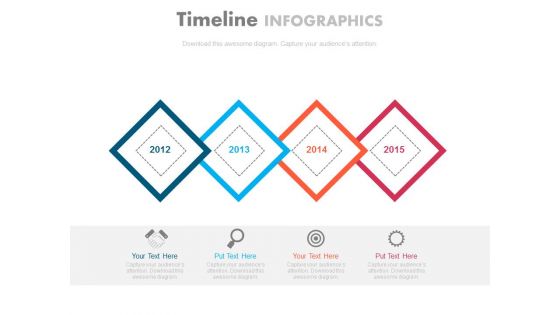
Timeline Steps For Organizational Strategy Powerpoint Slides
This infographic timeline template can be used for multiple purposes including financial planning, new milestones and tasks. It contains organizational strategy timeline diagram. Download this PowerPoint timeline template to make impressive presentations.
Five Pointers With Science And Education Icons Powerpoint Template
Our professionally designed business diagram is as an effective tool for communicating concept of science and education. It contains five pointers infographic diagram. Above slide is also suitable to display financial planning and strategy.
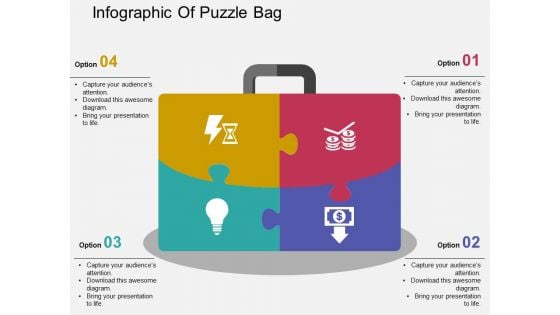
Infographic Of Puzzle Bag Powerpoint Templates
Adjust the above image into your presentations to visually support your content. This slide has been professionally designed with puzzle bag infographic. This template offers an excellent background to build financial target related presentation.
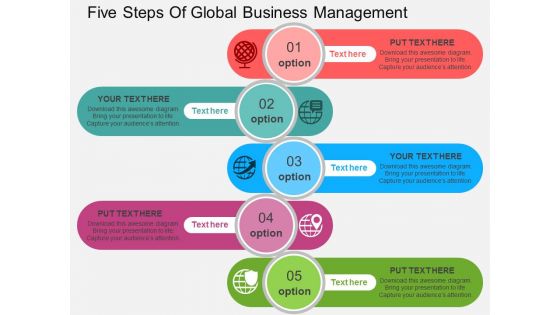
Five Steps Of Global Business Management Powerpoint Templates
Our above business diagram has been designed with graphics of six tags with icons. This slide is suitable to present financial planning. Use this business diagram to present your work in a more smart and precise manner.
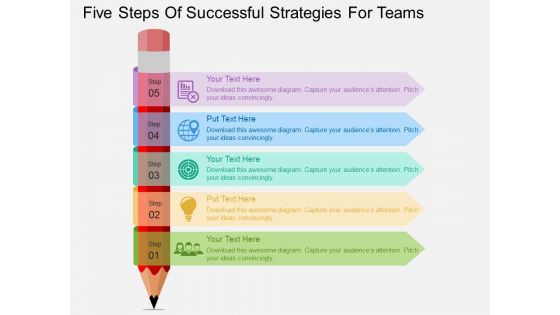
Five Steps Of Successful Strategies For Teams Powerpoint Templates
Our above business diagram has been designed with graphics of six tags with icons. This slide is suitable to present financial management. Use this business diagram to present your work in a more smart and precise manner.
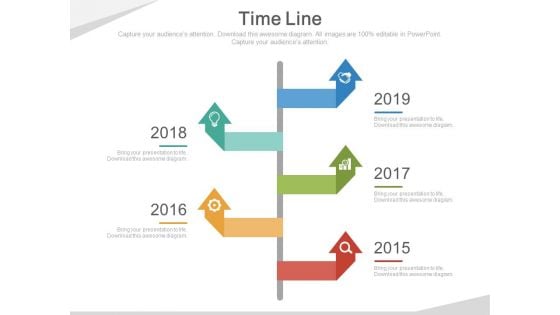
Five Arrows Signboard Style Timeline Diagram Powerpoint Slides
This five arrows signboard style timeline template can be used for multiple purposes including event planning, new milestones and tasks. This PPT slide may be helpful to display financial strategy timeline. Download this PowerPoint timeline template to make impressive presentations.
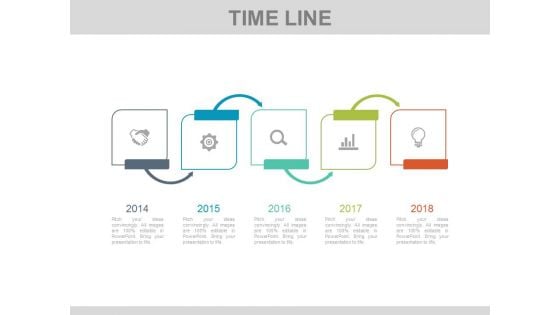
Five Steps Linear Timeline Infographic Diagram Powerpoint Slides
This infographic timeline template can be used for multiple purposes including financial planning, new milestones and tasks. It contains linear timeline infographic diagram. Download this PowerPoint timeline template to make impressive presentations.
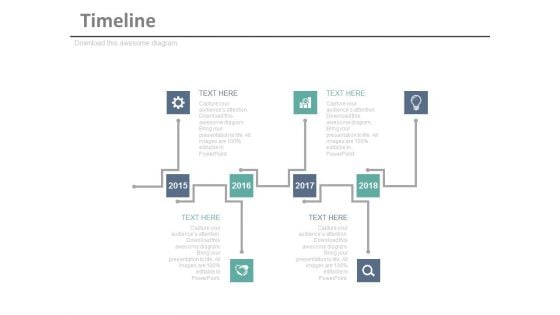
Timeline Infographic Diagram For Business Achievements Powerpoint Slides
This timeline infographic template can be used for multiple purposes including event planning, new milestones and tasks. This PPT slide may be helpful to display financial strategy timeline. Download this PowerPoint timeline template to make impressive presentations.
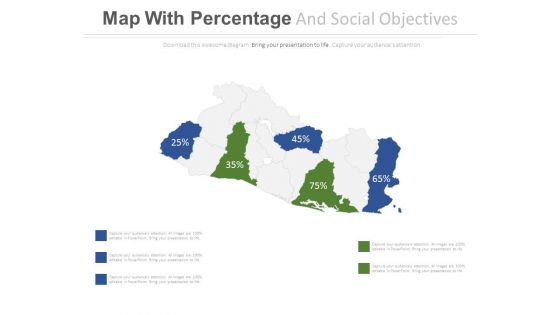
Map With Highlighted Areas And Percentage Values Powerpoint Slides
This PowerPoint template displays map diagram with highlighted areas and percentage values. You may use this PPT slide to exhibit area wise financial growth. Download this PowerPoint map diagram to build impressive presentations.
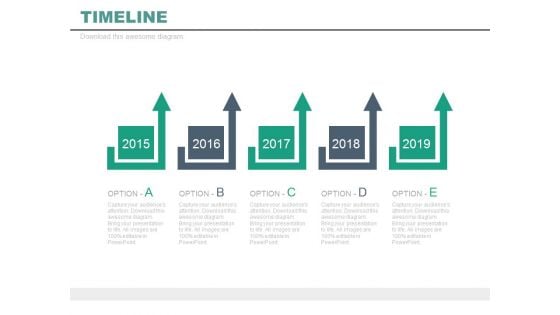
Five Options Timeline For Marketing Plan Powerpoint Slides
This five years timeline template can be used to display marketing plan. This PPT slide may be helpful to display financial strategy and timeline. Download this PowerPoint timeline template to make impressive presentations.

Five Sequential Year Tags Timeline Diagram Powerpoint Slides
This PowerPoint timeline template can be used for specific organizational objectives. This PPT slide may be helpful to display financial strategy and timeline. Download this PowerPoint timeline template to make impressive presentations.
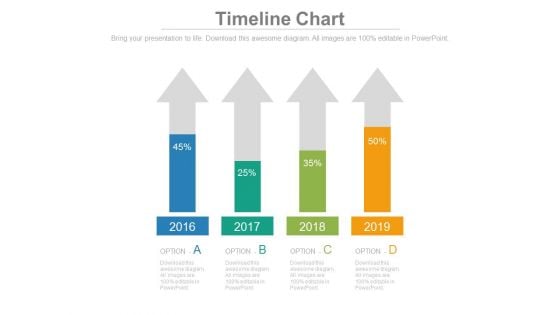
Four Arrows With Percentage Data Analysis Powerpoint Slides
This timeline template can be used for multiple purposes including financial planning, new milestones and tasks. It contains four upward arrows with percentage values. Download this PowerPoint timeline template to make impressive presentations.
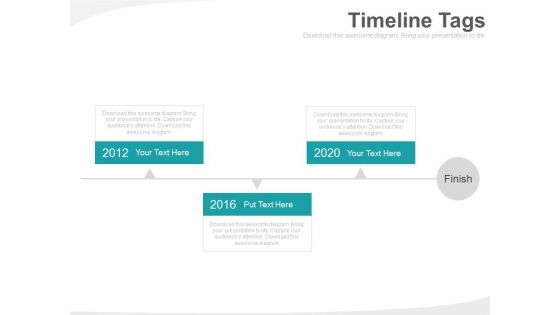
Three Timeline Tags For Business Planning Powerpoint Slides
This three years timeline template can be used to display marketing plan. This PPT slide may be helpful to display financial strategy and timeline. Download this PowerPoint timeline template to make impressive presentations.
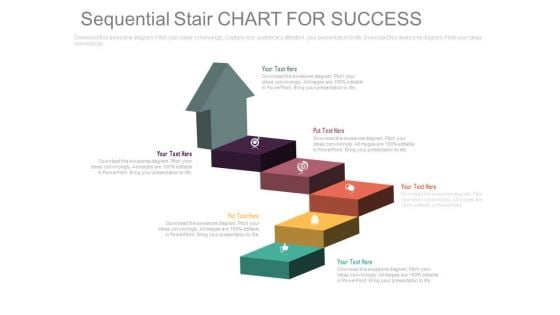
Arrow Steps Chart For Business Success Powerpoint Template
This PowerPoint template has been designed with graphics of arrow steps chart. Download this slide for planning of financial targets. Grab the attention of your listeners with this PPT slide.
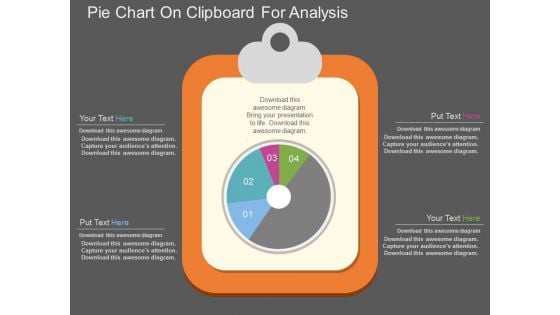
Pie Chart On Clipboard For Analysis Powerpoint Template
This PowerPoint template has been designed with graphics of pie chart on clipboard. Download this PPT slide for business and financial analysis. You may also use this professional template to depict statistical analysis.
Seven Staged Business Cubes And Icons Powerpoint Template
This PowerPoint template has been designed with graphics of seven cubes and business icons. Download this PPT slide for business and financial analysis. You may also use this professional template to depict statistical analysis.
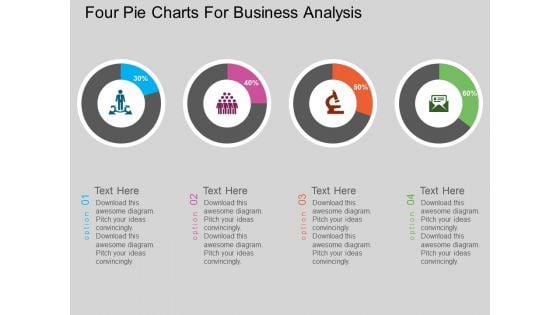
Four Pie Charts For Business Analysis Powerpoint Template
This PowerPoint template has been designed with graphics of four pie charts This diagram can be used to display financial planning and business analysis. Capture the attention of your audience with this slide.
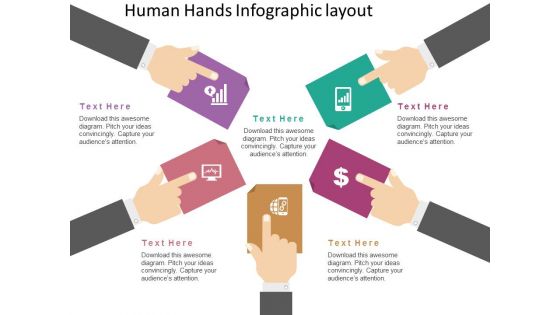
Human Hands Infographic Layout Powerpoint Template
Our professionally designed business diagram is as an effective tool for communicating concepts of financial planning. This slide illustrates human hands infographic. Convey your views with this diagram slide.
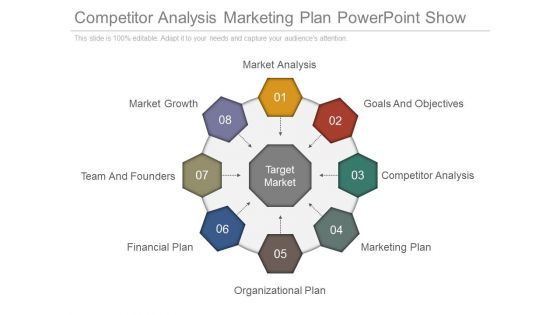
Competitor Analysis Marketing Plan Powerpoint Show
This is a competitor analysis marketing plan powerpoint show. This is a eight stage process. The stages in this process are market analysis, market growth, goals and objectives, team and founders, financial plan, marketing plan.\n\n
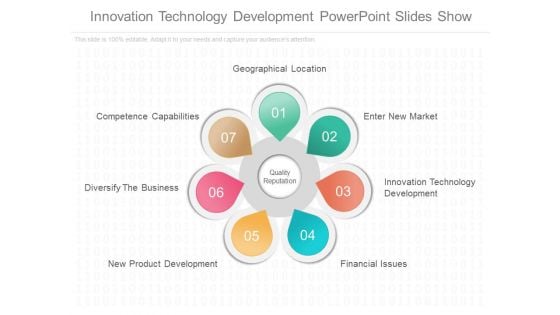
Innovation Technology Development Powerpoint Slides Show
This is an innovation technology development powerpoint slides show. This is a seven stage process. The stages in this process are geographical location, enter new market, competence capabilities, diversify the business, new product development, financial issues.
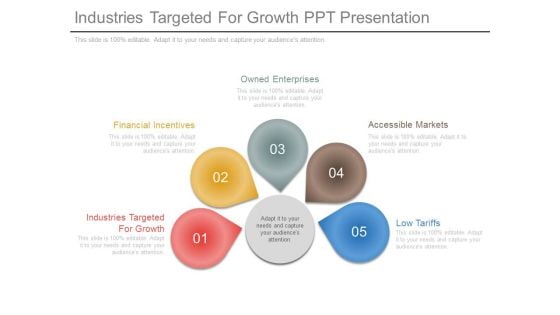
Industries Targeted For Growth Ppt Presentation
This is an industries targeted for growth ppt presentation. This is a five stage process. The stages in this process are owned enterprises, accessible markets, financial incentives, industries targeted for growth, low tariffs, accessible markets.\n\n

Business Necessity Capabilities Powerpoint Slides Rules
This is a business necessity capabilities powerpoint slides rules. This is a six stage process. The stages in this process are greater financial impact, strategic support capabilities, advantage capabilities, greater strategic, essential capabilities, business necessity capabilities.
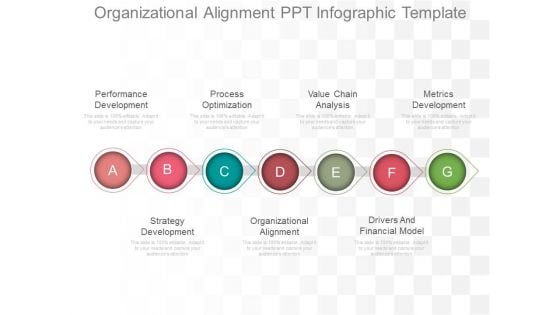
Organizational Alignment Ppt Infographic Template
This is a organizational alignment ppt infographic template. This is a seven stage process. The stages in this process are performance development, process optimization, value chain analysis, metrics development, strategy development, organizational alignment, drivers and financial model.
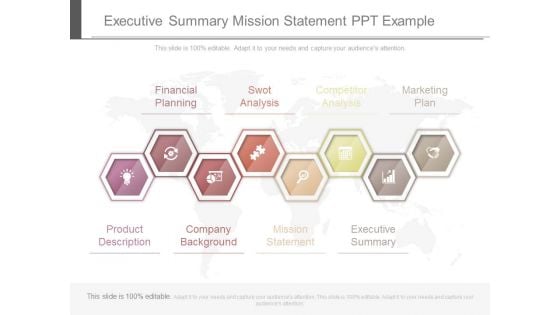
Executive Summary Mission Statement Ppt Example
This is a executive summary mission statement ppt example. This is a eight stage process. The stages in this process are financial planning, swot analysis, competitor analysis, marketing plan, product description, company background, mission statement, executive summary.
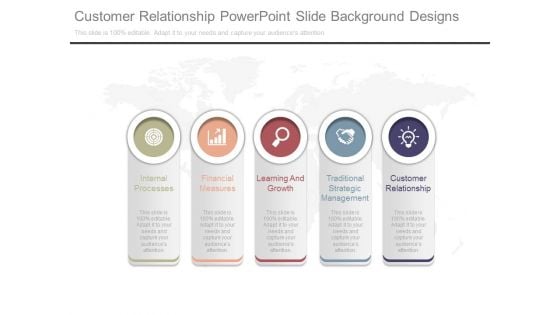
Customer Relationship Powerpoint Slide Background Designs
This is a customer relationship powerpoint slide background designs. This is a five stage process. The stages in this process are internal processes, financial measures, learning and growth, traditional strategic management, customer relationship.
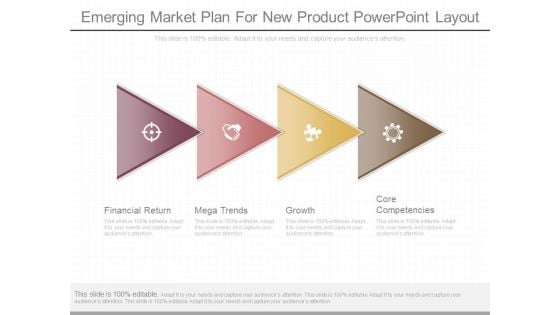
Emerging Market Plan For New Product Powerpoint Layout
This is a emerging market plan for new product powerpoint layout. This is a four stage process. The stages in this process are financial return, mega trends, growth, core competencies.
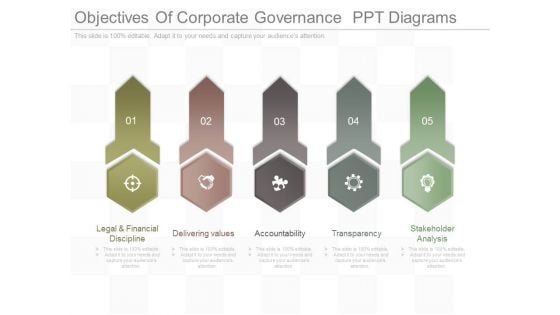
Objectives Of Corporate Governance Ppt Diagrams
This is a objectives of corporate governance ppt diagrams. This is a five stage process. The stages in this process are legal and financial discipline, delivering values, accountability, transparency, stakeholder analysis.


 Continue with Email

 Home
Home


