Financial Budget

Channel Product Pricing Ppt PowerPoint Presentation Professional File Formats
This is a channel product pricing ppt powerpoint presentation professional file formats. This is a three stage process. The stages in this process are product, pricing rationale, pricing.
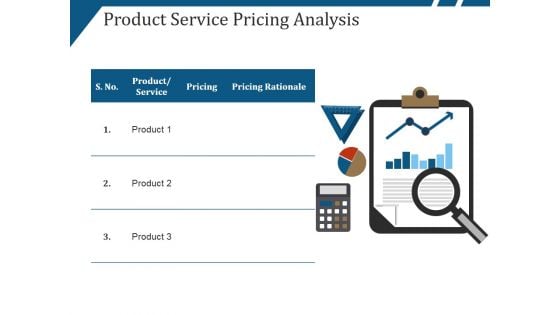
Product Service Pricing Analysis Ppt PowerPoint Presentation Ideas Design Templates
This is a product service pricing analysis ppt powerpoint presentation ideas design templates. This is a three stage process. The stages in this process are pricing rationale, pricing, product.

Scatter Bubble Chart Ppt PowerPoint Presentation Infographics Backgrounds
This is a scatter bubble chart ppt powerpoint presentation infographics backgrounds. This is a five stage process. The stages in this process are highest sale, in price, growth, success, business.
Stacked Line Chart With Markers Ppt PowerPoint Presentation Gallery Icon
This is a stacked line chart with markers ppt powerpoint presentation gallery icon. This is a three stage process. The stages in this process are stacked line chart, marketing, strategy, business, analysis.
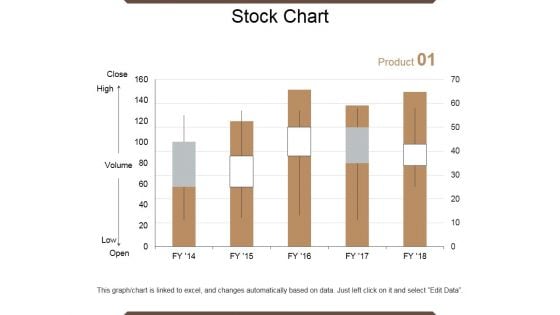
Stock Chart Ppt PowerPoint Presentation Outline Graphics Example
This is a stock chart ppt powerpoint presentation outline graphics example. This is a five stage process. The stages in this process are close, volume, low, high, open, product.
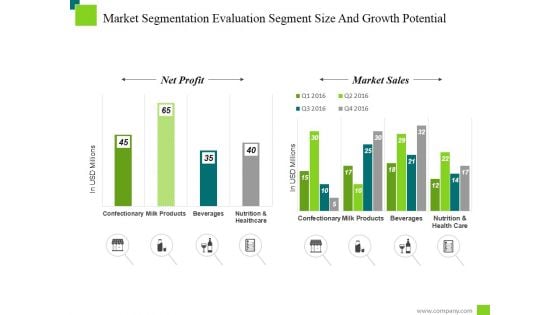
Market Segmentation Evaluation Segment Size And Growth Potential Ppt PowerPoint Presentation Model
This is a market segmentation evaluation segment size and growth potential ppt powerpoint presentation model. This is a two stage process. The stages in this process are net profit, market sales, milk products, confectionary.
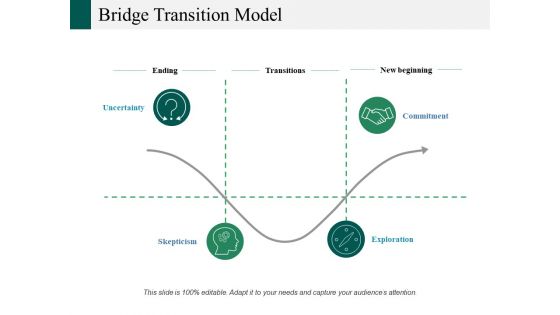
Bridge Transition Model Ppt PowerPoint Presentation Infographics Example
This is a bridge transition model ppt powerpoint presentation infographics example. This is a four stage process. The stages in this process are ending, transitions, uncertainty, commitment, exploration.

Key Performance Indicator Analytics Dashboard Ppt PowerPoint Presentation Model Example Topics
This is a key performance indicator analytics dashboard ppt powerpoint presentation model example topics. This is a five stage process. The stages in this process are kpi proposal, kpi plan, kpi scheme.
KPI Metrics Vector Icon Ppt PowerPoint Presentation Layouts Slide
This is a kpi metrics vector icon ppt powerpoint presentation layouts slide. This is a three stage process. The stages in this process are kpi proposal, kpi plan, kpi scheme.
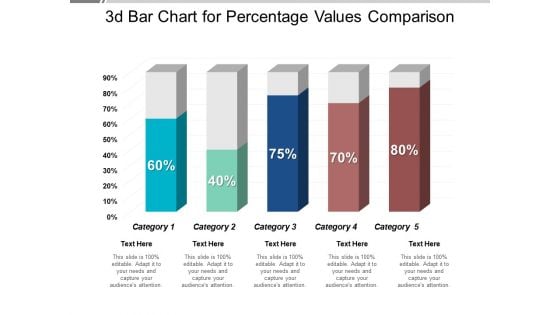
3D Bar Chart For Percentage Values Comparison Ppt PowerPoint Presentation Professional Visual Aids
This is a 3d bar chart for percentage values comparison ppt powerpoint presentation professional visual aids. This is a five stage process. The stages in this process are art, colouring, paint brush.
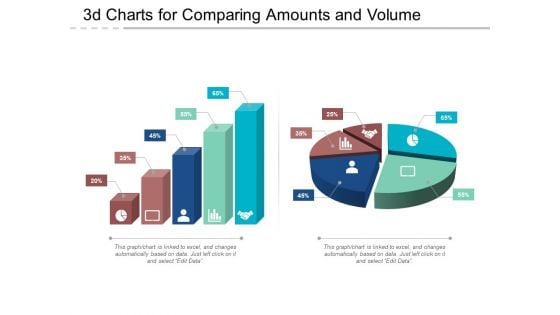
3D Charts For Comparing Amounts And Volume Ppt PowerPoint Presentation Show Deck
This is a 3d charts for comparing amounts and volume ppt powerpoint presentation show deck. This is a five stage process. The stages in this process are art, colouring, paint brush.

Column Chart Employee Value Proposition Ppt PowerPoint Presentation Slides Graphics Design
This is a column chart employee value proposition ppt powerpoint presentation slides graphics design. This is a two stage process. The stages in this process are business, management, strategy, analysis, marketing.
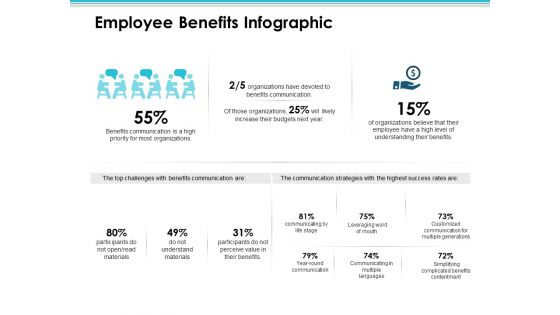
Employee Benefits Infographic Employee Value Proposition Ppt PowerPoint Presentation Styles Diagrams
This is a employee benefits infographic employee value proposition ppt powerpoint presentation styles diagrams. This is a three stage process. The stages in this process are business, management, strategy, analysis, marketing.
Data Analysis Vector Icons Ppt Powerpoint Presentation Layouts Gridlines
This is a data analysis vector icons ppt powerpoint presentation layouts gridlines. This is a two stage process. The stages in this process are data presentation, content presentation, information presentation.
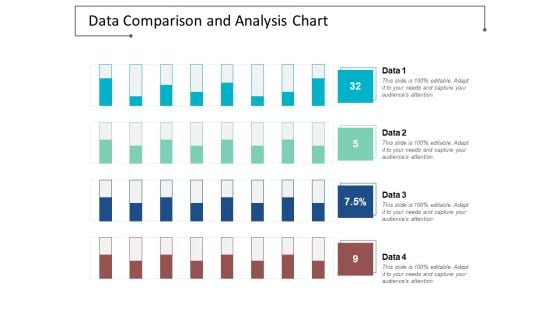
Data Comparison And Analysis Chart Ppt Powerpoint Presentation File Background Images
This is a data comparison and analysis chart ppt powerpoint presentation file background images. This is a four stage process. The stages in this process are data presentation, content presentation, information presentation.
Data Interpretation Percentage Analysis Ppt Powerpoint Presentation Summary Icon
This is a data interpretation percentage analysis ppt powerpoint presentation summary icon. This is a six stage process. The stages in this process are data presentation, content presentation, information presentation.
Five Business Options Representation With Icons Ppt Powerpoint Presentation Portfolio Aids
This is a five business options representation with icons ppt powerpoint presentation portfolio aids. This is a five stage process. The stages in this process are data presentation, content presentation, information presentation.
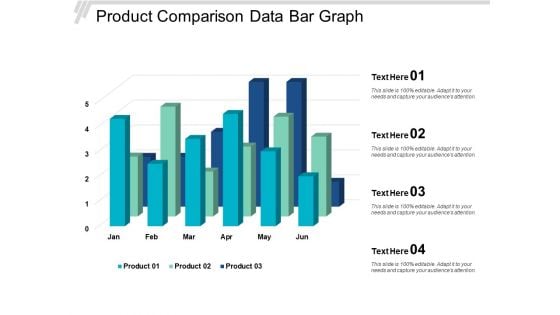
Product Comparison Data Bar Graph Ppt Powerpoint Presentation Slides Show
This is a product comparison data bar graph ppt powerpoint presentation slides show. This is a four stage process. The stages in this process are data presentation, content presentation, information presentation.
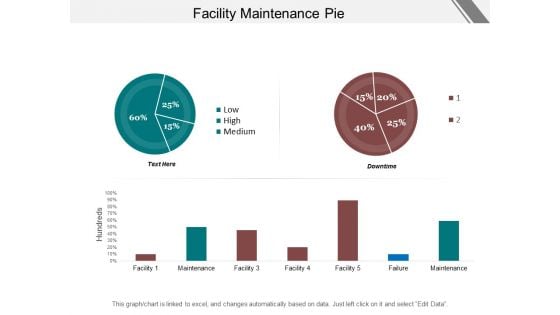
Facility Maintenance Ppt Powerpoint Presentation Infographics Design Inspiration
This is a facility maintenance ppt powerpoint presentation infographics design inspiration. This is a two stage process. The stages in this process are fm, facilities management, support management.
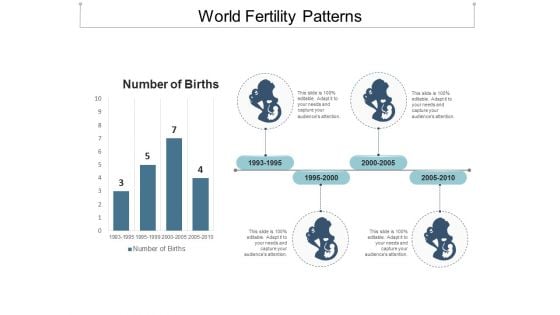
World Fertility Patterns Ppt Powerpoint Presentation Gallery Smartart
This is a world fertility patterns ppt powerpoint presentation gallery smartart. This is a four stage process. The stages in this process are fertility, productiveness, fecundity.

Learning And Experience Graph With Three Milestones Ppt PowerPoint Presentation Model Introduction
This is a learning and experience graph with three milestones ppt powerpoint presentation model introduction. This is a three stage process. The stages in this process are experience curve, learning curve.
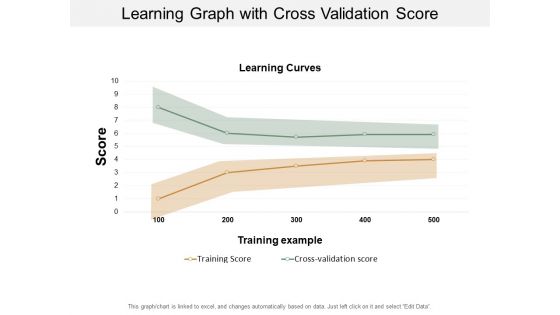
Learning Graph With Cross Validation Score Ppt PowerPoint Presentation Visual Aids Inspiration
This is a learning graph with cross validation score ppt powerpoint presentation visual aids inspiration. This is a two stage process. The stages in this process are experience curve, learning curve.

Learning Progress Graph Slow Steep And Plateau Ppt PowerPoint Presentation Professional Gallery
This is a learning progress graph slow steep and plateau ppt powerpoint presentation professional gallery. This is a three stage process. The stages in this process are experience curve, learning curve.
Data Research And Analysis For Mobile Users Ppt PowerPoint Presentation Icon Inspiration
This is a data research and analysis for mobile users ppt powerpoint presentation icon inspiration. This is a four stage process. The stages in this process are mobile analytics, mobile tracking, mobile web analytics.
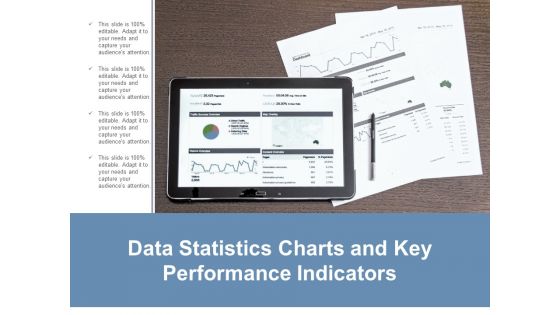
Data Statistics Charts And Key Performance Indicators Ppt Powerpoint Presentation Layouts Guide
This is a data statistics charts and key performance indicators ppt powerpoint presentation layouts guide. This is a four stage process. The stages in this process are business metrics, business kpi, business dashboard.
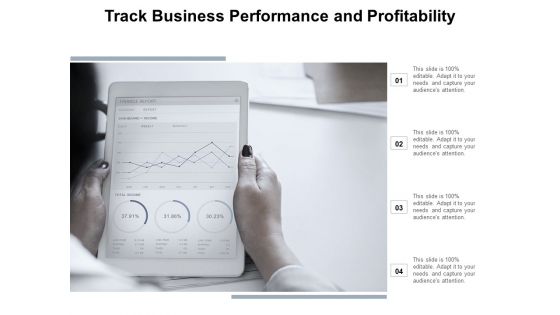
Track Business Performance And Profitability Ppt Powerpoint Presentation File Master Slide
This is a track business performance and profitability ppt powerpoint presentation file master slide. This is a four stage process. The stages in this process are business metrics, business kpi, business dashboard.
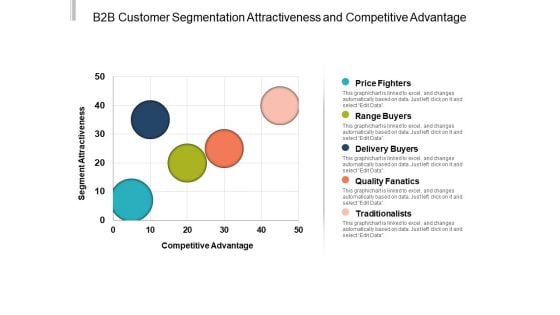
B2b Customer Segmentation Attractiveness And Competitive Advantage Ppt PowerPoint Presentation Background Designs
This is a b2b customer segmentation attractiveness and competitive advantage ppt powerpoint presentation background designs. This is a five stage process. The stages in this process are market segmentation, market mapping, segmenting targeting positioning.
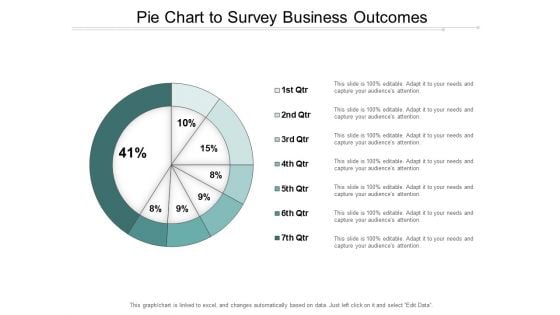
Pie Chart To Survey Business Outcomes Ppt Powerpoint Presentation Infographic Template Gridlines
This is a pie chart to survey business outcomes ppt powerpoint presentation infographic template gridlines. This is a seven stage process. The stages in this process are business outcomes, business results, business output.

Business Review And Performance Assessment Dashboards Ppt PowerPoint Presentation Infographics Show
This is a business review and performance assessment dashboards ppt powerpoint presentation infographics show. This is a four stage process. The stages in this process are year in review, yearly highlights, countdowns.

Car Dashboard And Speedometer Graphics Ppt PowerPoint Presentation File Graphics Template
This is a car dashboard and speedometer graphics ppt powerpoint presentation file graphics template. This is a four stage process. The stages in this process are fuel gauge, gas gauge, fuel containers.
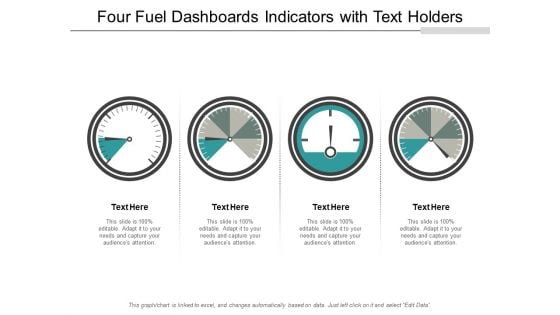
Four Fuel Dashboards Indicators With Text Holders Ppt PowerPoint Presentation File Graphics Design
This is a four fuel dashboards indicators with text holders ppt powerpoint presentation file graphics design. This is a four stage process. The stages in this process are fuel gauge, gas gauge, fuel containers.
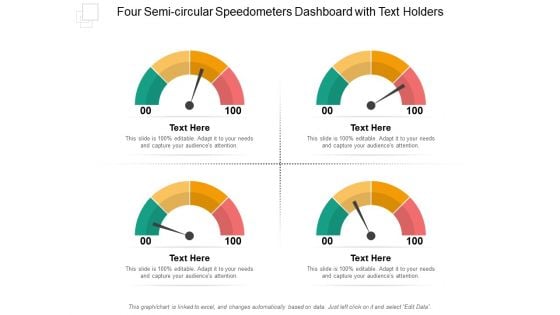
Four Semi Circular Speedometers Dashboard With Text Holders Ppt PowerPoint Presentation File Layouts
This is a four semi circular speedometers dashboard with text holders ppt powerpoint presentation file layouts. This is a four stage process. The stages in this process are fuel gauge, gas gauge, fuel containers.
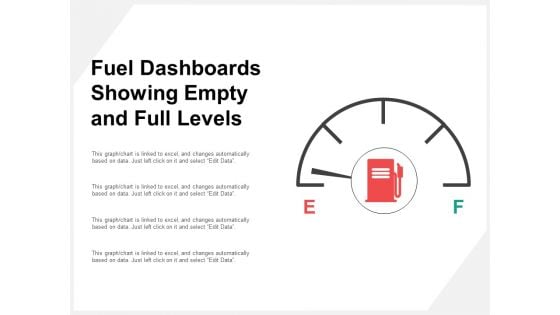
Fuel Dashboards Showing Empty And Full Levels Ppt PowerPoint Presentation Professional Slide Portrait
This is a fuel dashboards showing empty and full levels ppt powerpoint presentation professional slide portrait. This is a four stage process. The stages in this process are fuel gauge, gas gauge, fuel containers.
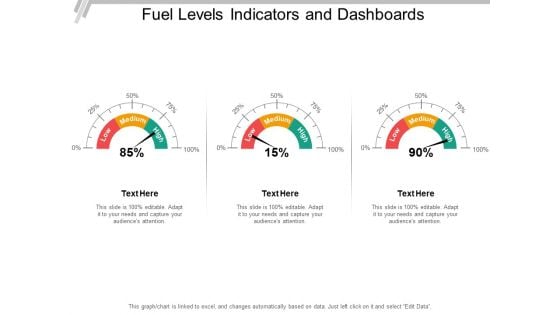
Fuel Levels Indicators And Dashboards Ppt PowerPoint Presentation Outline Skills
This is a fuel levels indicators and dashboards ppt powerpoint presentation outline skills. This is a three stage process. The stages in this process are fuel gauge, gas gauge, fuel containers.
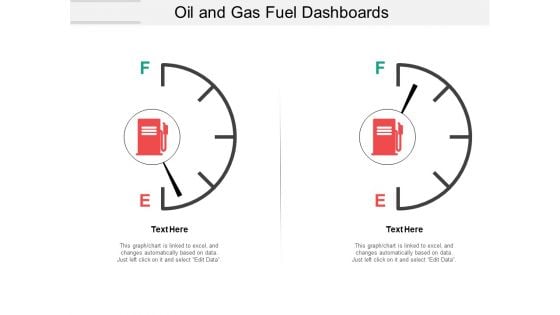
Oil And Gas Fuel Dashboards Ppt PowerPoint Presentation File Introduction
This is a oil and gas fuel dashboards ppt powerpoint presentation file introduction. This is a two stage process. The stages in this process are fuel gauge, gas gauge, fuel containers.
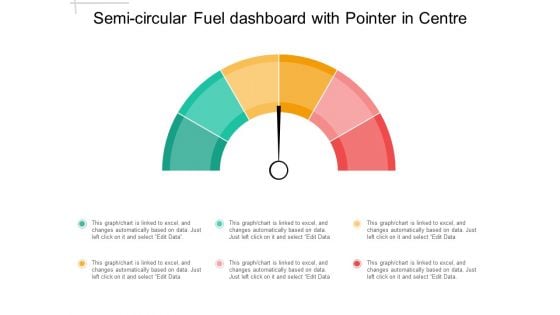
Semi Circular Fuel Dashboard With Pointer In Centre Ppt PowerPoint Presentation Outline Visuals
This is a semi circular fuel dashboard with pointer in centre ppt powerpoint presentation outline visuals. This is a three stage process. The stages in this process are fuel gauge, gas gauge, fuel containers.

Three Dashboard Speed Indicators With Text Holders Ppt PowerPoint Presentation Summary Layout
This is a three dashboard speed indicators with text holders ppt powerpoint presentation summary layout. This is a three stage process. The stages in this process are fuel gauge, gas gauge, fuel containers.
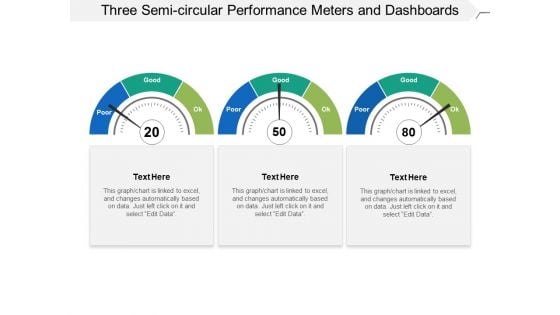
Three Semi Circular Performance Meters And Dashboards Ppt PowerPoint Presentation Slides Influencers
This is a three semi circular performance meters and dashboards ppt powerpoint presentation slides influencers. This is a three stage process. The stages in this process are fuel gauge, gas gauge, fuel containers.
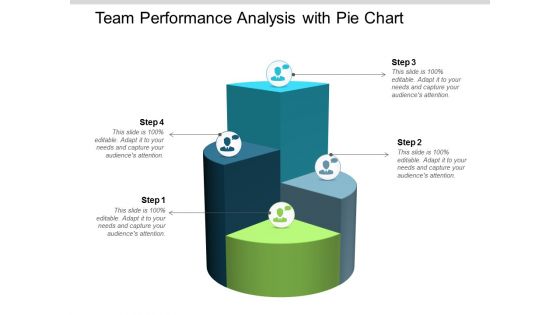
Team Performance Analysis With Pie Chart Ppt Powerpoint Presentation Infographic Template Slideshow
This is a team performance analysis with pie chart ppt powerpoint presentation infographic template slideshow. This is a four stage process. The stages in this process are team performance, member performance, group performance.

Thank You Time Analysis Ppt PowerPoint Presentation File Examples
This is a thank you time analysis ppt powerpoint presentation file examples. This is a one stage process. The stages in this process are thank you.
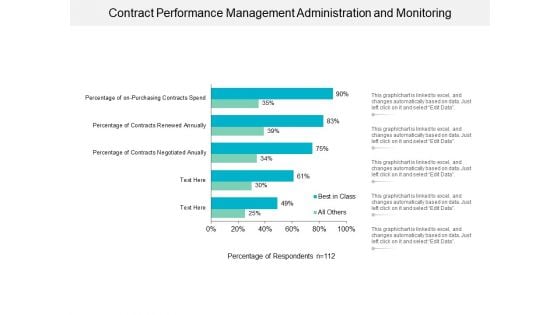
Contract Performance Management Administration And Monitoring Ppt PowerPoint Presentation Inspiration Deck
This is a contract performance management administration and monitoring ppt powerpoint presentation inspiration deck. This is a five stage process. The stages in this process are contract management, contract negotiation, deal making.
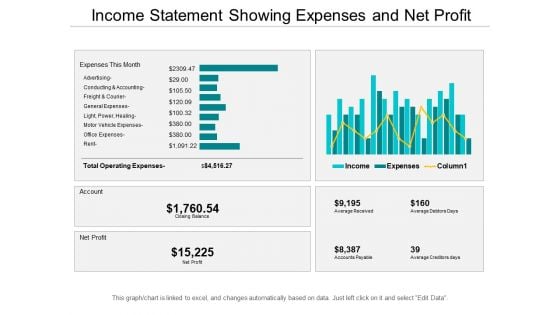
Income Statement Showing Expenses And Net Profit Ppt PowerPoint Presentation Slides Example
This is a income statement showing expenses and net profit ppt powerpoint presentation slides example. This is a five stage process. The stages in this process are accounting review, accounting report, accounting statement.
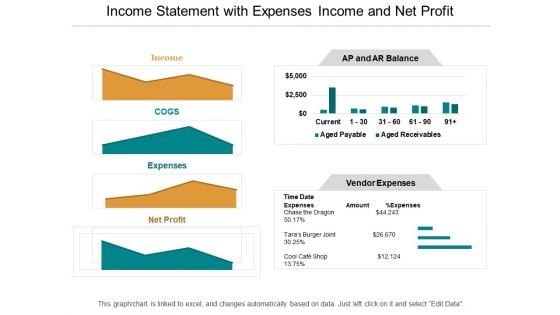
Income Statement With Expenses Income And Net Profit Ppt PowerPoint Presentation Infographic Template Smartart
This is a income statement with expenses income and net profit ppt powerpoint presentation infographic template smartart. This is a four stage process. The stages in this process are accounting review, accounting report, accounting statement.
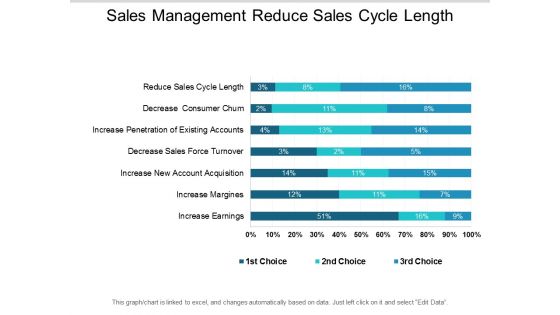
Sales Management Reduce Sales Cycle Length Ppt Powerpoint Presentation Ideas Deck
This is a sales management reduce sales cycle length ppt powerpoint presentation ideas deck. This is a three stage process. The stages in this process are enablement plan, enablement strategy, enablement idea.

Pos System Accept Card Payment Ppt PowerPoint Presentation Model Graphics Design
This is a pos system accept card payment ppt powerpoint presentation model graphics design. This is a four stage process. The stages in this process are point of purchase, point of sale system, pos.
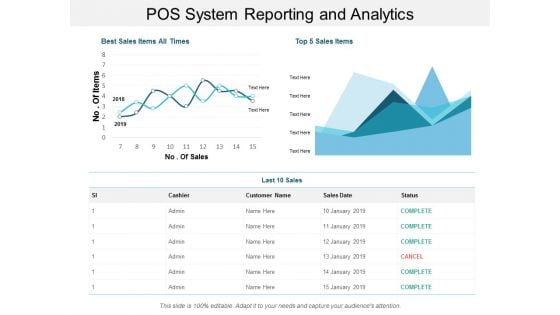
Pos System Reporting And Analytics Ppt PowerPoint Presentation Summary Gallery
This is a pos system reporting and analytics ppt powerpoint presentation summary gallery. This is a two stage process. The stages in this process are point of purchase, point of sale system, pos.
Spinning Wheel With Dollar Sign Vector Icon Ppt PowerPoint Presentation Portfolio Deck Cpb
This is a spinning wheel with dollar sign vector icon ppt powerpoint presentation portfolio deck cpb. This is a four stage process. The stages in this process are wheel of fortune, american game, wheel watchers.
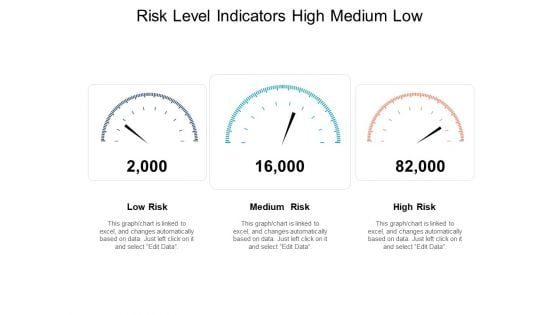
Risk Level Indicators High Medium Low Ppt PowerPoint Presentation Pictures Template
Presenting this set of slides with name risk level indicators high medium low ppt powerpoint presentation pictures template. This is a three stage process. The stages in this process are high low risk, risk con, warning. This is a completely editable PowerPoint presentation and is available for immediate download. Download now and impress your audience.
Bar Graph Icon For Research Analysis Ppt PowerPoint Presentation Summary Portfolio
Presenting this set of slides with name bar graph icon for research analysis ppt powerpoint presentation summary portfolio. This is a three stage process. The stages in this process are data visualization icon, research analysis, business focus. This is a completely editable PowerPoint presentation and is available for immediate download. Download now and impress your audience.
Data Representation Vector Icon Ppt PowerPoint Presentation Infographic Template Samples
Presenting this set of slides with name data representation vector icon ppt powerpoint presentation infographic template samples. This is a one stage process. The stages in this process are data visualization icon, research analysis, business focus. This is a completely editable PowerPoint presentation and is available for immediate download. Download now and impress your audience.
Students Sitting In Classroom Vector Icon Ppt PowerPoint Presentation Styles Outfit
Presenting this set of slides with name students sitting in classroom vector icon ppt powerpoint presentation styles outfit. This is a one process. The stages in this process are Classroom, Management, Strategy, Planning, Business. This is a completely editable PowerPoint presentation and is available for immediate download. Download now and impress your audience.

Thank You Feedback And Performance Management Ppt PowerPoint Presentation Styles Gridlines
Presenting this set of slides with name thank you feedback and performance management ppt powerpoint presentation styles gridlines. This is a one stage process. The stages in this process are thank you. This is a completely editable PowerPoint presentation and is available for immediate download. Download now and impress your audience.
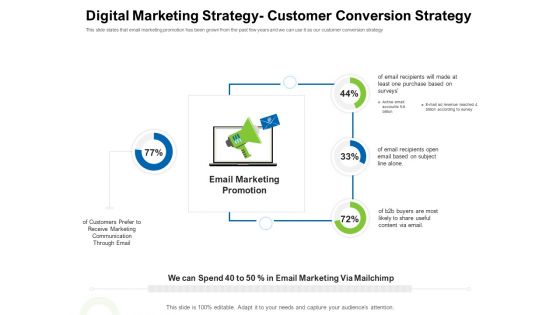
Strategies To Enter Physical Fitness Club Business Digital Marketing Strategy Customer Conversion Strategy Pictures PDF
This slide states that email marketing promotion has been grown from the past few years and we can use it as our customer conversion strategy Presenting strategies to enter physical fitness club business digital marketing strategy customer conversion strategy pictures pdf to provide visual cues and insights. Share and navigate important information on four stages that need your due attention. This template can be used to pitch topics like email, marketing, promotion, communication, buyers. In addtion, this PPT design contains high resolution images, graphics, etc, that are easily editable and available for immediate download.

Market Entry Strategy Clubs Industry Analytics Dashboard For Gym Health And Fitness Clubs Summary PDF
This slide covers the Key performance indicators for analysing social media platforms, email campaigns and website performance. Presenting market entry strategy clubs industry analytics dashboard for gym health and fitness clubs summary pdf to provide visual cues and insights. Share and navigate important information on seven stages that need your due attention. This template can be used to pitch topics like Analytics Dashboard for Gym Health and Fitness Clubs. In addtion, this PPT design contains high-resolution images, graphics, etc, that are easily editable and available for immediate download.
Cuba Country Currency Notes Of 5 Pesos Ppt PowerPoint Presentation Icon Elements PDF
Presenting cuba country currency notes of 5 pesos ppt powerpoint presentation icon elements pdf to dispense important information. This template comprises two stages. It also presents valuable insights into the topics including cuba country currency notes of 5 pesos . This is a completely customizable PowerPoint theme that can be put to use immediately. So, download it and address the topic impactfully.
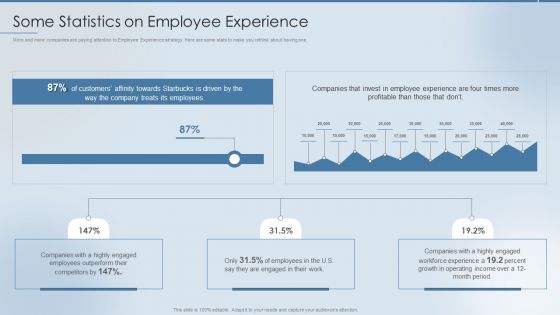
Strategies To Attract And Retain Some Statistics On Employee Experience Professional PDF
More and more companies are paying attention to Employee Experience strategy. Here are some stats to make you rethink about having one. This is a Strategies To Attract And Retain Some Statistics On Employee Experience Professional PDF template with various stages. Focus and dispense information on one stages using this creative set, that comes with editable features. It contains large content boxes to add your information on topics like Customers Affinity, Employees. You can also showcase facts, figures, and other relevant content using this PPT layout. Grab it now.
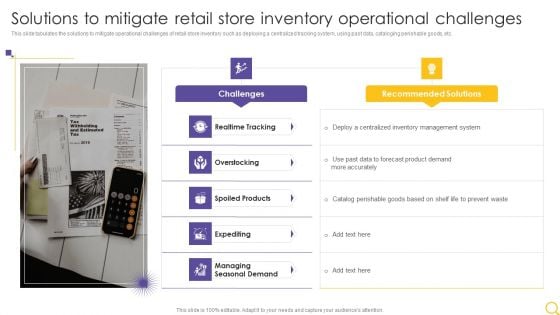
Retail Outlet Operational Efficiency Analytics Solutions To Mitigate Retail Store Inventory Pictures PDF
This slide tabulates the solutions to mitigate operational challenges of retail store inventory such as deploying a centralized tracking system, using past data, cataloging perishable goods, etc. Presenting Retail Outlet Operational Efficiency Analytics Solutions To Mitigate Retail Store Inventory Pictures PDF to provide visual cues and insights. Share and navigate important information on two stages that need your due attention. This template can be used to pitch topics like Challenges, Recommended Solutions, Realtime Tracking. In addtion, this PPT design contains high resolution images, graphics, etc, that are easily editable and available for immediate download.
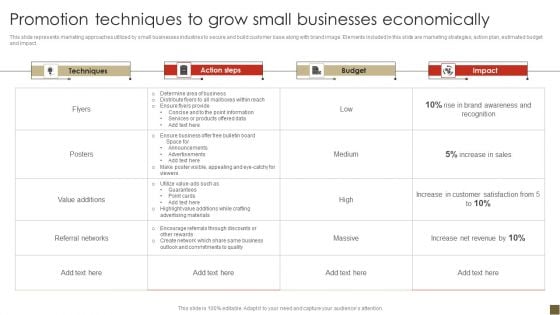
Promotion Techniques To Grow Small Businesses Economically Formats PDF
This slide represents marketing approaches utilized by small businesses industries to secure and build customer base along with brand image. Elements included in this slide are marketing strategies, action plan, estimated budget and impact. Pitch your topic with ease and precision using this Promotion Techniques To Grow Small Businesses Economically Formats PDF. This layout presents information on Techniques, Action Steps, Budget, Impact. It is also available for immediate download and adjustment. So, changes can be made in the color, design, graphics or any other component to create a unique layout.
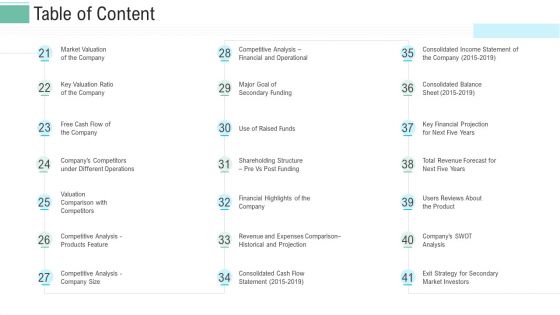
Pitch Presentation Raise Money Spot Market Table Of Content Use Ppt Portfolio Outfit PDF
Deliver an awe-inspiring pitch with this creative pitch presentation raise money spot market table of content use ppt portfolio outfit pdf bundle. Topics like competitive analysis, market valuation, financial and operational can be discussed with this completely editable template. It is available for immediate download depending on the needs and requirements of the user.
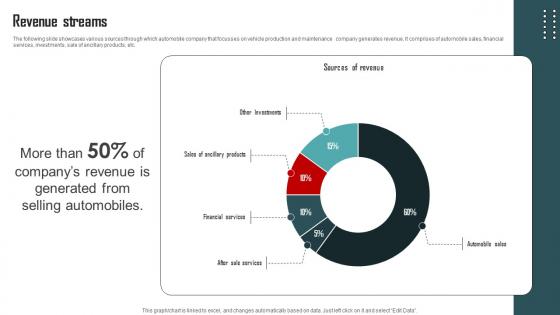
Revenue Streams Vehicle Company Capital Funding Pitch Deck
The following slide showcases various sources through which automobile company that focusses on vehicle production and maintenance company generates revenue. It comprises of automobile sales, financial services, investments, sale of ancillary products, etc. Coming up with a presentation necessitates that the majority of the effort goes into the content and the message you intend to convey. The visuals of a PowerPoint presentation can only be effective if it supplements and supports the story that is being told. Keeping this in mind our experts created Revenue Streams Vehicle Company Capital Funding Pitch Deck to reduce the time that goes into designing the presentation. This way, you can concentrate on the message while our designers take care of providing you with the right template for the situation. The following slide showcases various sources through which automobile company that focusses on vehicle production and maintenance company generates revenue. It comprises of automobile sales, financial services, investments, sale of ancillary products, etc.


 Continue with Email

 Home
Home


