Financial Budget
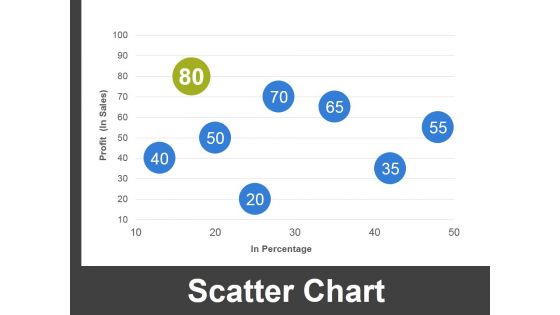
Scatter Chart Ppt PowerPoint Presentation Pictures Slide Download
This is a scatter chart ppt powerpoint presentation pictures slide download. This is a two stage process. The stages in this process are scatter chart, finance, analysis, marketing, business.

Competency Rating Template 2 Ppt PowerPoint Presentation Summary Templates
This is a competency rating template 2 ppt powerpoint presentation summary templates. This is a eight stage process. The stages in this process are business, finance, marketing, strategy, analysis.

Employee Who Leave Within First 6 Months Ppt PowerPoint Presentation Gallery Grid
This is a employee who leave within first 6 months ppt powerpoint presentation gallery grid. This is a two stage process. The stages in this process are business, finance, marketing, strategy, analysis.
Bar Graph Ppt PowerPoint Presentation Icon Clipart Images
This is a bar graph ppt powerpoint presentation icon clipart images. This is a three stage process. The stages in this process are bar graph, finance, marketing, strategy, analysis.
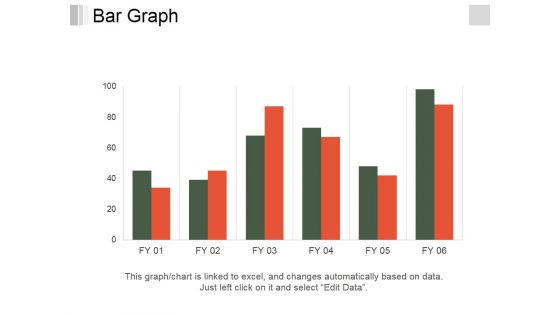
Bar Graph Ppt PowerPoint Presentation Slides Background Image
This is a bar graph ppt powerpoint presentation slides background image. This is a six stage process. The stages in this process are bar graph, finance, marketing, analysis, business.
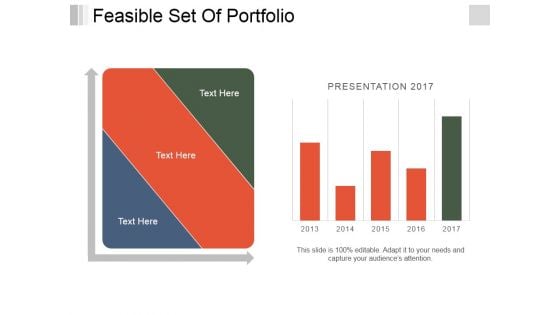
Feasible Set Of Portfolio Ppt PowerPoint Presentation Pictures Layouts
This is a feasible set of portfolio ppt powerpoint presentation pictures layouts. This is a two stage process. The stages in this process are business, finance, growth, marketing, strategy, analysis.
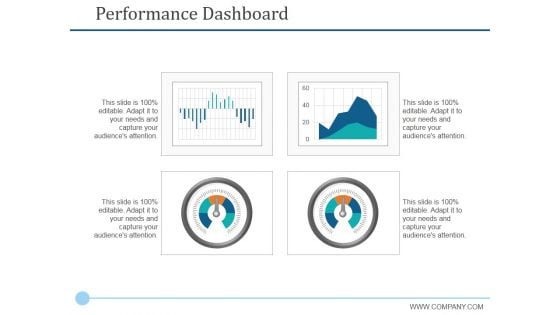
Performance Dashboard Template 2 Ppt PowerPoint Presentation Styles Graphics Tutorials
This is a performance dashboard template 2 ppt powerpoint presentation styles graphics tutorials. This is a four stage process. The stages in this process are finance, business, marketing, management.
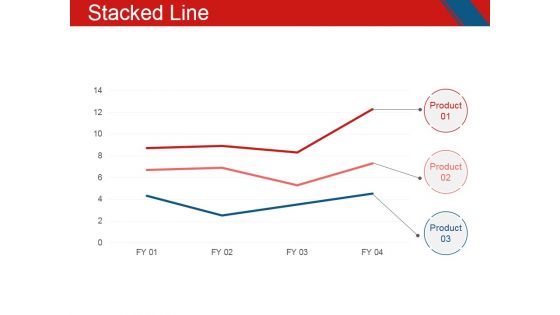
Stacked Line Ppt PowerPoint Presentation Styles Graphic Images
This is a stacked line ppt powerpoint presentation styles graphic images. This is a three stage process. The stages in this process are business, marketing, finance, stacked line, management.
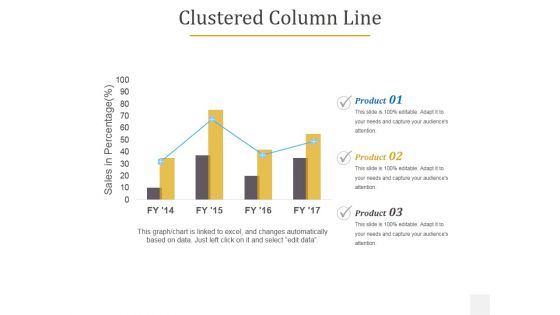
Clustered Column Line Ppt PowerPoint Presentation Infographic Template Design Templates
This is a clustered column line ppt powerpoint presentation infographic template design templates. This is a four stage process. The stages in this process are business, marketing, column line, finance, product.

Advertising Spent On Different Mediums Ppt PowerPoint Presentation Infographics Show
This is a advertising spent on different mediums ppt powerpoint presentation infographics show. This is a five stage process. The stages in this process are business, finance, marketing, strategy, bar graph, growth.
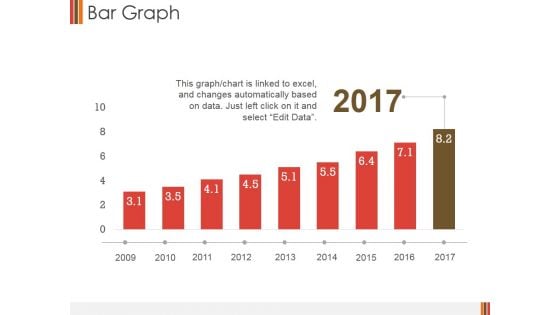
Bar Graph Ppt PowerPoint Presentation Show Topics
This is a bar graph ppt powerpoint presentation show topics. This is a nine stage process. The stages in this process are business, finance, marketing, strategy, bar graph, growth.
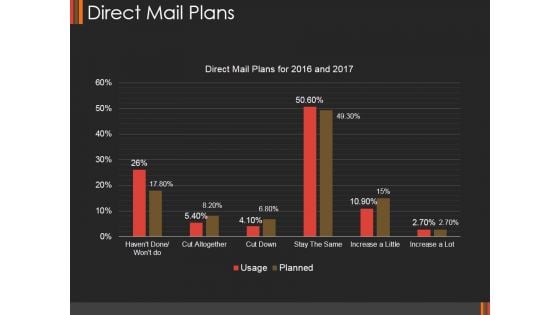
Direct Mail Plans Ppt PowerPoint Presentation Portfolio Show
This is a direct mail plans ppt powerpoint presentation portfolio show. This is a six stage process. The stages in this process are business, finance, marketing, strategy, planning, success.
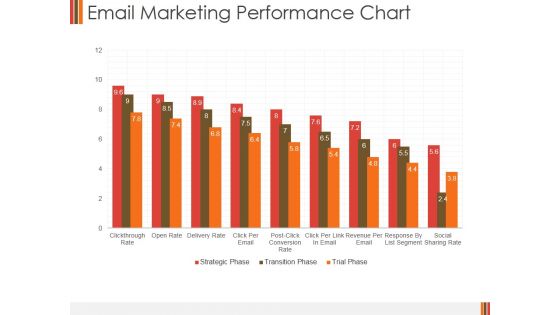
Email Marketing Performance Chart Ppt PowerPoint Presentation Portfolio Inspiration
This is a email marketing performance chart ppt powerpoint presentation portfolio inspiration. This is a nine stage process. The stages in this process are business, finance, marketing, performance chart, strategy, analysis.

Our Charts And Graphs Ppt PowerPoint Presentation File Visuals
This is a our charts and graphs ppt powerpoint presentation file visuals. This is a one stage process. The stages in this process are business, strategy, marketing, analysis, finance.
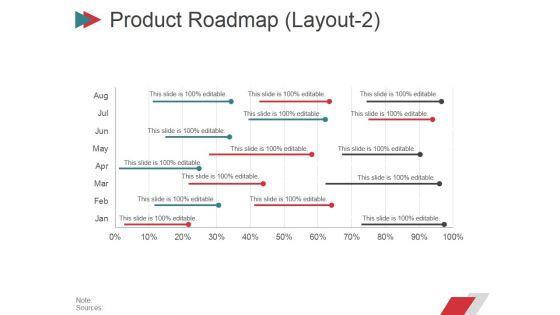
Product Roadmap Layout2 Ppt PowerPoint Presentation Infographic Template Clipart
This is a product roadmap layout2 ppt powerpoint presentation infographic template clipart. This is a five stage process. The stages in this process are business, marketing, graph, finance, planning.
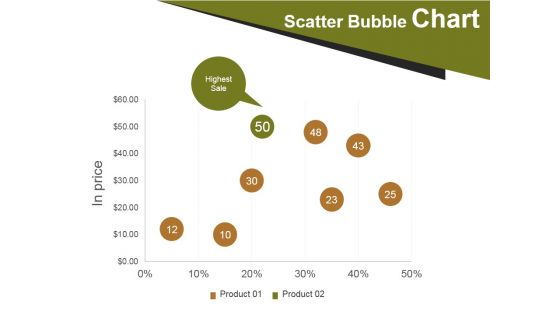
Scatter Bubble Chart Ppt PowerPoint Presentation Show Tips
This is a scatter bubble chart ppt powerpoint presentation show tips. This is a two stage process. The stages in this process are scatter bubble chart, finance, marketing, strategy, business.
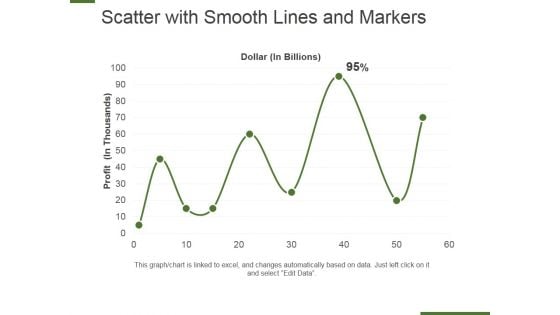
Scatter With Smooth Lines And Markers Ppt PowerPoint Presentation Styles Design Ideas
This is a scatter with smooth lines and markers ppt powerpoint presentation styles design ideas. This is a nine stage process. The stages in this finance, management, strategy, marketing, business.
Scatter Bubble Chart Ppt PowerPoint Presentation Infographics Icons
This is a scatter bubble chart ppt powerpoint presentation infographics icons. This is a eight stage process. The stages in this process are highest sale, finance, business, management, marketing, chart.
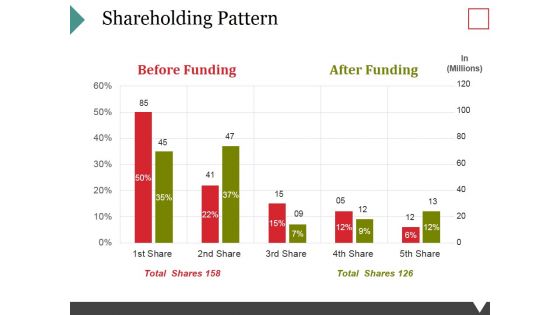
Shareholding Pattern Template 2 Ppt PowerPoint Presentation Visual Aids Layouts
This is a shareholding pattern template 2 ppt powerpoint presentation visual aids layouts. This is a five stage process. The stages in this process are finance, management, business, comparison, shares.
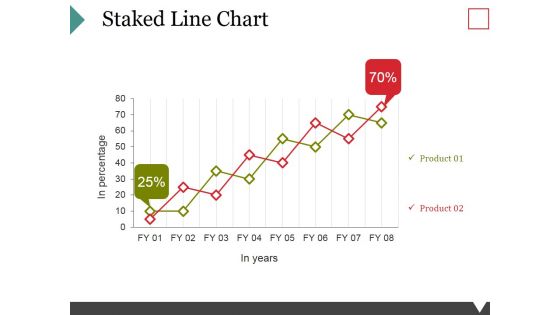
Staked Line Chart Ppt PowerPoint Presentation Model Graphics Download
This is a staked line chart ppt powerpoint presentation model graphics download. This is a two stage process. The stages in this process are business, marketing, growth, finance, management.
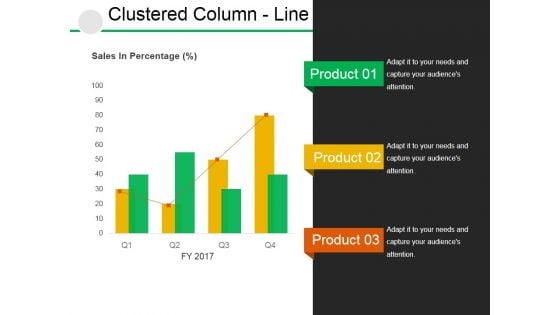
Clustered Column Line Ppt PowerPoint Presentation Slides Ideas
This is a clustered column line ppt powerpoint presentation slides ideas. This is a four stage process. The stages in this process are business, finance, marketing, strategy, analysis, success.
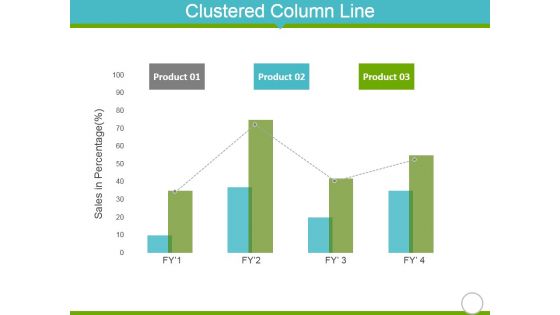
Clustered Column Line Ppt Powerpoint Presentation Slides Demonstration
This is a clustered column line ppt powerpoint presentation slides demonstration. This is a four stage process. The stages in this process are product, sales in percentage, finance, marketing.
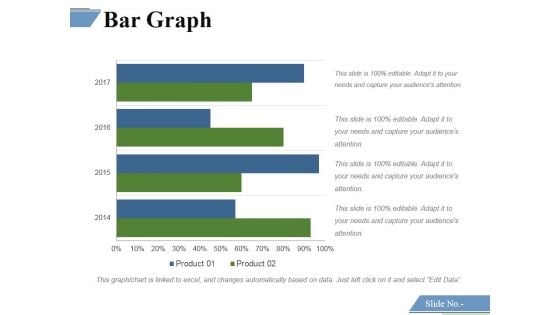
Bar Graph Ppt PowerPoint Presentation Infographics Slide Download
This is a bar graph ppt powerpoint presentation infographics slide download. This is a four stage process. The stages in this process are bar graph, finance, marketing, strategy, analysis.
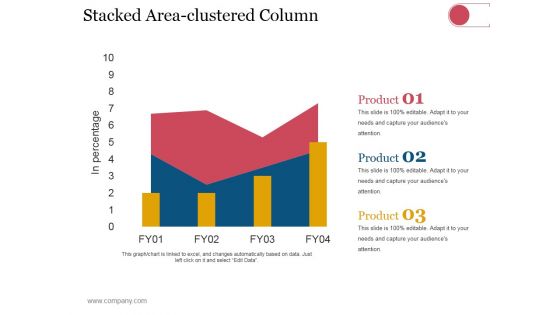
Stacked Area Clustered Column Ppt PowerPoint Presentation Styles Gridlines
This is a stacked area clustered column ppt powerpoint presentation styles gridlines. This is a three stage process. The stages in this process are dollars, in percentage, finance, growth strategy, business, strategy.
Clustered Bar Template 1 Ppt PowerPoint Presentation Icon Gallery
This is a clustered bar template 1 ppt powerpoint presentation icon gallery. This is a four stage process. The stages in this process are finance, management, planning, strategy, marketing.
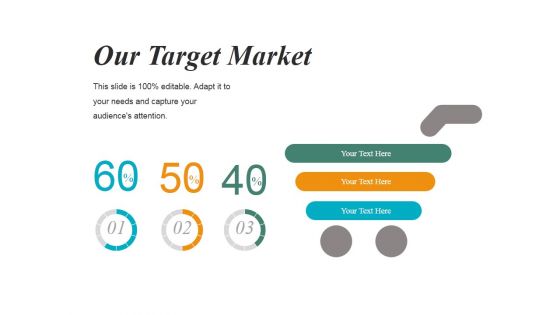
Our Target Market Template 1 Ppt PowerPoint Presentation Slides Introduction
This is a our target market template 1 ppt powerpoint presentation slides introduction. This is a three stage process. The stages in this process are finance, percentage, business, marketing.
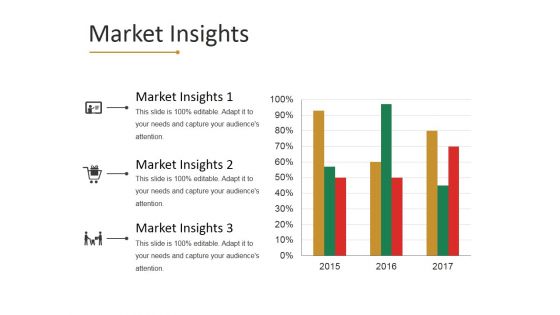
Market Insights Template 1 Ppt PowerPoint Presentation Show Brochure
This is a market insights template 1 ppt powerpoint presentation show brochure. This is a three stage process. The stages in this process are business, finance, marketing, analysis, growth.
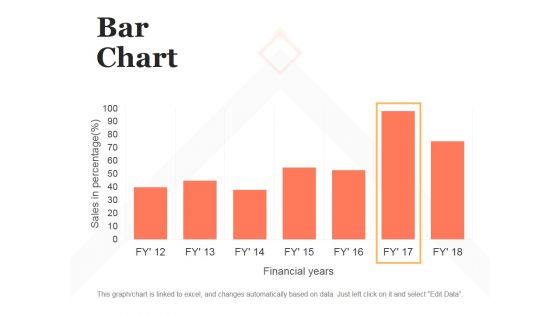
Bar Chart Ppt PowerPoint Presentation Infographic Template Brochure
This is a bar chart ppt powerpoint presentation infographic template brochure. This is a seven stage process. The stages in this process are bar graph, finance, marketing, strategy, analysis, business.

Combo Chart Ppt PowerPoint Presentation Infographic Template Themes
This is a combo chart ppt powerpoint presentation infographic template themes. This is a eight stage process. The stages in this process are combo chart, finance, marketing, strategy, analysis, business.
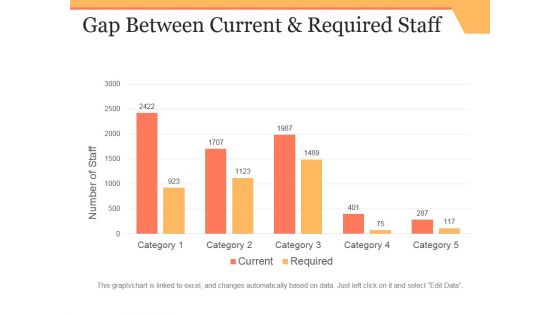
Gap Between Current And Required Staff Ppt PowerPoint Presentation Infographic Template Microsoft
This is a gap between current and required staff ppt powerpoint presentation infographic template microsoft. This is a five stage process. The stages in this process are business, bar graph, finance, marketing, strategy, analysis.

Internal Analysis Template 1 Ppt PowerPoint Presentation Summary Example Topics
This is a internal analysis template 1 ppt powerpoint presentation summary example topics. This is a three stage process. The stages in this process are employee performance, finance, analysis, strategy, growth, business.
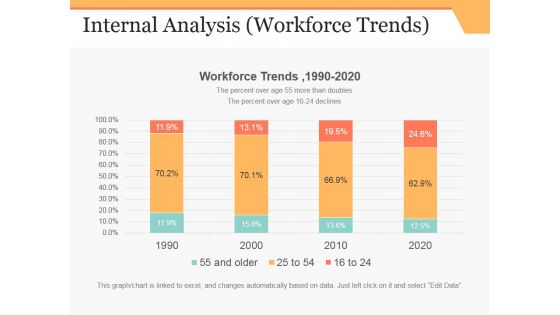
Internal Analysis Template 5 Ppt PowerPoint Presentation File Inspiration
This is a internal analysis template 5 ppt powerpoint presentation file inspiration. This is a four stage process. The stages in this process are internal analysis, finance, marketing, strategy, business.
Bar Chart Ppt PowerPoint Presentation Portfolio Icons
This is a bar chart ppt powerpoint presentation portfolio icons. This is a seven stage process. The stages in this process are in years, in percentage, finance, business marketing.
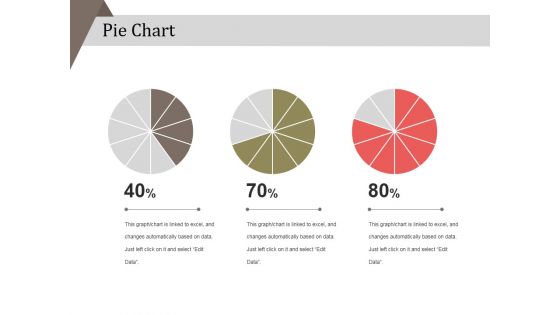
Pie Chart Ppt PowerPoint Presentation Layouts Example
This is a pie chart ppt powerpoint presentation layouts example. This is a three stage process. The stages in this process are business, strategy, analysis, pie chart, finance, marketing.
Underlying Magic Ppt PowerPoint Presentation Icon Template
This is a underlying magic ppt powerpoint presentation icon template. This is a one stage process. The stages in this process are underlying magic, currency, finance, marketing, analysis, business.
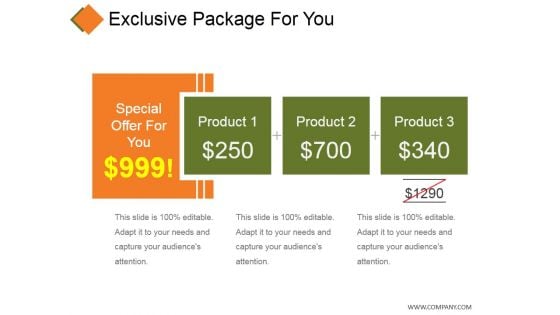
Exclusive Package For You Ppt PowerPoint Presentation Show File Formats
This is a exclusive package for you ppt powerpoint presentation show file formats. This is a three stage process. The stages in this process are product, finance, business, marketing.
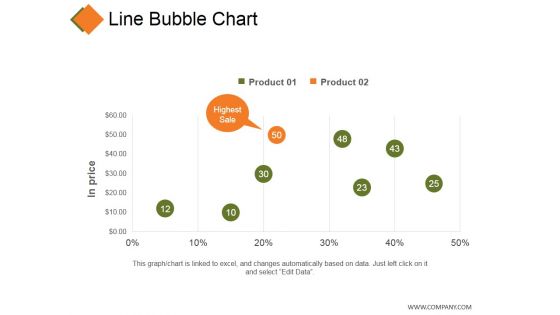
Line Bubble Chart Ppt PowerPoint Presentation Professional Infographic Template
This is a line bubble chart ppt powerpoint presentation professional infographic template. This is a five stage process. The stages in this process are product, in price, highest sale, business, finance.
Distribution Growth Ppt PowerPoint Presentation Slides Icons
This is a distribution growth ppt powerpoint presentation slides icons. This is a six stage process. The stages in this process are business, bar graph, finance, marketing, strategy, growth.
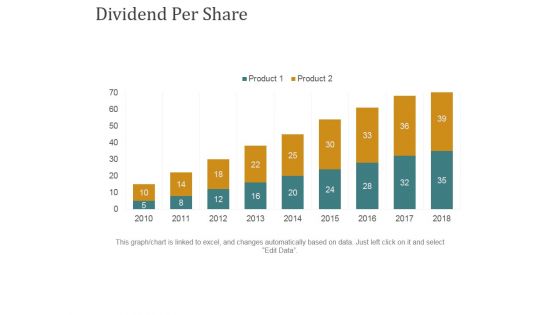
Dividend Per Share Ppt PowerPoint Presentation Summary Rules
This is a dividend per share ppt powerpoint presentation summary rules. This is a nine stage process. The stages in this process are business, bar graph, finance, marketing, strategy, growth.
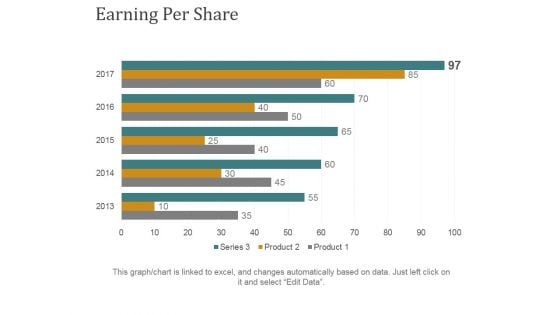
Earning Per Share Ppt PowerPoint Presentation Slides Smartart
This is a earning per share ppt powerpoint presentation slides smartart. This is a five stage process. The stages in this process are earning per share, finance, marketing, strategy, business.
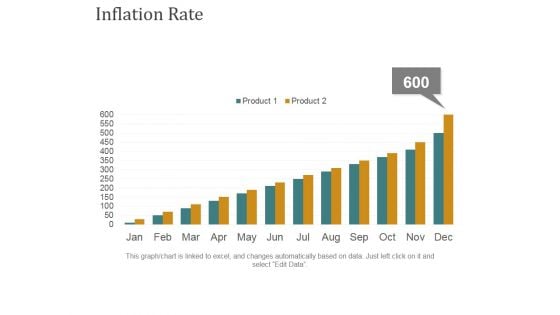
Inflation Rate Template 1 Ppt PowerPoint Presentation Professional Design Inspiration
This is a inflation rate template 1 ppt powerpoint presentation professional design inspiration. This is a twelve stage process. The stages in this process are business, finance, growth, marketing, strategy, analysis.
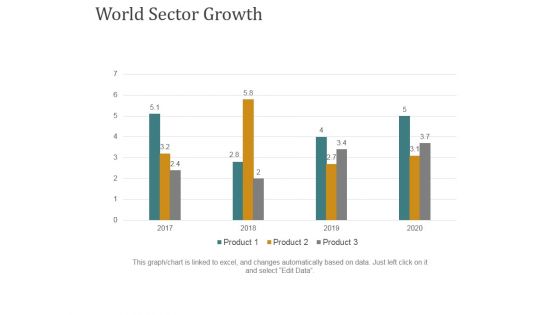
World Sector Growth Ppt PowerPoint Presentation Gallery Template
This is a world sector growth ppt powerpoint presentation gallery template. This is a four stage process. The stages in this process are business, bar graph, finance, marketing, strategy.
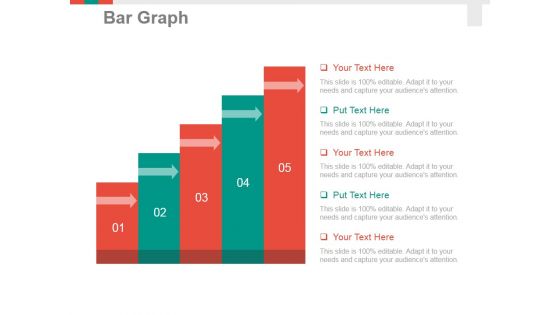
Bar Graph Ppt PowerPoint Presentation Pictures Tips
This is a bar graph ppt powerpoint presentation pictures tips. This is a five stage process. The stages in this process are bar graph, finance, marketing, strategy, analysis, business.
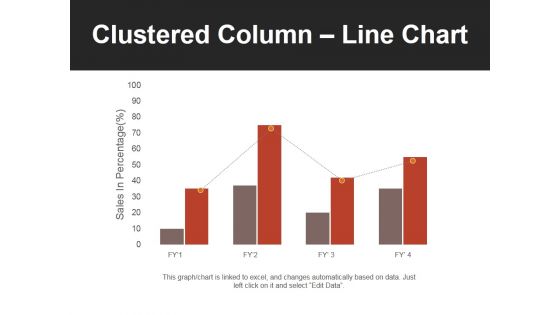
Clustered Column Line Chart Ppt PowerPoint Presentation Professional Slides
This is a clustered column line chart ppt powerpoint presentation professional slides. This is a four stage process. The stages in this process are bar, finance, business, marketing, growth.
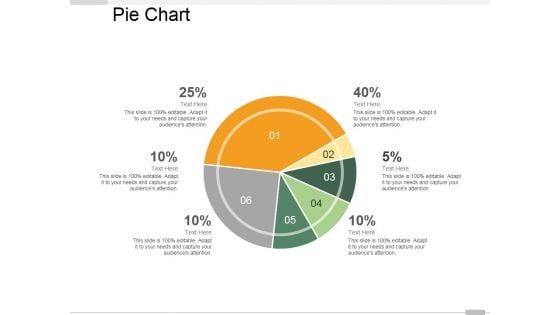
Pie Chart Ppt PowerPoint Presentation Infographic Template Master Slide
This is a pie chart ppt powerpoint presentation infographic template master slide. This is a six stage process. The stages in this process are pie chart, marketing, finance, analysis, business.
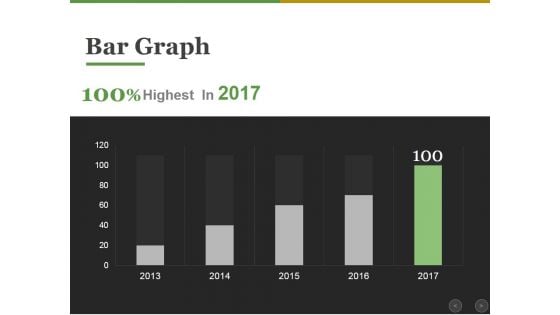
Bar Graph Ppt PowerPoint Presentation Infographic Template Graphics
This is a bar graph ppt powerpoint presentation infographic template graphics. This is a five stage process. The stages in this process are bar graph, finance, marketing, strategy, analysis, business.
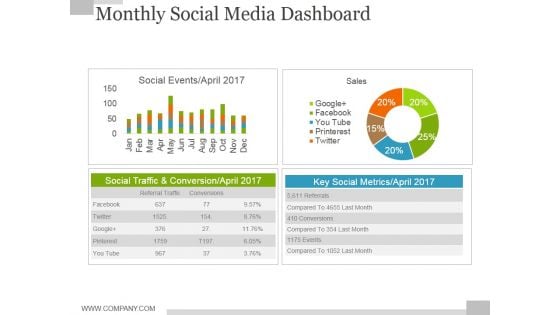
Monthly Social Media Dashboard Ppt PowerPoint Presentation Model Slide
This is a monthly social media dashboard ppt powerpoint presentation model slide. This is a four stage process. The stages in this process are sales, social events, business, finance, key social metrics.
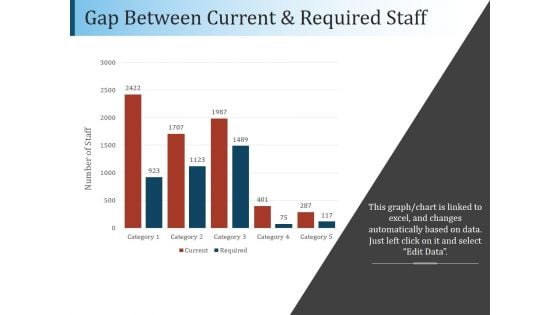
Gap Between Current And Required Staff Ppt PowerPoint Presentation File Diagrams
This is a gap between current and required staff ppt powerpoint presentation file diagrams. This is a five stage process. The stages in this process are bar, finance, analysis, planning, business.
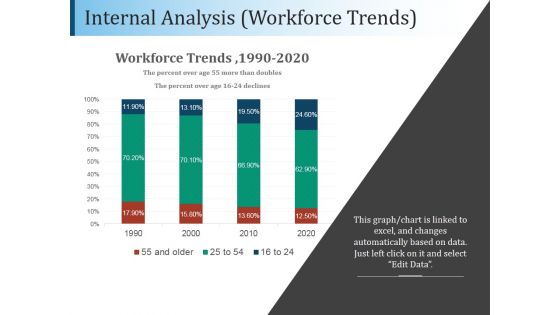
Internal Analysis Workforce Trends Ppt PowerPoint Presentation Example
This is a internal analysis workforce trends ppt powerpoint presentation example. This is a four stage process. The stages in this process are workforce trends, business, marketing, bar, finance.
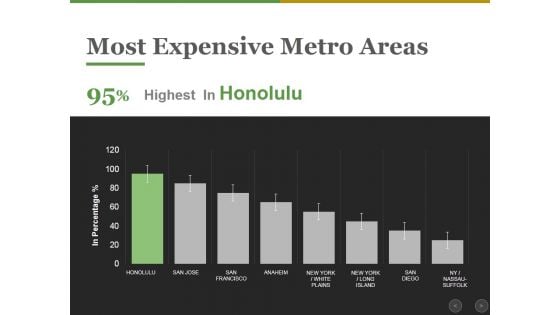
Most Expensive Metro Areas Ppt PowerPoint Presentation Ideas Layouts
This is a most expensive metro areas ppt powerpoint presentation ideas layouts. This is a eight stage process. The stages in this process are business, finance, marketing, strategy, analysis.
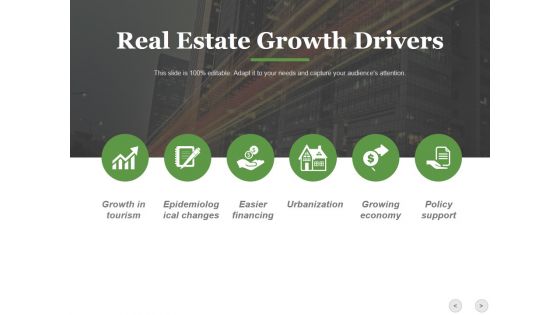
Real Estate Growth Drivers Ppt PowerPoint Presentation Summary Visual Aids
This is a real estate growth drivers ppt powerpoint presentation summary visual aids. This is a six stage process. The stages in this process are growth in tourism, epidemiological changes, easier financing, urbanization, growing economy , policy support.
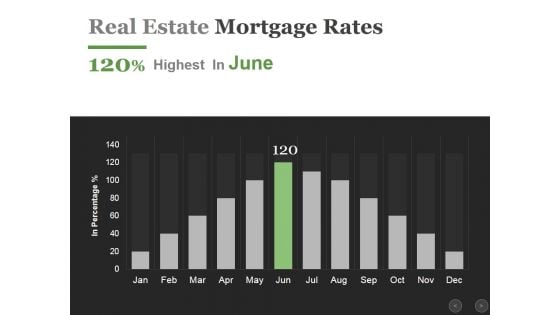
Real Estate Mortgage Rates Ppt PowerPoint Presentation Infographics Influencers
This is a real estate mortgage rates ppt powerpoint presentation infographics influencers. This is a twelve stage process. The stages in this process are business, finance, marketing, analysis, growth.

Real Estate New Home Loan Applications Ppt PowerPoint Presentation Model Themes
This is a real estate new home loan applications ppt powerpoint presentation model themes. This is a one stage process. The stages in this process are real estate, home loan, growth, finance, business.
Real Estate Prices Activity Ppt PowerPoint Presentation Icon File Formats
This is a real estate prices activity ppt powerpoint presentation icon file formats. This is a four stage process. The stages in this process are business, finance, marketing, strategy, prices.
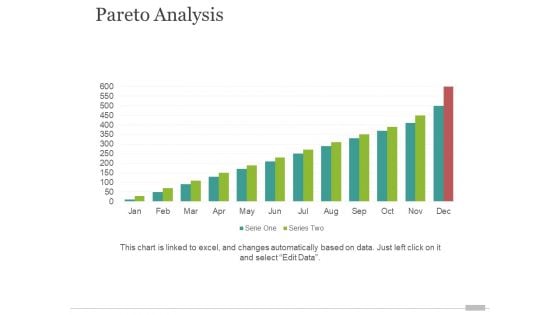
Pareto Analysis Template 2 Ppt PowerPoint Presentation File Guide
This is a pareto analysis template 2 ppt powerpoint presentation file guide. This is a twelve stage process. The stages in this process are finance, analysis, business, strategy, marketing.
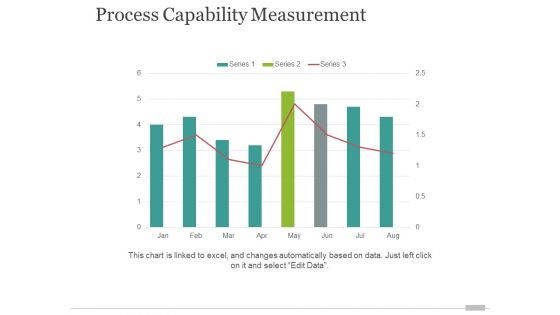
Process Capability Measurement Template 2 Ppt PowerPoint Presentation Gallery Graphics Example
This is a process capability measurement template 2 ppt powerpoint presentation gallery graphics example. This is a eight stage process. The stages in this process are finance, analysis, business, strategy, marketing.
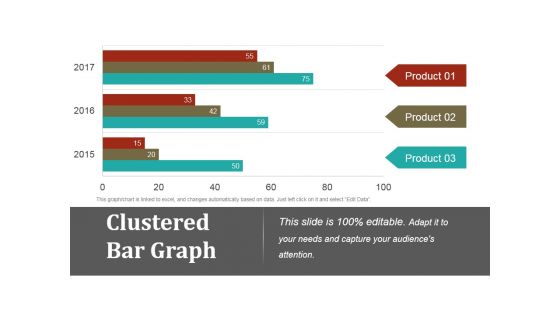
Clustered Bar Graph Ppt PowerPoint Presentation Gallery Graphics Example
This is a clustered bar graph ppt powerpoint presentation gallery graphics example. This is a three stage process. The stages in this process are clustered bar graph, finance, marketing, strategy, business.
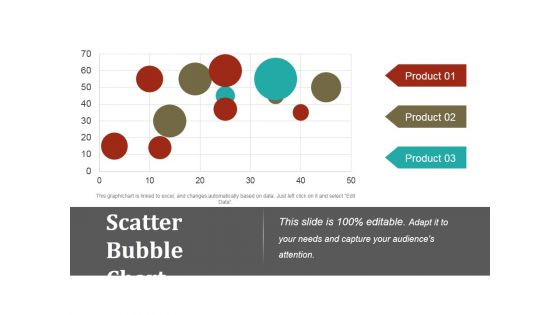
Scatter Bubble Chart Ppt PowerPoint Presentation Outline Rules
This is a scatter bubble chart ppt powerpoint presentation outline rules. This is a three stage process. The stages in this process are scatter bubble chart, product, finance, marketing, business.
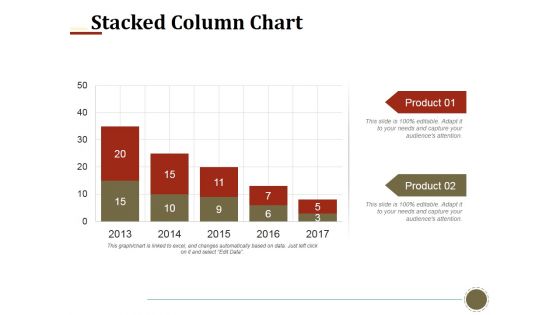
Stacked Column Chart Ppt PowerPoint Presentation Infographics Smartart
This is a stacked column chart ppt powerpoint presentation infographics smartart. This is a two stage process. The stages in this process are stacked column chart, business, finance, marketing, strategy.
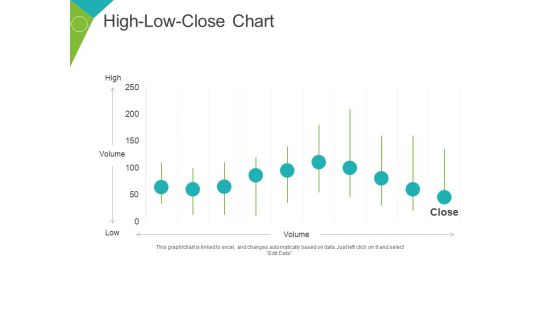
High Low Close Chart Ppt PowerPoint Presentation Layouts Guide
This is a high low close chart ppt powerpoint presentation layouts guide. This is a ten stage process. The stages in this process are high, volume, low, business, marketing, finance.


 Continue with Email

 Home
Home


