Financial Budget

Generating Leads Sales Funnel Diagram Ppt Examples
This is a generating leads sales funnel diagram ppt examples. This is a four stage process. The stages in this process are revenue, opportunities, qualified leads, inquiries.
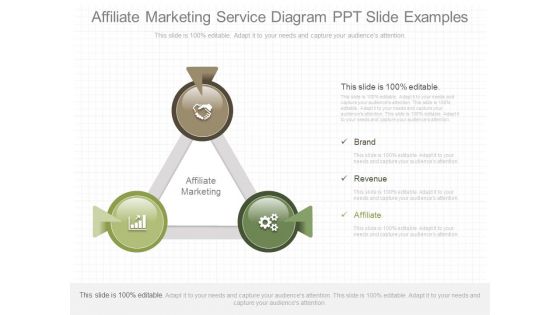
Affiliate Marketing Service Diagram Ppt Slide Examples
This is a affiliate marketing service diagram ppt slide examples. This is a three stage process. The stages in this process are brand, revenue, affiliate, affiliate marketing.
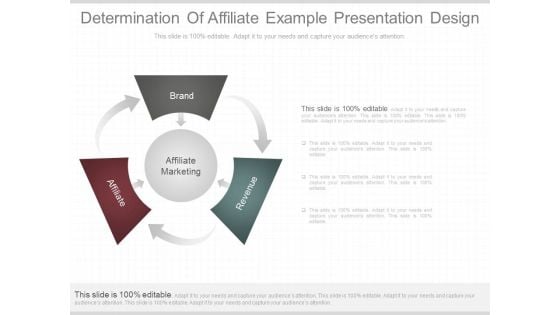
Determination Of Affiliate Example Presentation Design
This is a determination of affiliate example presentation design. This is a four stage process. The stages in this process are brand, affiliate, revenue, affiliate marketing.
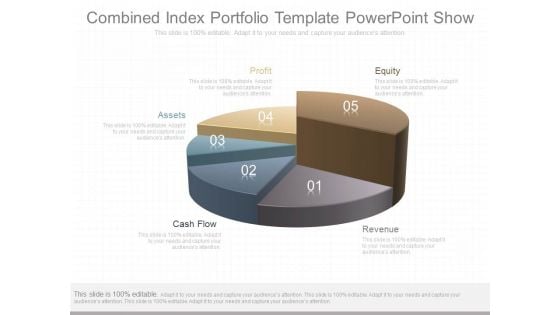
Combined Index Portfolio Template Powerpoint Show
This is a combined index portfolio template powerpoint show. This is a five stage process. The stages in this process are revenue, cash flow, assets, profit, equity.
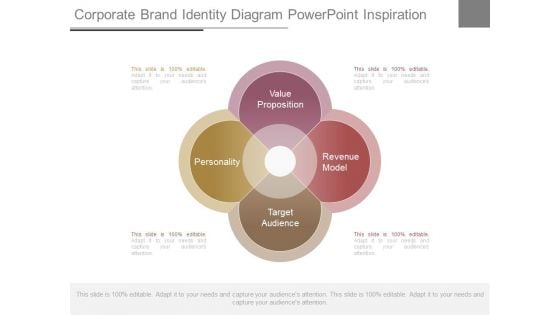
Corporate Brand Identity Diagram Powerpoint Inspiration
This is a corporate brand identity diagram powerpoint inspiration. This is a four stage process. The stages in this process are value proposition, revenue model, target audience, personality.

Retention Rates Powerpoint Topics
This is a retention rates powerpoint topics. This is a three stage process. The stages in this process are retention rates, business objectives, revenue expansion.
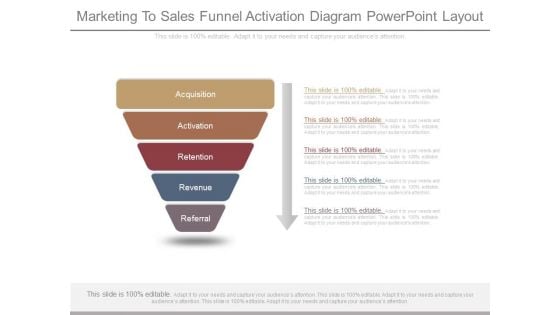
Marketing To Sales Funnel Activation Diagram Powerpoint Layout
This is a marketing to sales funnel activation diagram powerpoint layout. This is a five stage process. The stages in this process are acquisition, activation, retention, revenue, referral.
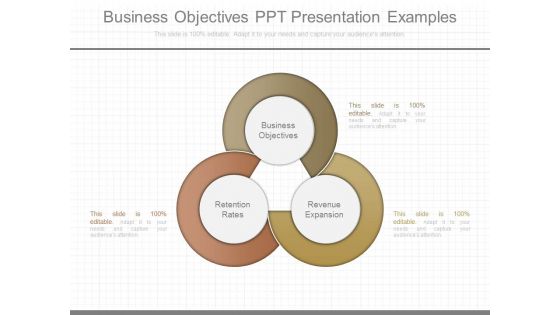
Business Objectives Ppt Presentation Examples
This is a business objectives ppt presentation examples. This is a three stage process. The stages in this process are business objectives, retention rates, revenue expansion.
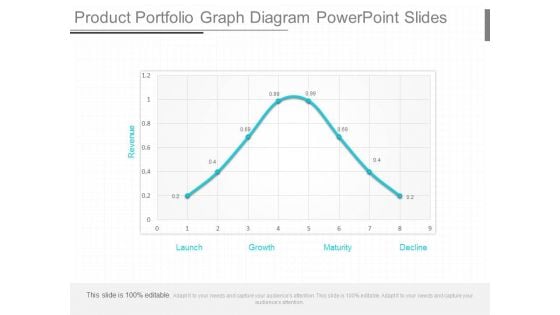
Product Portfolio Graph Diagram Powerpoint Slides
This is a product portfolio graph diagram powerpoint slides. This is a eight stage process. The stages in this process are revenue, launch, growth, maturity, decline.

Incremental Sales Kpi Measures Presentation Backgrounds
This is a incremental sales kpi measures presentation backgrounds. This is a four stage process. The stages in this process are marketing, promotion, sales revenue, social channels.
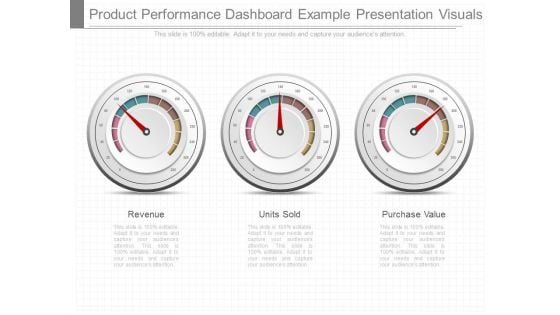
Product Performance Dashboard Example Presentation Visuals
This is a product performance dashboard example presentation visuals. This is a three stage process. The stages in this process are revenue, units sold, purchase value.
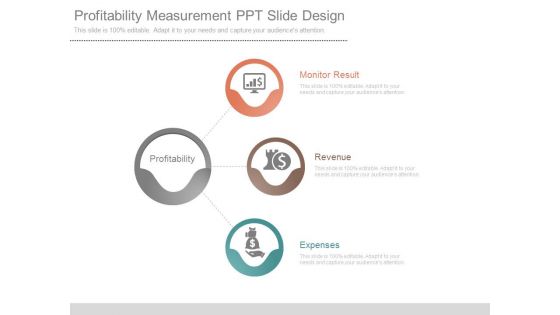
Profitability Measurement Ppt Slide Design
This is a profitability measurement ppt slide design. This is a three stage process. The stages in this process are profitability, monitor result, revenue, expenses.
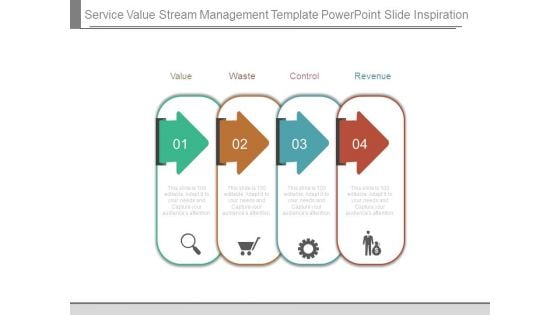
Service Value Stream Management Template Powerpoint Slide Inspiration
This is a service value stream management template powerpoint slide inspiration. This is a four stage process. The stages in this process are value, waste, control, revenue.

Acquirement Marketing Layout Powerpoint Slide Backgrounds
This is a acquirement marketing layout powerpoint slide backgrounds. This is a six stage process. The stages in this process are acquisition, activation, retention, revenue, buying, knowledge.
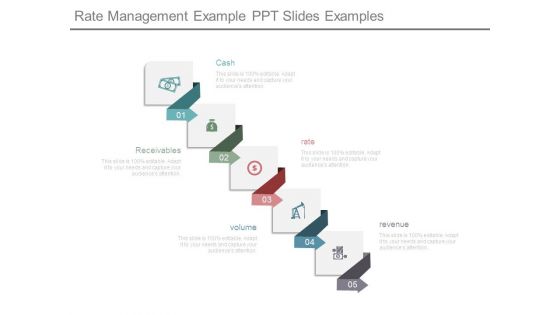
Rate Management Example Ppt Slides Examples
This is a rate management example ppt slides examples. This is a five stage process. The stages in this process are cash, receivables, rate, volume, revenue.
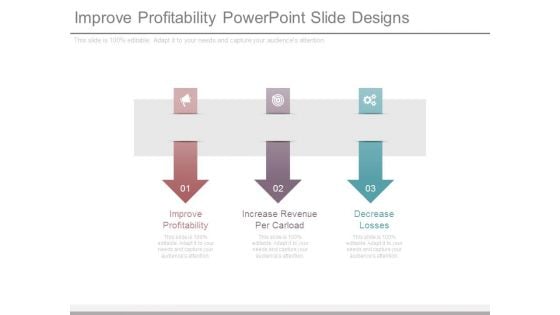
Improve Profitability Powerpoint Slide Designs
This is a improve profitability powerpoint slide designs. This is a three stage process. The stages in this process are improve profitability, increase revenue per carload, decrease losses.

Affiliate Marketing Example Powerpoint Slide Designs
This is a affiliate marketing example powerpoint slide designs. This is a five stage process. The stages in this process are getting traffic, revenue, market research, brand, affiliate.
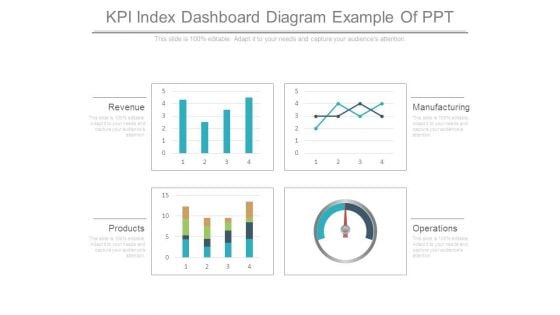
Kpi Index Dashboard Diagram Example Of Ppt
This is a kpi index dashboard diagram example of ppt. This is a four stage process. The stages in this process are revenue, products, operations, manufacturing.
Kpi Tracking Software Services Ppt Powerpoint Graphics
This is a kpi tracking software services ppt powerpoint graphics. This is a three stage process. The stages in this process are operations, revenue, manufacturing.
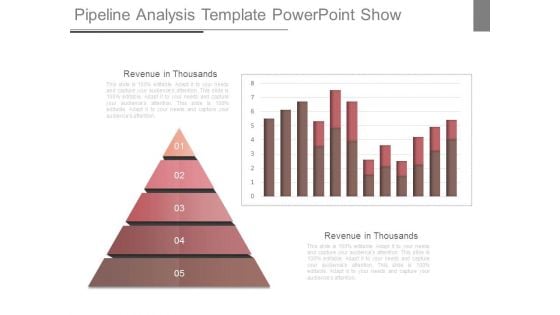
Pipeline Analysis Template Powerpoint Show
This is a pipeline analysis template powerpoint show. This is a five stage process. The stages in this process are revenue in thousands, pyramid, business.
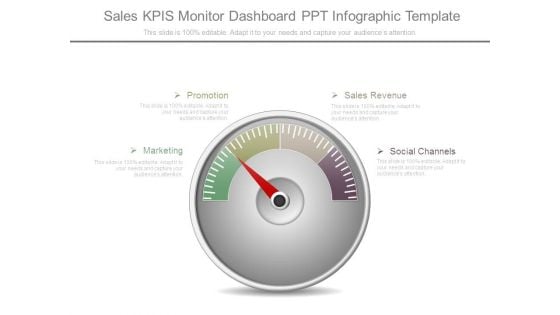
Sales Kpis Monitor Dashboard Ppt Infographic Template
This is a sales kpis monitor dashboard ppt infographic template. This is a one stage process. The stages in this process are promotion, marketing, sales revenue, social channels.
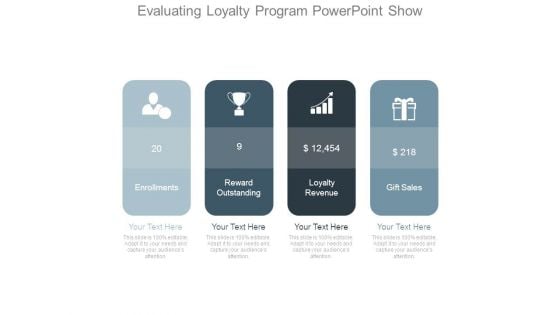
Evaluating Loyalty Program Powerpoint Show
This is a evaluating loyalty program powerpoint show. This is a four stage process. The stages in this process are enrollments, reward outstanding, loyalty revenue, gift sales.
Loyalty Program Metrics Ppt Icon
This is a loyalty program metrics ppt icon. This is a four stage process. The stages in this process are enrollments, reward outstanding, loyalty revenue, gift sales.
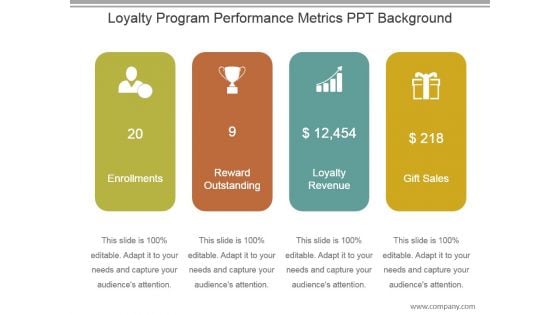
Loyalty Program Performance Metrics Ppt Background
This is a loyalty program performance metrics ppt background. This is a four stage process. The stages in this process are enrollments, reward outstanding, revenue, gift sales.
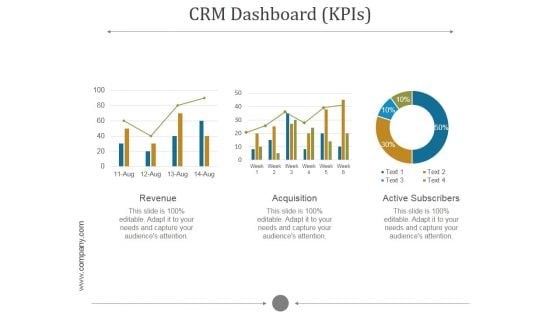
Crm Dashboard Kpis Ppt PowerPoint Presentation Pictures
This is a crm dashboard kpis ppt powerpoint presentation pictures. This is a five stage process. The stages in this process are revenue, acquisition, active subscribers.
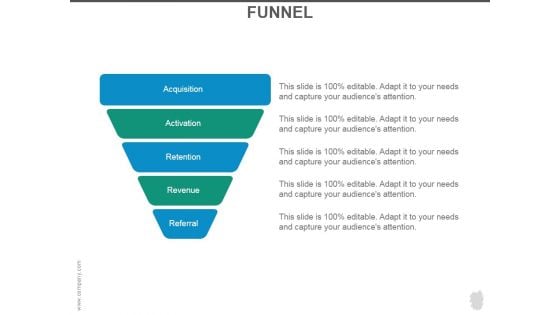
Funnel Ppt PowerPoint Presentation Infographics
This is a funnel ppt powerpoint presentation infographics. This is a five stage process. The stages in this process are acquisition, activation, retention, revenue, referral.
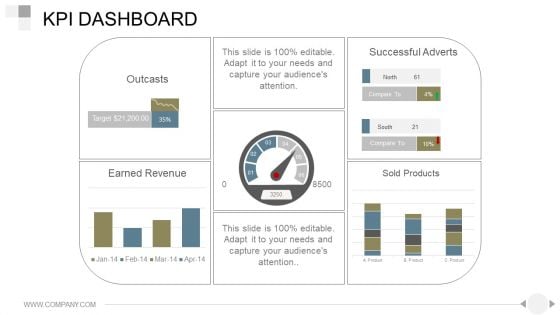
Kpi Dashboard Ppt PowerPoint Presentation Good
This is a kpi dashboard ppt powerpoint presentation good. This is a one stage process. The stages in this process are outcasts, earned revenue, successful adverts, sold products.
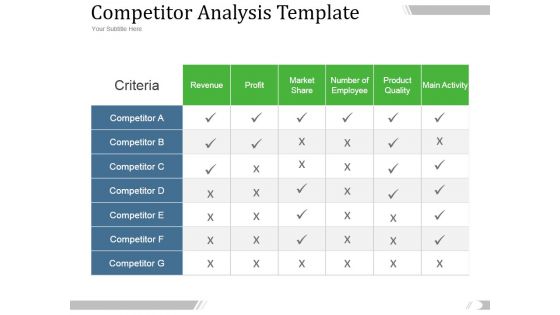
Competitor Analysis Template Ppt PowerPoint Presentation Designs
This is a competitor analysis template ppt powerpoint presentation designs. This is a six stage process. The stages in this process are profit, revenue, criteria, market share.
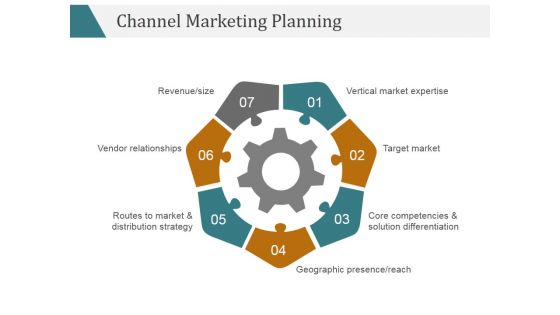
Channel Marketing Planning Ppt PowerPoint Presentation Microsoft
This is a channel marketing planning ppt powerpoint presentation microsoft. This is a seven stage process. The stages in this process are target market, vendor relationships, revenue size.
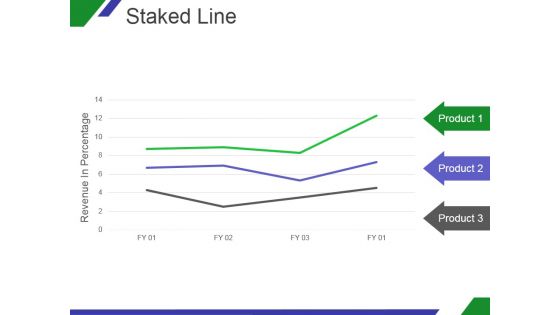
Staked Line Ppt PowerPoint Presentation Slide
This is a staked line ppt powerpoint presentation slide. This is a three stage process. The stages in this process are revenue in percentage, product, business.
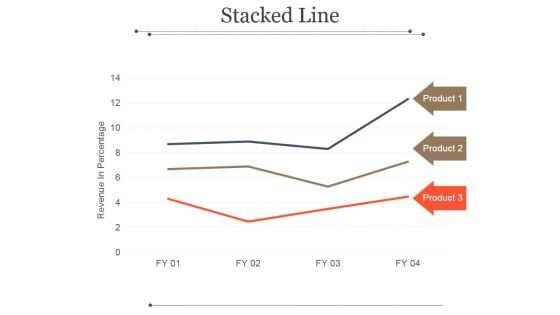
Stacked Line Ppt PowerPoint Presentation Guide
This is a stacked line ppt powerpoint presentation guide. This is a three stage process. The stages in this process are revenue in percentage, product.
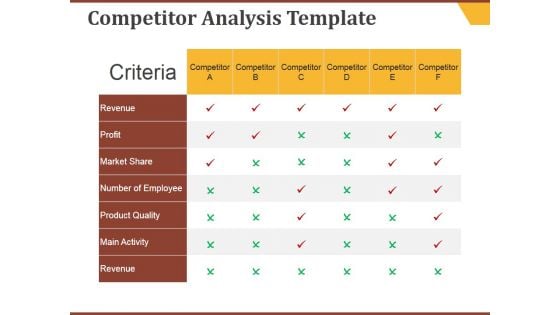
Competitor Analysis Template Ppt PowerPoint Presentation Inspiration
This is a competitor analysis template ppt powerpoint presentation inspiration. This is a six stage process. The stages in this process are revenue, profit, market share, competitor, criteria.
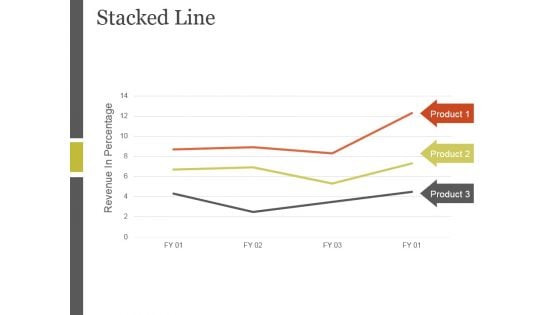
Stacked Line Ppt PowerPoint Presentation Inspiration
This is a stacked line ppt powerpoint presentation inspiration. This is a three stage process. The stages in this process are revenue in percentage, stacked line, product.
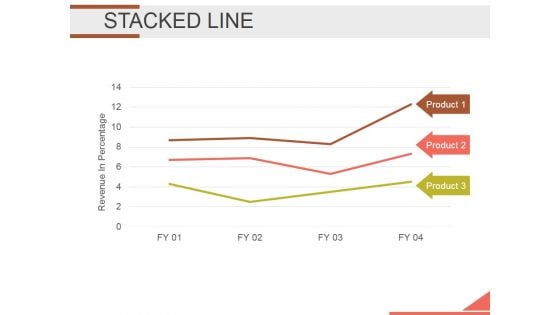
Stacked Line Ppt PowerPoint Presentation File Show
This is a stacked line ppt powerpoint presentation file show. This is a three stage process. The stages in this process are revenue in percentage, product.
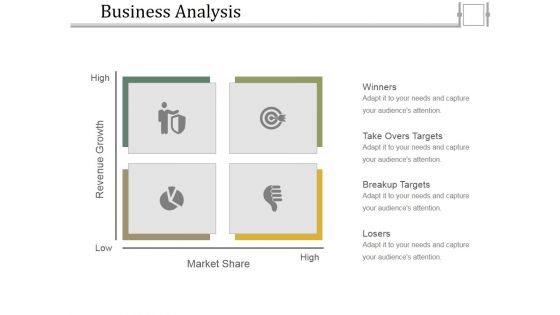
Business Analysis Ppt PowerPoint Presentation Professional Templates
This is a business analysis ppt powerpoint presentation professional templates. This is a four stage process. The stages in this process are high, low, market share, revenue growth.
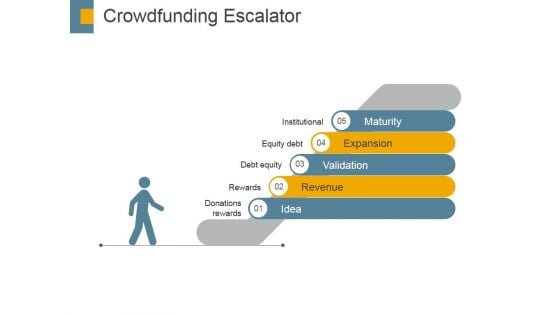
Crowdfunding Escalator Ppt PowerPoint Presentation Inspiration Design Ideas
This is a crowdfunding escalator ppt powerpoint presentation inspiration design ideas. This is a five stage process. The stages in this process are maturity, expansion, validation, revenue, idea.
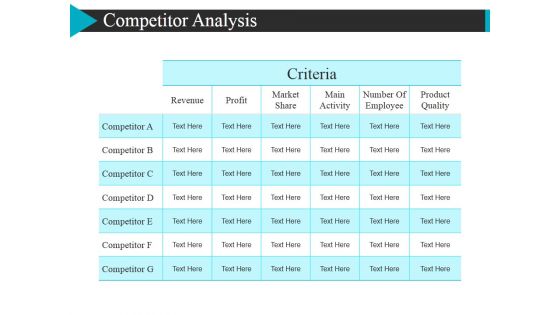
Competitor Analysis Ppt Powerpoint Presentation Pictures Graphics
This is a competitor analysis ppt powerpoint presentation pictures graphics. This is a six stage process. The stages in this process are revenue, market share, profit, main activity.
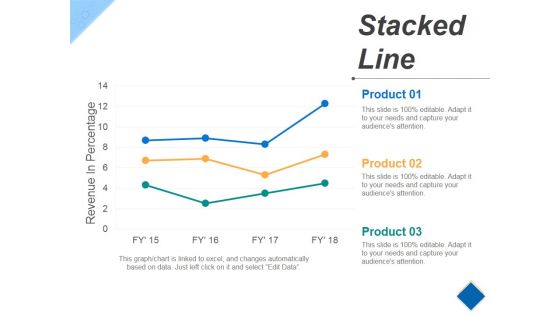
Stacked Line Ppt PowerPoint Presentation Pictures Maker
This is a stacked line ppt powerpoint presentation pictures maker. This is a three stage process. The stages in this process are revenue in percentage, growth, success, product.
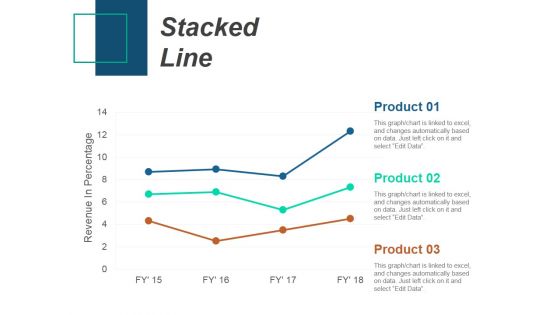
Stacked Line Ppt PowerPoint Presentation Infographics Slideshow
This is a stacked line ppt powerpoint presentation infographics slideshow. This is a three stage process. The stages in this process are stacked line, revenue in percentage, product.
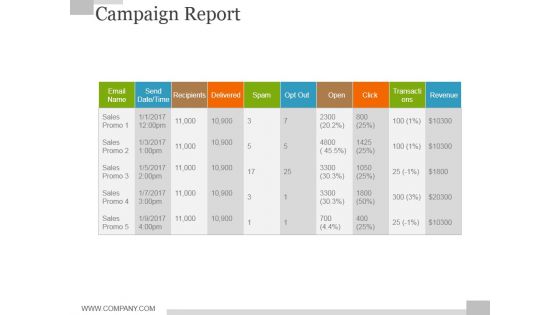
Campaign Report Ppt PowerPoint Presentation Show Tips
This is a campaign report ppt powerpoint presentation show tips. This is a five stage process. The stages in this process are spam, open, delivered, transactions, revenue.
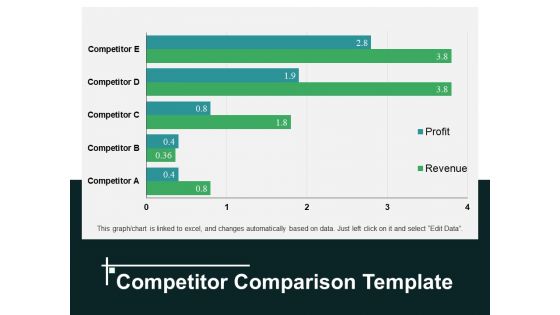
Competitor Comparison Template 1 Ppt PowerPoint Presentation Pictures Infographics
This is a competitor comparison template 1 ppt powerpoint presentation pictures infographics. This is a five stage process. The stages in this process are competitor, profit, revenue.
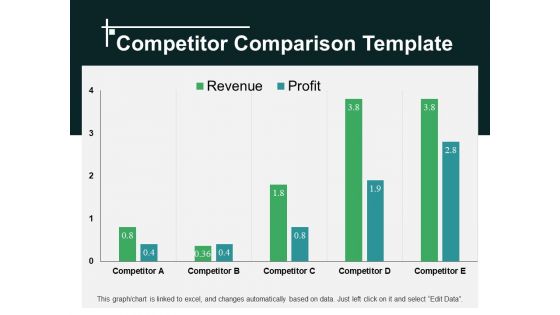
Competitor Comparison Template 2 Ppt PowerPoint Presentation Show Design Ideas
This is a competitor comparison template 2 ppt powerpoint presentation show design ideas. This is a four stage process. The stages in this process are competitor, profit, revenue.
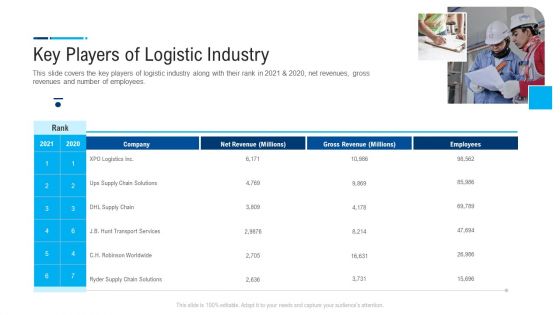
Internal And External Logistics Management Procedure Key Players Of Logistic Industry Introduction PDF
This slide covers the key players of logistic industry along with their rank in 2021 and 2020, net revenues, gross revenues and number of employees. Presenting internal and external logistics management procedure key players of logistic industry introduction pdf to provide visual cues and insights. Share and navigate important information on one stage that need your due attention. This template can be used to pitch topics like net revenue, gross revenue, employees. In addtion, this PPT design contains high resolution images, graphics, etc, that are easily editable and available for immediate download.
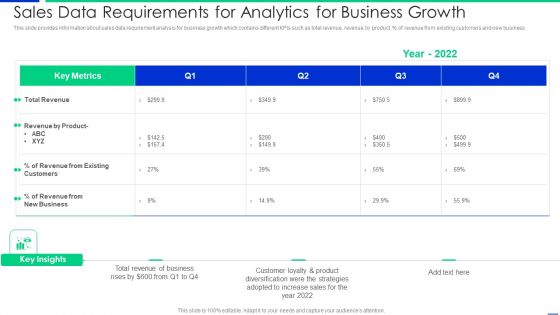
Sales Data Requirements For Analytics For Business Growth Information PDF
This slide provides information about sales data requirement analysis for business growth which contains different KPIs such as total revenue, revenue by product, percentage of revenue from existing customers and new business. Pitch your topic with ease and precision using this sales data requirements for analytics for business growth information pdf. This layout presents information on customers, revenue, business. It is also available for immediate download and adjustment. So, changes can be made in the color, design, graphics or any other component to create a unique layout.
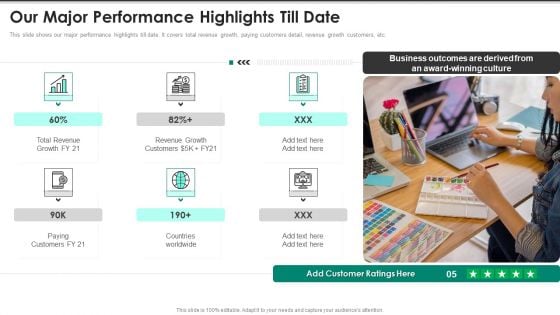
Website Interface And Application Development Firm Our Major Performance Highlights Inspiration PDF
This slide shows our major performance highlights till date. It covers total revenue growth, paying customers detail, revenue growth customers, etc. Presenting Website Interface And Application Development Firm Our Major Performance Highlights Inspiration PDF to provide visual cues and insights. Share and navigate important information on six stages that need your due attention. This template can be used to pitch topics like Total Revenue Growth, Revenue Growth Customers, Paying Customers Countries. In addtion, this PPT design contains high resolution images, graphics, etc, that are easily editable and available for immediate download.
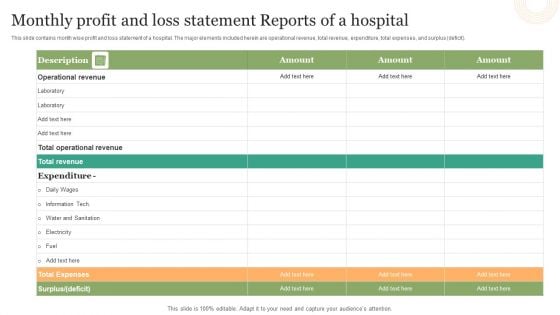
Monthly Profit And Loss Statement Reports Of A Hospital Background PDF
This slide contains month wise profit and loss statement of a hospital. The major elements included herein are operational revenue, total revenue, expenditure, total expenses, and surplus deficit.Showcasing this set of slides titled Monthly Profit And Loss Statement Reports Of A Hospital Background PDF. The topics addressed in these templates are Operational Revenue, Operational Revenue, Water Sanitation. All the content presented in this PPT design is completely editable. Download it and make adjustments in color, background, font etc. as per your unique business setting.
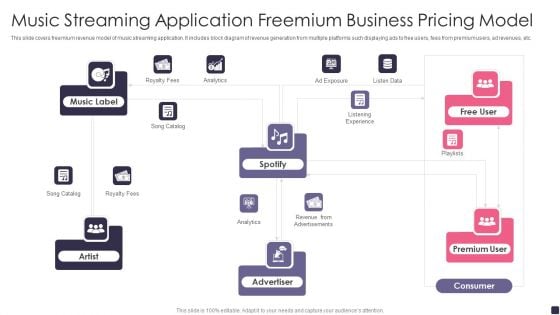
Music Streaming Application Freemium Business Pricing Model Microsoft PDF
This slide covers freemium revenue model of music streaming application. It includes block diagram of revenue generation from multiple platforms such displaying ads to free users, fees from premium users, ad revenues, etc. Pitch your topic with ease and precision using this Music Streaming Application Freemium Business Pricing Model Microsoft PDF. This layout presents information on Revenue Advertisements, Royalty Fees, Listening Experience. It is also available for immediate download and adjustment. So, changes can be made in the color, design, graphics or any other component to create a unique layout.
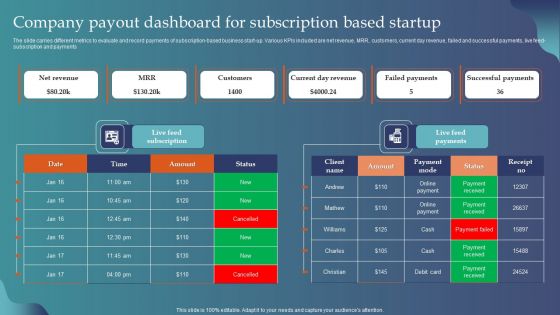
Company Payout Dashboard For Subscription Based Startup Designs PDF
The slide carries different metrics to evaluate and record payments of subscription-based business start-up. Various KPIs included are net revenue, MRR, customers, current day revenue, failed and successful payments, live feed- subscription and payments. Pitch your topic with ease and precision using this Company Payout Dashboard For Subscription Based Startup Designs PDF. This layout presents information on Net Revenue, MRR, Customers, Current Day Revenue. It is also available for immediate download and adjustment. So, changes can be made in the color, design, graphics or any other component to create a unique layout.
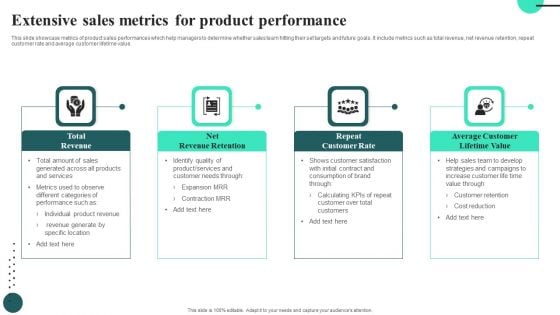
Extensive Sales Metrics For Product Performance Summary PDF
This slide showcase metrics of product sales performances which help managers to determine whether sales team hitting their set targets and future goals. It include metrics such as total revenue, net revenue retention, repeat customer rate and average customer lifetime value.Persuade your audience using this Extensive Sales Metrics For Product Performance Summary PDF. This PPT design covers four stages, thus making it a great tool to use. It also caters to a variety of topics including Total Revenue, Net Revenue Retention. Download this PPT design now to present a convincing pitch that not only emphasizes the topic but also showcases your presentation skills.
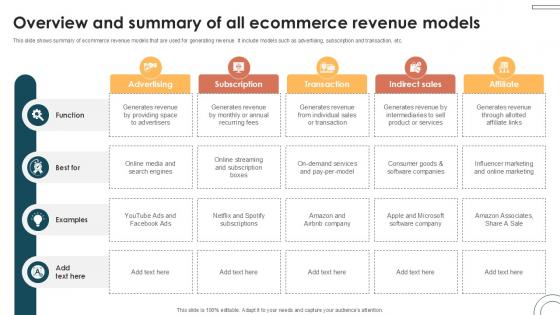
Overview And Summary Of All Internet Based Trade Structure Ppt Template
This slide shows summary of ecommerce revenue models that are used for generating revenue. It include models such as advertising, subscription and transaction, etc. Find a pre-designed and impeccable Overview And Summary Of All Internet Based Trade Structure Ppt Template. The templates can ace your presentation without additional effort. You can download these easy-to-edit presentation templates to make your presentation stand out from others. So, what are you waiting for Download the template from Slidegeeks today and give a unique touch to your presentation. This slide shows summary of ecommerce revenue models that are used for generating revenue. It include models such as advertising, subscription and transaction, etc.

Overview Of Transaction Fee Internet Based Trade Structure Ppt Slide
This slide shows summary of transaction fee revenue model for earning revenue and increasing profit margin. It include overview of model with strategies and benefits, etc. There are so many reasons you need a Overview Of Transaction Fee Internet Based Trade Structure Ppt Slide. The first reason is you can not spend time making everything from scratch, Thus, Slidegeeks has made presentation templates for you too. You can easily download these templates from our website easily. This slide shows summary of transaction fee revenue model for earning revenue and increasing profit margin. It include overview of model with strategies and benefits, etc.
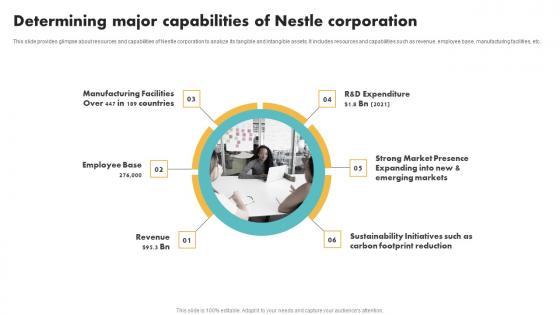
Determining Major Capabilities Of Nestle Corporation Customer Segmentation Inspiration Pdf
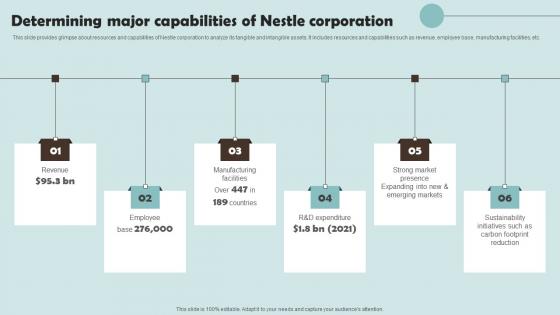
This slide provides glimpse about resources and capabilities of Nestle corporation to analyze its tangible and intangible assets. It includes resources and capabilities such as revenue, employee base, manufacturing facilities, etc. This modern and well-arranged Determining Major Capabilities Of Nestle Corporation Customer Segmentation Inspiration Pdf provides lots of creative possibilities. It is very simple to customize and edit with the Powerpoint Software. Just drag and drop your pictures into the shapes. All facets of this template can be edited with Powerpoint no extra software is necessary. Add your own material, put your images in the places assigned for them, adjust the colors, and then you can show your slides to the world, with an animated slide included. This slide provides glimpse about resources and capabilities of Nestle corporation to analyze its tangible and intangible assets. It includes resources and capabilities such as revenue, employee base, manufacturing facilities, etc.
Determining Major Capabilities Of Nestle Outline Of Nestle Management Information Pdf
This slide provides glimpse about resources and capabilities of Nestle corporation to analyze its tangible and intangible assets. It includes resources and capabilities such as revenue, employee base, manufacturing facilities, etc.Slidegeeks is here to make your presentations a breeze with Determining Major Capabilities Of Nestle Outline Of Nestle Management Information Pdf With our easy-to-use and customizable templates, you can focus on delivering your ideas rather than worrying about formatting. With a variety of designs to choose from, you are sure to find one that suits your needs. And with animations and unique photos, illustrations, and fonts, you can make your presentation pop. So whether you are giving a sales pitch or presenting to the board, make sure to check out Slidegeeks first. This slide provides glimpse about resources and capabilities of Nestle corporation to analyze its tangible and intangible assets. It includes resources and capabilities such as revenue, employee base, manufacturing facilities, etc.
Packaged Food Business Determining Major Capabilities Of Nestle Corporation Infographics Pdf
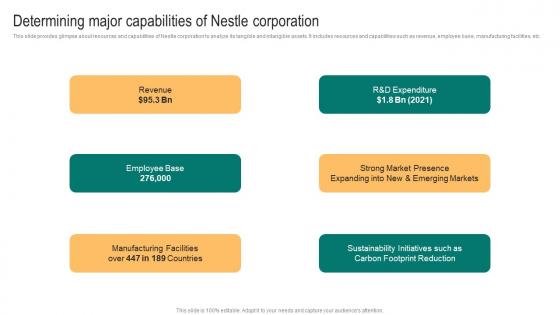
This slide provides glimpse about resources and capabilities of Nestle corporation to analyze its tangible and intangible assets. It includes resources and capabilities such as revenue, employee base, manufacturing facilities, etc. Find highly impressive Packaged Food Business Determining Major Capabilities Of Nestle Corporation Infographics Pdf on Slidegeeks to deliver a meaningful presentation. You can save an ample amount of time using these presentation templates. No need to worry to prepare everything from scratch because Slidegeeks experts have already done a huge research and work for you. You need to download Packaged Food Business Determining Major Capabilities Of Nestle Corporation Infographics Pdf for your upcoming presentation. All the presentation templates are 100 percent editable and you can change the color and personalize the content accordingly. Download now This slide provides glimpse about resources and capabilities of Nestle corporation to analyze its tangible and intangible assets. It includes resources and capabilities such as revenue, employee base, manufacturing facilities, etc.

Future User Statistics Of The Company After Implementing Offline Marketing Strategies Guidelines PDF
This slide shows the estimated future user statistics of the company after adopting Offline Marketing Strategies. These stats are related to sales revenue, churn rate, offline conversion rate, offline marketing ROI, customer satisfaction etc. from the years 2022 to 2024 along with key takeaways. Presenting future user statistics of the company after implementing offline marketing strategies guidelines pdf to provide visual cues and insights. Share and navigate important information on one stages that need your due attention. This template can be used to pitch topics like churn rate, sales revenue, offline conversion rate, offline marketing roi. In addtion, this PPT design contains high resolution images, graphics, etc, that are easily editable and available for immediate download.
Amazon Business Strategies To Gain Competitive Advantage Impressive Statistics Associated Designs PDF
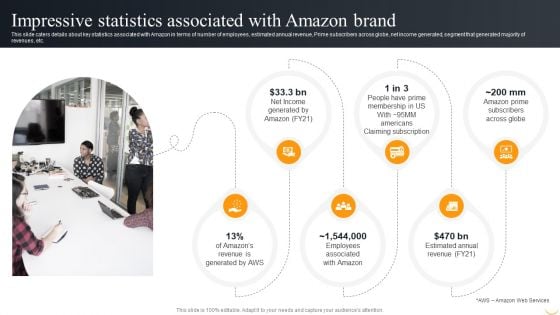
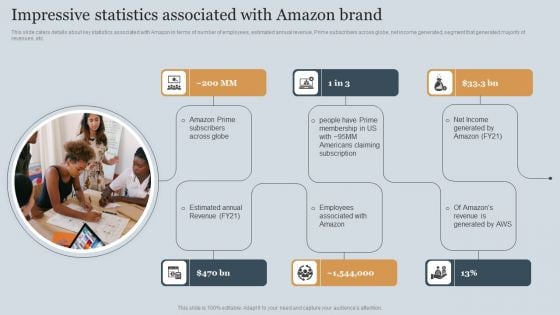
This slide caters details about key statistics associated with Amazon in terms of number of employees, estimated annual revenue, Prime subscribers across globe, net income generated, segment that generated majority of revenues, etc. Do you have to make sure that everyone on your team knows about any specific topic I yes, then you should give Amazon Business Strategies To Gain Competitive Advantage Impressive Statistics Associated Designs PDF a try. Our experts have put a lot of knowledge and effort into creating this impeccable Amazon Business Strategies To Gain Competitive Advantage Impressive Statistics Associated Designs PDF. You can use this template for your upcoming presentations, as the slides are perfect to represent even the tiniest detail. You can download these templates from the Slidegeeks website and these are easy to edit. So grab these today.
Impressive Statistics Associated With Amazon Brand Ppt PowerPoint Presentation File Layouts PDF
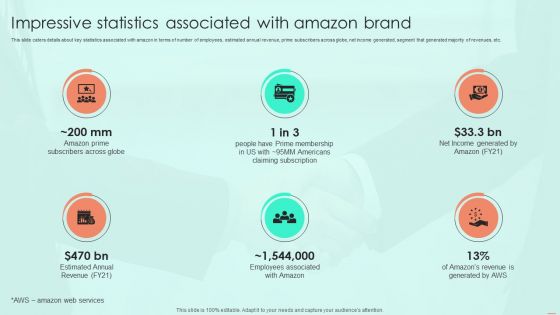
This slide caters details about key statistics associated with amazon in terms of number of employees, estimated annual revenue, prime subscribers across globe, net income generated, segment that generated majority of revenues, etc. If you are looking for a format to display your unique thoughts, then the professionally designed Impressive Statistics Associated With Amazon Brand Ppt PowerPoint Presentation File Layouts PDF is the one for you. You can use it as a Google Slides template or a PowerPoint template. Incorporate impressive visuals, symbols, images, and other charts. Modify or reorganize the text boxes as you desire. Experiment with shade schemes and font pairings. Alter, share or cooperate with other people on your work. Download Impressive Statistics Associated With Amazon Brand Ppt PowerPoint Presentation File Layouts PDF and find out how to give a successful presentation. Present a perfect display to your team and make your presentation unforgettable.
Amazons Business Success Story Strategic Plan Impressive Statistics Associated With Amazon Brand Brochure PDF
This slide caters details about key statistics associated with Amazon in terms of number of employees, estimated annual revenue, Prime subscribers across globe, net income generated, segment that generated majority of revenues, etc. Create an editable Amazons Business Success Story Strategic Plan Impressive Statistics Associated With Amazon Brand Brochure PDF that communicates your idea and engages your audience. Whether you are presenting a business or an educational presentation, pre-designed presentation templates help save time. Amazons Business Success Story Strategic Plan Impressive Statistics Associated With Amazon Brand Brochure PDF is highly customizable and very easy to edit, covering many different styles from creative to business presentations. Slidegeeks has creative team members who have crafted amazing templates. So, go and get them without any delay.
Business Connection Network Company Outline Executive Summary Template PDF
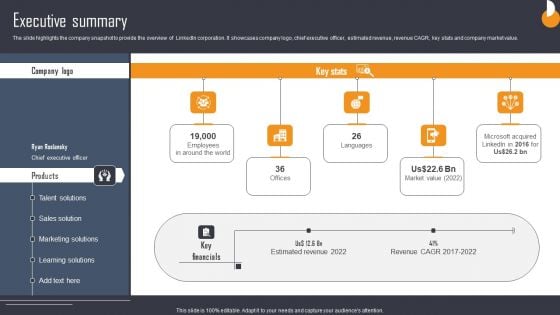
The slide highlights the company snapshot to provide the overview of LinkedIn corporation. It showcases company logo, chief executive officer, estimated revenue, revenue CAGR, key stats and company market value. Crafting an eye catching presentation has never been more straightforward. Let your presentation shine with this tasteful yet straightforward Business Connection Network Company Outline Executive Summary Template PDF template. It offers a minimalistic and classy look that is great for making a statement. The colors have been employed intelligently to add a bit of playfulness while still remaining professional. Construct the ideal Business Connection Network Company Outline Executive Summary Template PDF that effortlessly grabs the attention of your audience Begin now and be certain to wow your customers.
Impressive Statistics Associated With Amazon Brand Ppt PowerPoint Presentation File Diagrams PDF
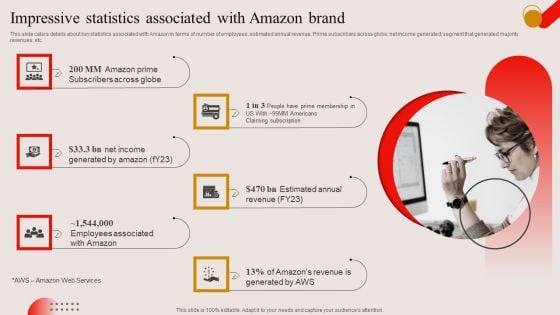
This slide caters details about key statistics associated with Amazon in terms of number of employees, estimated annual revenue, Prime subscribers across globe, net income generated, segment that generated majority revenues, etc. This Impressive Statistics Associated With Amazon Brand Ppt PowerPoint Presentation File Diagrams PDF is perfect for any presentation, be it in front of clients or colleagues. It is a versatile and stylish solution for organizing your meetings. The Impressive Statistics Associated With Amazon Brand Ppt PowerPoint Presentation File Diagrams PDF features a modern design for your presentation meetings. The adjustable and customizable slides provide unlimited possibilities for acing up your presentation. Slidegeeks has done all the homework before launching the product for you. So, do not wait, grab the presentation templates today


 Continue with Email

 Home
Home


