Financial Chart

Financial Ratios Chart Ppt PowerPoint Presentation Complete Deck With Slides
Pitch yourself both in house and outside by utilizing this complete deck. This financial ratios chart ppt powerpoint presentation complete deck with slides focuses on key fundamentals of the topic, displayed using different slides. With a total of fifteen slides, this template is the best tool you can use to persuade your audience. It will not only help you create great presentations but also induce strategic thinking because of its well researched content and graphics. You can easily personalize any of the elements to suit your unique business setting. Additionally, it can be saved in PNG, JPG, and PDF formats to save your time and resources.
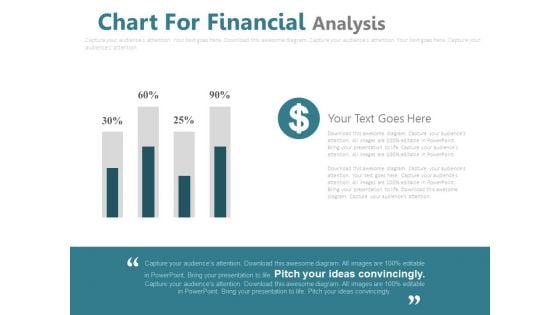
Chart For Financial Percentage Analysis Powerpoint Slides
This PowerPoint template has been designed with financial chart with dollar icon. This PPT slide may be used to display dollar value analysis chart. Download this slide to build unique presentation.
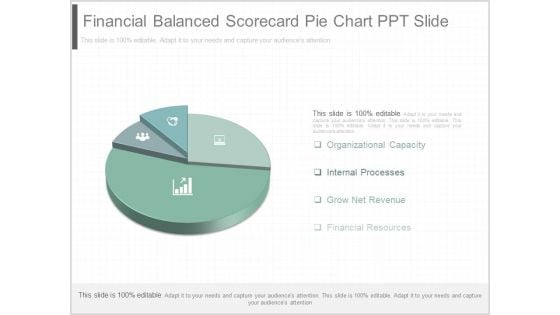
Financial Balanced Scorecard Pie Chart Ppt Slide
This is a financial balanced scorecard pie chart ppt slide. This is a four stage process. The stages in this process are organizational capacity, internal processes, grow net revenue, financial resources.
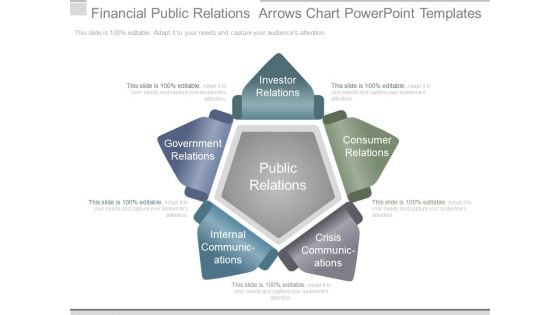
Financial Public Relations Arrows Chart Powerpoint Templates
This is a financial public relations arrows chart powerpoint templates. This is a five stage process. The stages in this process are investor relations, consumer relations, government relations, public relations, internal communications, crisis communications.
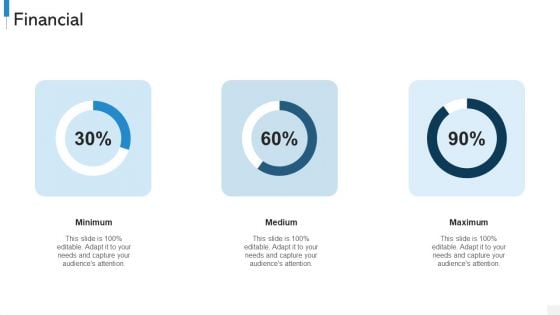
Agile Org Chart It Financial Mockup PDF
Deliver an awe inspiring pitch with this creative agile org chart it financial mockup pdf bundle. Topics like minimum, medium, maximum can be discussed with this completely editable template. It is available for immediate download depending on the needs and requirements of the user.
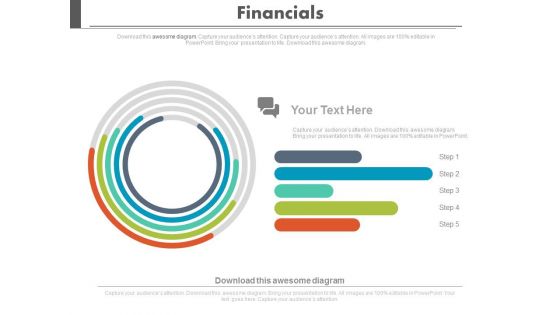
Financial Growth Analysis Circular Chart Powerpoint Slides
Visually support your presentation with our above template containing graphics of circular chart. This diagram slide helps to display financial growth analysis. Etch your views in the brains of your audience with this diagram slide.
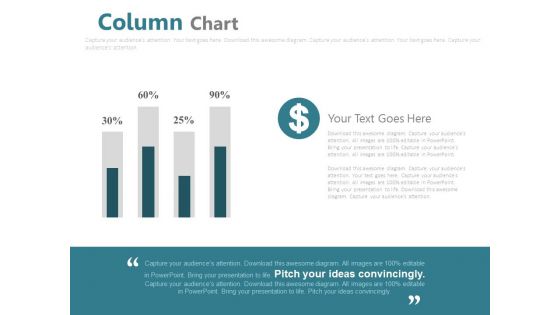
Column Chart For Financial Analysis Powerpoint Slides
This PowerPoint template has been designed with graphics of column chart with percentage values. You may use this business slide design for topics like financial analysis and planning. This PPT slide is powerful tool to describe your ideas.
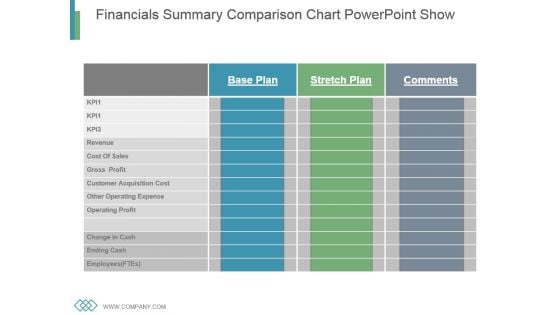
Financials Summary Comparison Chart Powerpoint Show
This is a financials summary comparison chart powerpoint show. This is a three stage process. The stages in this process are revenue, cost of sales, gross profit, customer acquisition cost, other operating cost expense, operating profit, change in cash, ending cash, employees.
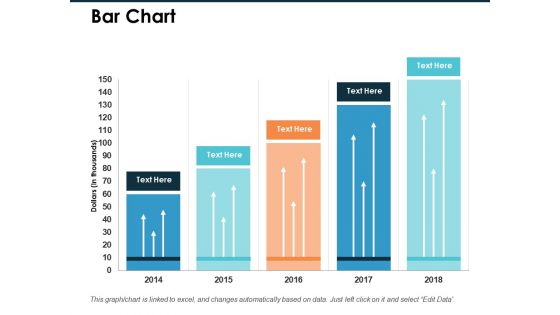
Bar Chart Financial Ppt PowerPoint Presentation Pictures Files
This is a bar chart financial ppt powerpoint presentation pictures files. This is a five stage process. The stages in this process are finance, marketing, management, investment, analysis.

Area Chart Financial Ppt PowerPoint Presentation Styles Templates
This is a area chart financial ppt powerpoint presentation styles templates. This is a two stage process. The stages in this process are finance, marketing, management, investment, analysis.
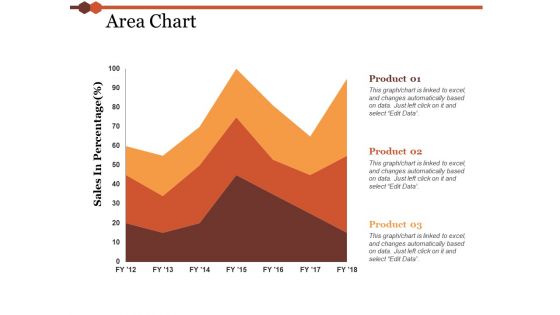
Area Chart Financial Ppt PowerPoint Presentation Layouts Slide
This is a area chart financial ppt powerpoint presentation layouts slide. This is a three stage process. The stages in this process are finance, marketing, management, investment, analysis.
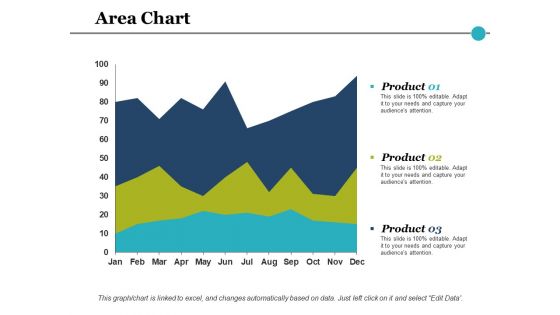
Area Chart Financial Ppt PowerPoint Presentation Inspiration Topics
This is a area chart financial ppt powerpoint presentation inspiration topics. This is a three stage process. The stages in this process are finance, marketing, management, investment, analysis.

Area Chart Financial Ppt PowerPoint Presentation Model Background
This is a area chart financial ppt powerpoint presentation model background. This is a two stage process. The stages in this process are finance, marketing, management, investment, analysis.

Combo Chart Financial Ppt PowerPoint Presentation Layouts Layouts
This is a combo chart financial ppt powerpoint presentation layouts layouts. This is a three stage process. The stages in this process are finance, marketing, management, investment, analysis.
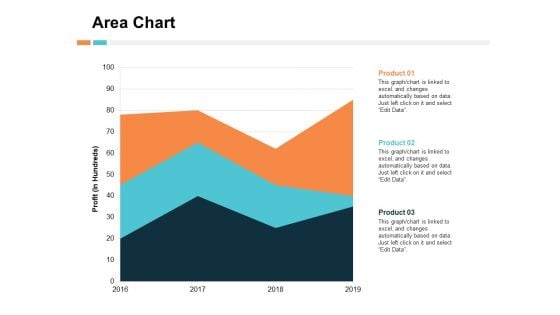
Area Chart Financial Ppt PowerPoint Presentation Outline Information
This is a area chart financial ppt powerpoint presentation outline information. This is a three stage process. The stages in this process are percentage, product, business, management, marketing.
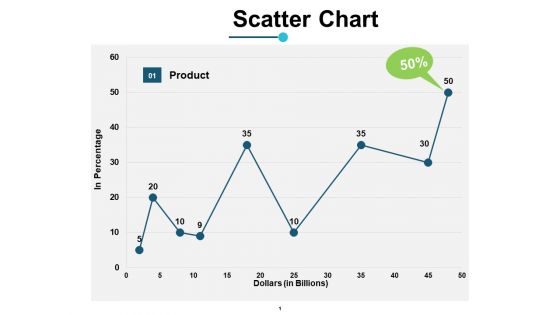
Scatter Chart Financial Ppt PowerPoint Presentation Model Deck
This is a scatter chart financial ppt powerpoint presentation model deck. This is a one stage process. The stages in this process are business, management, marketing, percentage, product.
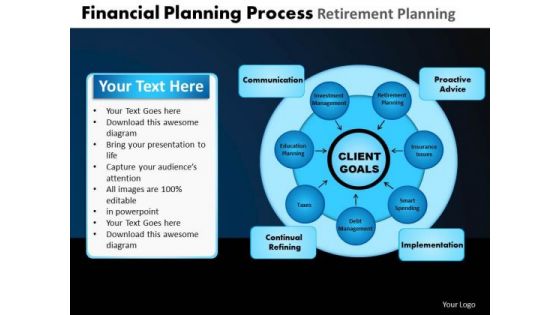
PowerPoint Design Slides Chart Financial Planning Ppt Template
Our PowerPoint Design Slides Chart Financial Planning Ppt Template are very falcon like. They keep a sharp eye on the target.
Financial Budget Spend Chart For Company Operations Icon Pictures PDF
Presenting Financial Budget Spend Chart For Company Operations Icon Pictures PDF to dispense important information. This template comprises Three stages. It also presents valuable insights into the topics including Financial Budget Spend, Chart For Company, Operations Icon. This is a completely customizable PowerPoint theme that can be put to use immediately. So, download it and address the topic impactfully.

Financial Information Systems Chart Example Of Ppt Presentation
This is a financial information systems chart example of ppt presentation. This is a three stage process. The stages in this process are process, people, value, technology.
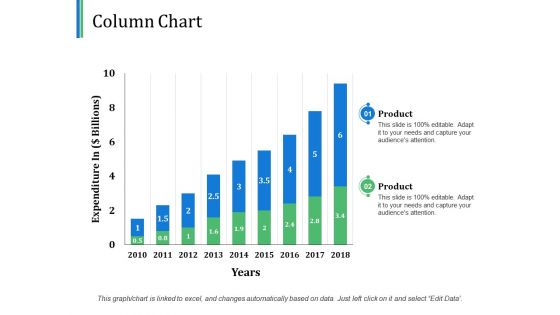
Column Chart Financial Ppt PowerPoint Presentation Outline Design Templates
This is a column chart financial ppt powerpoint presentation outline design templates. This is a two stage process. The stages in this process are financial, business, marketing, planning, strategy.
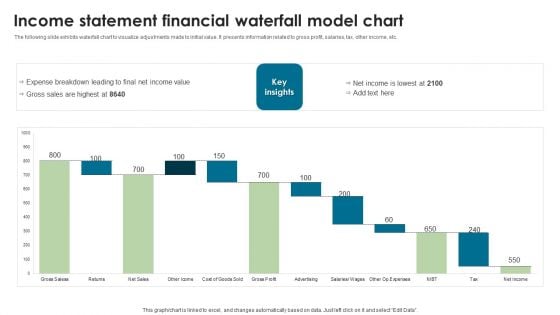
Income Statement Financial Waterfall Model Chart Elements PDF
The following slide exhibits waterfall chart to visualize adjustments made to initial value. It presents information related to gross profit, salaries, tax, other income, etc. Showcasing this set of slides titled Income Statement Financial Waterfall Model Chart Elements PDF. The topics addressed in these templates are Income, Statement Financial, Model Chart. All the content presented in this PPT design is completely editable. Download it and make adjustments in color, background, font etc. as per your unique business setting.
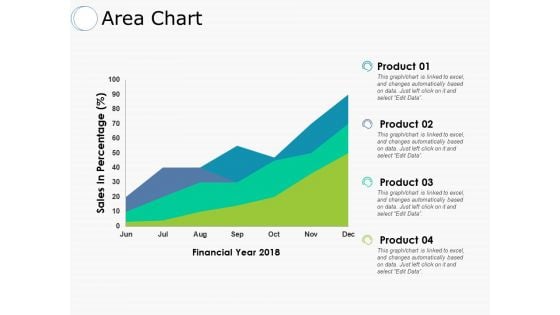
Area Chart Financial Ppt PowerPoint Presentation Outline Professional
This is a area chart financial ppt powerpoint presentation outline professional. This is a four stage process. The stages in this process are product, sales in percentage, financial year.
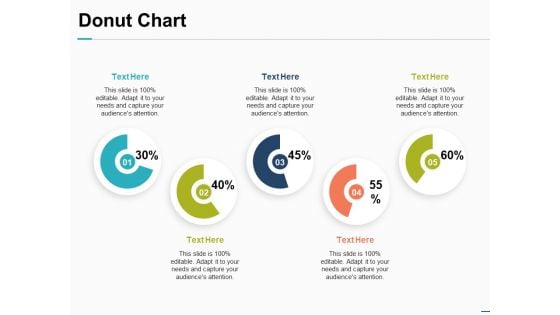
Donut Chart Financial Investment Ppt PowerPoint Presentation Inspiration Introduction
This is a donut chart financial investment ppt powerpoint presentation inspiration introduction. This is a five stage process. The stages in this process are finance, marketing, management, investment, analysis.
Business Chart Financial PowerPoint Templates And PowerPoint Backgrounds 0411
Microsoft PowerPoint Template and Background with business graph at chart is going up for success Change the face of thinking in your company. Our Business Chart Financial PowerPoint Templates And PowerPoint Backgrounds 0411 will exhibit your expertise.
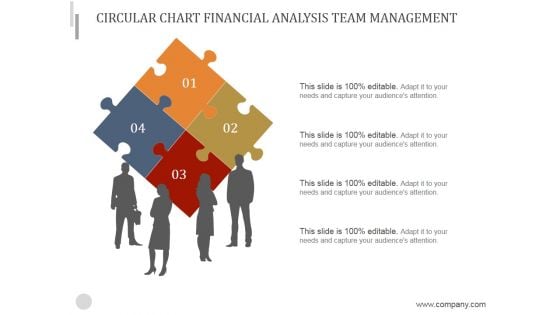
Circular Chart Financial Analysis Team Management Ppt PowerPoint Presentation Guide
This is a circular chart financial analysis team management ppt powerpoint presentation guide. This is a four stage process. The stages in this process are puzzle, teamwork, business, marketing, analysis.
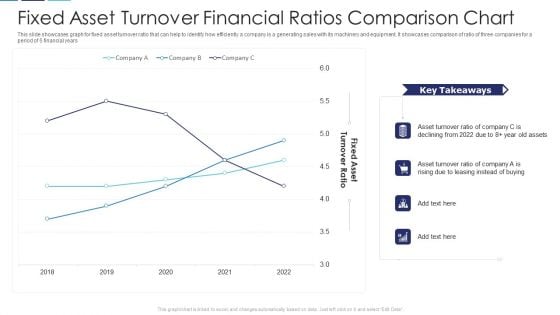
Fixed Asset Turnover Financial Ratios Comparison Chart Structure PDF
This slide showcases graph for fixed asset turnover ratio that can help to identify how efficiently a company is a generating sales with its machinery and equipment. It showcases comparison of ratio of three companies for a period of 5 financial years Showcasing this set of slides titled fixed asset turnover financial ratios comparison chart structure pdf. The topics addressed in these templates are fixed asset turnover financial ratios comparison chart. All the content presented in this PPT design is completely editable. Download it and make adjustments in color, background, font etc. as per your unique business setting.
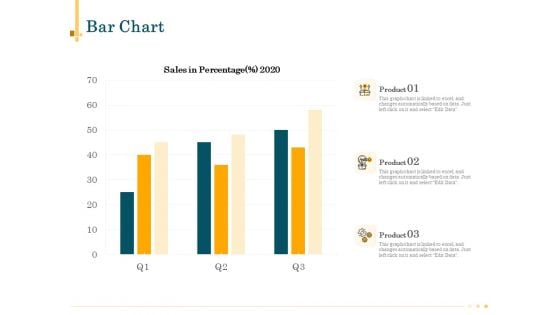
Outsource Bookkeeping Service Manage Financial Transactions Bar Chart Inspiration PDF
Presenting this set of slides with name outsource bookkeeping service manage financial transactions bar chart inspiration pdf. The topics discussed in these slide is bar chart. This is a completely editable PowerPoint presentation and is available for immediate download. Download now and impress your audience.
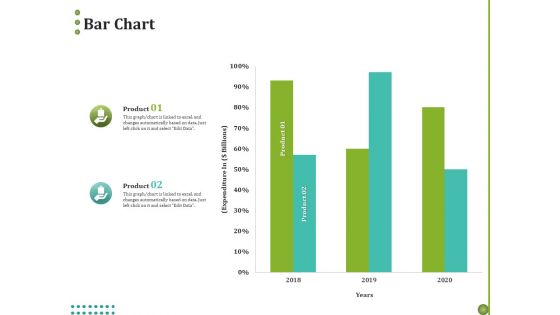
BPO For Managing Enterprise Financial Transactions Bar Chart Topics PDF
Presenting this set of slides with name bpo for managing enterprise financial transactions bar chart topics pdf. The topics discussed in these slide is bar chart. This is a completely editable PowerPoint presentation and is available for immediate download. Download now and impress your audience.
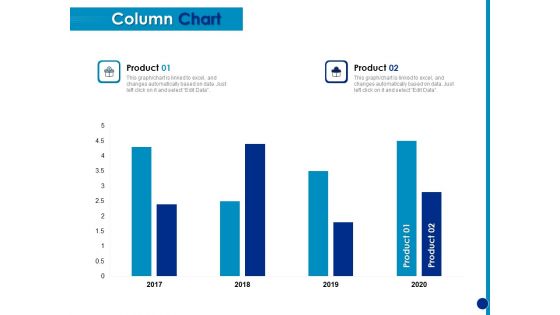
Generating Financial Support Column Chart Ppt Ideas Mockup PDF
Presenting this set of slides with name generating financial support column chart ppt ideas mockup pdf. The topics discussed in these slide is column chart. This is a completely editable PowerPoint presentation and is available for immediate download. Download now and impress your audience.

BPO For Managing Enterprise Financial Transactions Area Chart Brochure PDF
Presenting this set of slides with name bpo for managing enterprise financial transactions area chart brochure pdf. The topics discussed in these slide is area chart. This is a completely editable PowerPoint presentation and is available for immediate download. Download now and impress your audience.
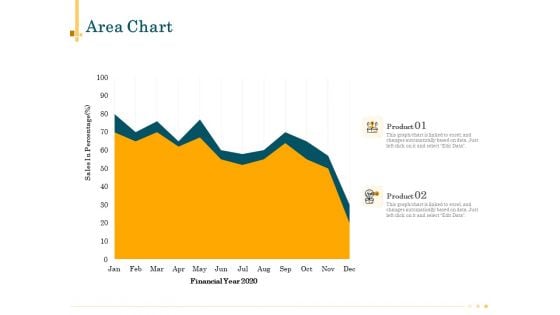
Outsource Bookkeeping Service Manage Financial Transactions Area Chart Sample PDF
Presenting this set of slides with name outsource bookkeeping service manage financial transactions area chart sample pdf. The topics discussed in these slide is area chart. This is a completely editable PowerPoint presentation and is available for immediate download. Download now and impress your audience.
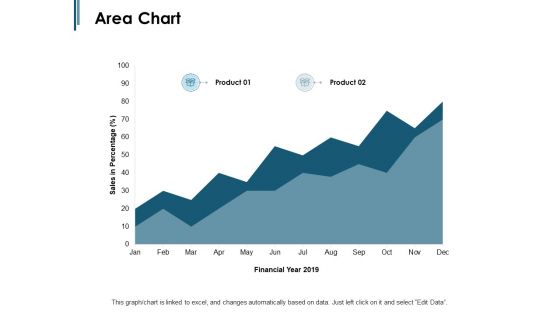
Area Chart Financial Year Ppt PowerPoint Presentation Styles Mockup
Presenting this set of slides with name area chart financial year ppt powerpoint presentation styles mockup. The topics discussed in these slides are finance, marketing, management, investment, analysis. This is a completely editable PowerPoint presentation and is available for immediate download. Download now and impress your audience.
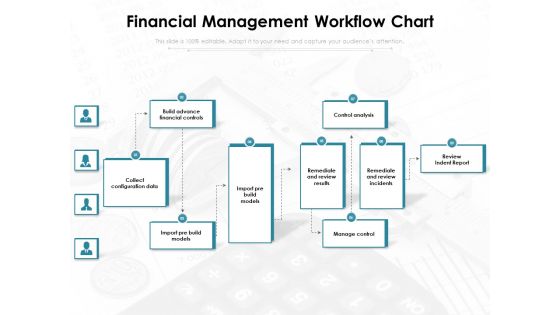
Financial Management Workflow Chart Ppt PowerPoint Presentation Infographics Mockup PDF
Presenting this set of slides with name financial management workflow chart ppt powerpoint presentation infographics mockup pdf. This is a nine stage process. The stages in this process are build advance financial controls, control analysis review, indent report remediate and review incidents, remediate and review results, import pre build models, import pre build models, collect configuration data, manage control. This is a completely editable PowerPoint presentation and is available for immediate download. Download now and impress your audience.
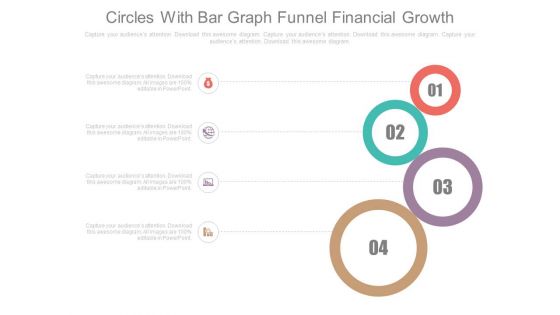
Four Circles Chart Financial Growth Steps Powerpoint Slides
Our professionally designed business diagram is as an effective tool for communicating cyclic processes. It contains circular graphics with icons. Above slide is suitable to display process management steps.
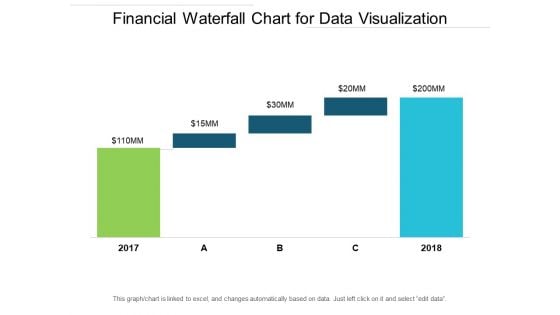
Financial Waterfall Chart For Data Visualization Ppt PowerPoint Presentation Ideas Elements
This is a financial waterfall chart for data visualization ppt powerpoint presentation ideas elements. This is a five stage process. The stages in this process are sales waterfall, waterfall chart, business.

Financial Pie Chart For Marketing PowerPoint Templates Ppt Backgrounds For Slides 0513
Transfer the dossier onto our Financial Pie Chart For Marketing PowerPoint Templates PPT Backgrounds For Slides. Share your views on an open platform. Double the impact with our marketing PowerPoint Templates. Your thoughts will have an imposing effect. Knead the dough with our pie charts PowerPoint Templates. Your thoughts will come up well. Our Financial Pie Chart For Marketing PowerPoint Templates Ppt Backgrounds For Slides 0513 are really captivating. The audience will not take their eyes off you.

Financial Growth Chart For Business PowerPoint Templates Ppt Backgrounds For Slides 0713
Double your chances with our Financial Growth Chart For Business PowerPoint Templates PPT Backgrounds For Slides. The value of your thoughts will increase two-fold. Charm the audience with your thoughts. Add our Pie Charts PowerPoint Templates and they will be dotty for you. Double up our Business PowerPoint Templates with your thoughts. They will make an awesome pair. Overcome doubts with our Financial Growth Chart For Business PowerPoint Templates Ppt Backgrounds For Slides 0713. You will come out on top.
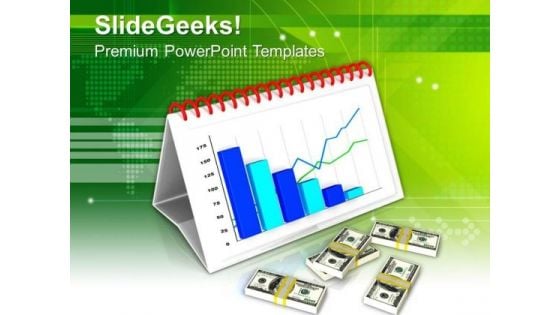
Monthly Financial Growth Chart PowerPoint Templates Ppt Backgrounds For Slides 0713
Give them a dose of your ability. It will go down well with our Monthly Financial Growth Chart PowerPoint Templates PPT Backgrounds For Slides. Connect the dots with our Business PowerPoint Templates. Watch the whole picture clearly emerge. Dot your thoughts with our Money PowerPoint Templates. Give your demeanour that Propah look. Structure your thoughts with our Monthly Financial Growth Chart PowerPoint Templates Ppt Backgrounds For Slides 0713. Download without worries with our money back guaranteee.
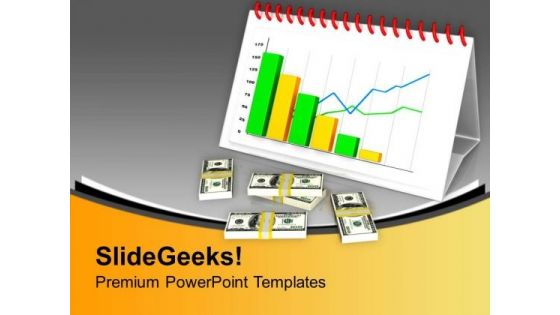
Financial Growth Chart With Fluctuation PowerPoint Templates Ppt Backgrounds For Slides 0513
Transfer the dossier onto our Financial Growth Chart With Fluctuation PowerPoint Templates PPT Backgrounds For Slides. Share your views on an open platform. Double the impact with our money PowerPoint Templates. Your thoughts will have an imposing effect. Knead the dough with our finance PowerPoint Templates. Your thoughts will come up well. Our Financial Growth Chart With Fluctuation PowerPoint Templates Ppt Backgrounds For Slides 0513 are empowering agents. Your thoughts will create the correct chemistry.
Manager Analyzing Trends From Financial Modelling Chart Vector Icon Portrait PDF
Persuade your audience using this manager analyzing trends from financial modelling chart vector icon portrait pdf. This PPT design covers three stages, thus making it a great tool to use. It also caters to a variety of topics including manager analyzing trends from financial modelling chart vector icon. Download this PPT design now to present a convincing pitch that not only emphasizes the topic but also showcases your presentation skills.
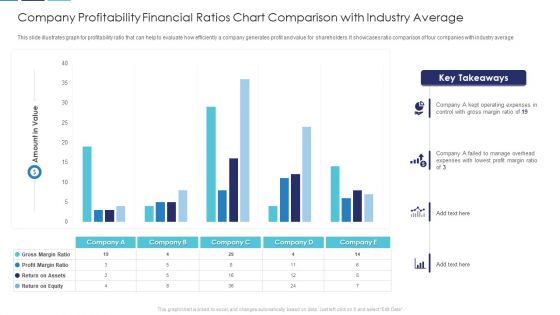
Company Profitability Financial Ratios Chart Comparison With Industry Average Download PDF
This slide illustrates graph for profitability ratio that can help to evaluate how efficiently a company generates profit and value for shareholders. It showcases ratio comparison of four companies with industry average Showcasing this set of slides titled company profitability financial ratios chart comparison with industry average download pdf. The topics addressed in these templates are company profitability financial ratios chart comparison with industry average. All the content presented in this PPT design is completely editable. Download it and make adjustments in color, background, font etc. as per your unique business setting.
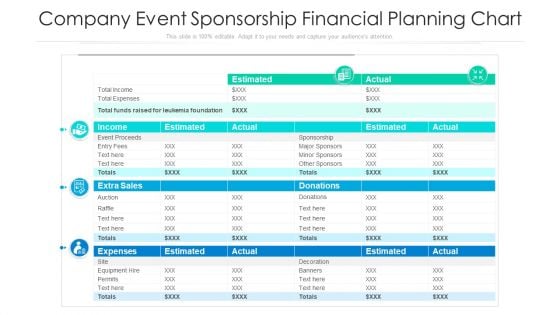
Company Event Sponsorship Financial Planning Chart Ppt PowerPoint Presentation File Example Introduction PDF
Showcasing this set of slides titled company event sponsorship financial planning chart ppt powerpoint presentation file example introduction pdf. The topics addressed in these templates are income, sales, expenses. All the content presented in this PPT design is completely editable. Download it and make adjustments in color, background, font etc. as per your unique business setting.
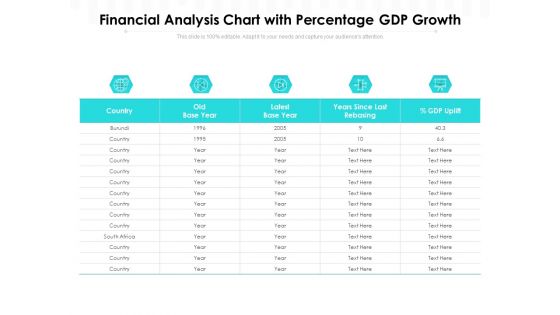
Financial Analysis Chart With Percentage GDP Growth Ppt PowerPoint Presentation Show Microsoft PDF
Presenting this set of slides with name financial analysis chart with percentage gdp growth ppt powerpoint presentation show microsoft pdf. The topics discussed in these slides are country, old base year, latest base year, years since last rebasing, gdp uplift. This is a completely editable PowerPoint presentation and is available for immediate download. Download now and impress your audience.
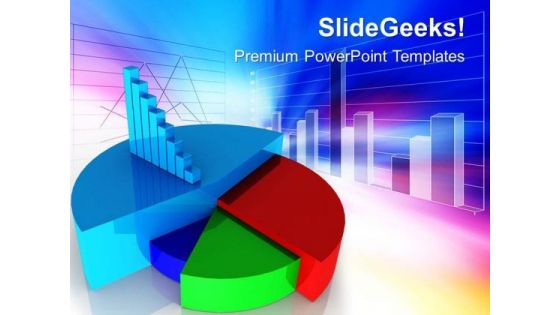
Financial Pie Chart Business Marketing Strategy PowerPoint Templates Ppt Backgrounds For Slides 0313
We present our Financial Pie Chart Business Marketing Strategy PowerPoint Templates PPT Backgrounds For Slides 0313.Download and present our Marketing PowerPoint Templates because Our PowerPoint Templates and Slides will generate and maintain the level of interest you desire. They will create the impression you want to imprint on your audience. Download and present our Business PowerPoint Templates because Our PowerPoint Templates and Slides will steer your racing mind. Hit the right buttons and spur on your audience. Download and present our Pie Charts PowerPoint Templates because Timeline crunches are a fact of life. Meet all deadlines using our PowerPoint Templates and Slides. Use our Marketing PowerPoint Templates because Watching this your Audience will Grab their eyeballs, they wont even blink. Present our Success PowerPoint Templates because Your success is our commitment. Our PowerPoint Templates and Slides will ensure you reach your goal.Use these PowerPoint slides for presentations relating to Business financial pie chart, marketing, business, pie charts, marketing, success. The prominent colors used in the PowerPoint template are Red, Green, Blue light. Hand your team the perfect strategy with our Financial Pie Chart Business Marketing Strategy PowerPoint Templates Ppt Backgrounds For Slides 0313. Try us out and see what a difference our templates make.
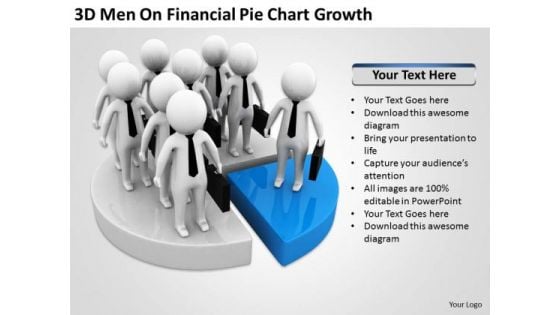
Men In Business On Financial Pie Chart Growth PowerPoint Templates Ppt Backgrounds For Slides
We present our men in business on financial pie chart growth PowerPoint templates PPT backgrounds for slides.Download and present our People PowerPoint Templates because Our PowerPoint Templates and Slides offer you the needful to organise your thoughts. Use them to list out your views in a logical sequence. Download and present our Finance PowerPoint Templates because You can Zap them with our PowerPoint Templates and Slides. See them reel under the impact. Present our Business PowerPoint Templates because You can Create a matrix with our PowerPoint Templates and Slides. Feel the strength of your ideas click into place. Download and present our Marketing PowerPoint Templates because Our PowerPoint Templates and Slides will let your team Walk through your plans. See their energy levels rise as you show them the way. Download and present our Success PowerPoint Templates because You can Bait your audience with our PowerPoint Templates and Slides. They will bite the hook of your ideas in large numbers.Use these PowerPoint slides for presentations relating to 3d, business, character, chart, colorful, concept, data, diagram, document, figure, finance, financial, four, global, graphic, growth, human, icon, idea, information, investment, isolated, leadership, man, market, marketing, number, part, people, person, pie, plan, presentation, progress, report icon, results, rise, shape, shiny, sign, small, solution, statistic, up, white. The prominent colors used in the PowerPoint template are Blue, Gray, Black. PowerPoint presentation experts tell us our men in business on financial pie chart growth PowerPoint templates PPT backgrounds for slides are specially created by a professional team with vast experience. They diligently strive to come up with the right vehicle for your brilliant Ideas. People tell us our character PowerPoint templates and PPT Slides are effectively colour coded to prioritise your plans They automatically highlight the sequence of events you desire. We assure you our men in business on financial pie chart growth PowerPoint templates PPT backgrounds for slides effectively help you save your valuable time. We assure you our diagram PowerPoint templates and PPT Slides will save the presenter time. Presenters tell us our men in business on financial pie chart growth PowerPoint templates PPT backgrounds for slides will save the presenter time. Use our colorful PowerPoint templates and PPT Slides are the best it can get when it comes to presenting. Convincing others can be an exacting business. Address their doubts with our Men In Business On Financial Pie Chart Growth PowerPoint Templates Ppt Backgrounds For Slides.
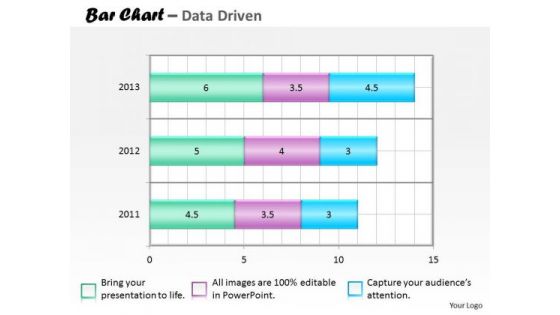
Financial Data Analysis Bar Chart For Collection Of PowerPoint Templates
Our financial data analysis bar chart for collection of Powerpoint Templates Team Are A Dogged Lot. They Keep At It Till They Get It Right.
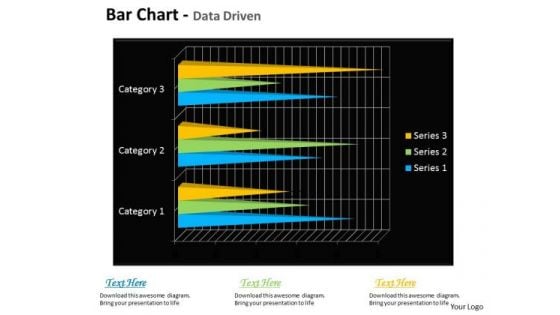
Quantitative Data Analysis Bar Chart For Financial Markets PowerPoint Templates
Draft It Out On Our quantitative data analysis bar chart for financial markets Powerpoint Templates . Give The Final Touches With Your Ideas.
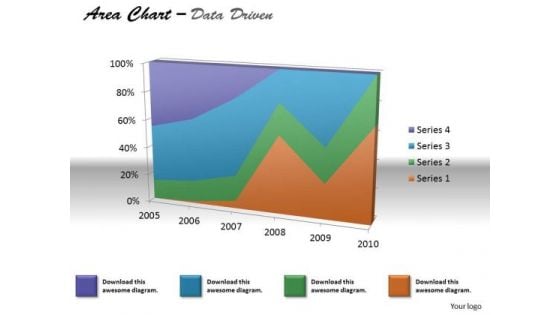
Financial Data Analysis Area Chart For Various Values PowerPoint Templates
Document The Process On Our financial data analysis area chart for various values Powerpoint Templates . Make A Record Of Every Detail.
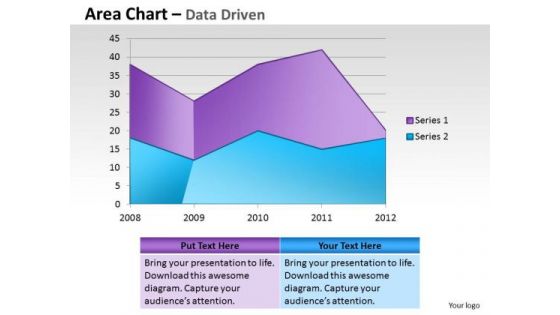
Financial Data Analysis Area Chart For Showing Trends PowerPoint Templates
Document Your Views On Our financial data analysis area chart for showing trends Powerpoint Templates . They Will Create A Strong Impression.
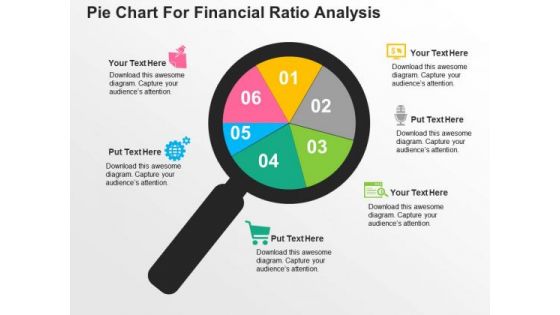
Pie Chart For Financial Ratio Analysis PowerPoint Template
Deliver amazing presentations with our above template showing pie chart. You may download this slide to display financial ratio analysis. Capture the attention of your audience using this diagram.
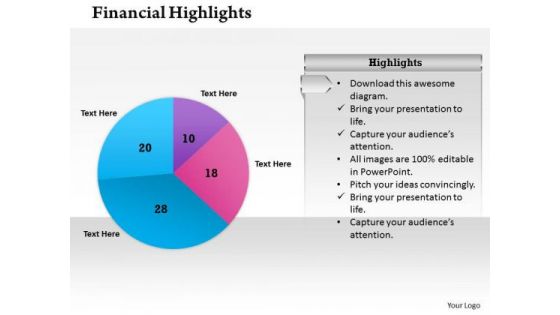
Sales Diagram Pie Chart For Financial Result Business Diagram
Knock On The Door To Success With Our Sales Diagram Pie Chart For Financial Result Business Diagram Powerpoint Templates. Be Assured Of Gaining Entry. Give Them A Dose Of Your Ability. It Will Go Down Well With Our Sales Diagram Pie Chart For Financial Result Business Diagram Powerpoint Templates.
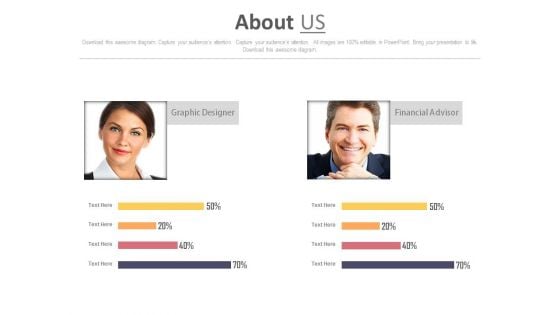
Graphic Designer And Financial Advisor Skill Assessment Chart Powerpoint Slides
The PowerPoint template has been designed with graphic designer and financial advisor skill assessment chart. Use this about us page to tell the story of your company.
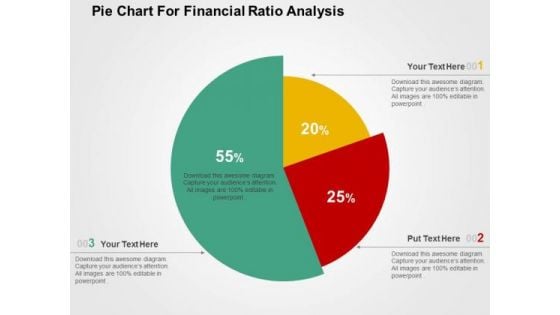
Pie Chart For Financial Ratio Analysis PowerPoint Templates
Create visually amazing presentations with this slide of pie chart. This PPT slide of pie chart for financial ratio analysis. Add this diagram in your presentations to visually support your content.
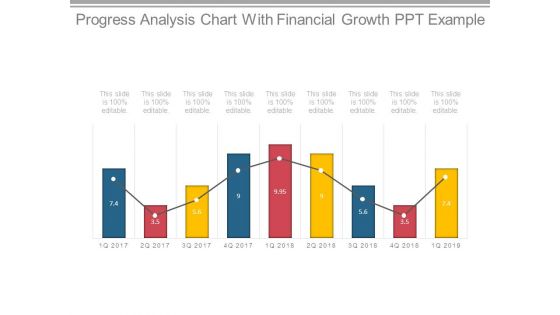
Progress Analysis Chart With Financial Growth Ppt Example
This is a progress analysis chart with financial growth ppt example. This is a nine stage process. The stages in this process are chart, years, business, growth, marketing, management.
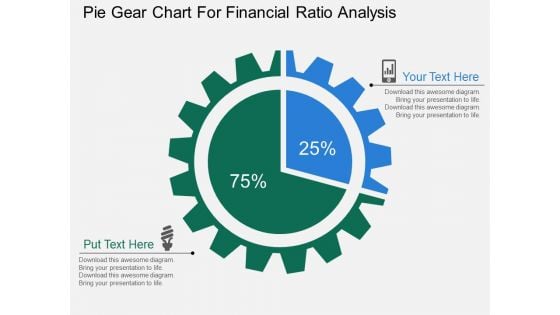
Pie Gear Chart For Financial Ratio Analysis Powerpoint Templates
This PPT slide displays diagram of pie gear chart. This PowerPoint template has been designed to exhibit financial ratio analysis. You can present your opinions using this impressive slide
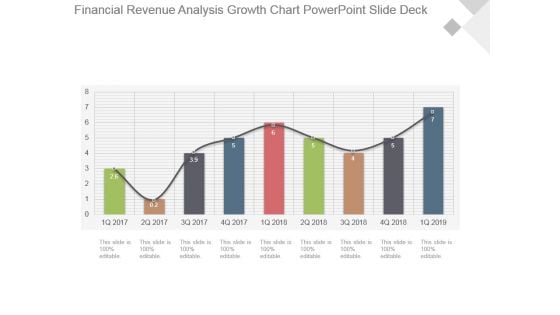
Financial Revenue Analysis Growth Chart Powerpoint Slide Deck
This is a financial revenue analysis growth chart powerpoint slide deck. This is a nine stage process. The stages in this process are growth, success, business, marketing, bar graph.
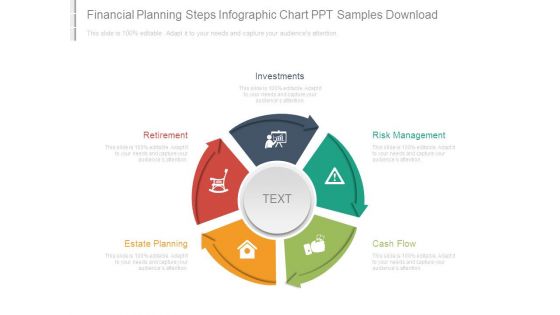
Financial Planning Steps Infographic Chart Ppt Samples Download
This is a financial planning steps infographic chart ppt samples download. This is a five stage process. The stages in this process are investments, retirement, estate planning, risk management, cash flow.
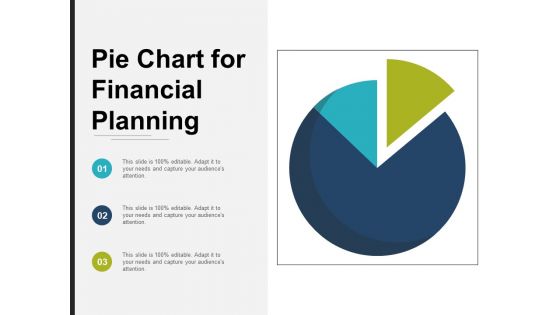
Pie Chart For Financial Planning Ppt PowerPoint Presentation Professional Aids
This is a pie chart for financial planning ppt powerpoint presentation professional aids. This is a three stage process. The stages in this process are sectioned circle, segmented circle, partitioned circle.
Financial Planning With Investment Chart Vector Icon Inspiration PDF
Persuade your audience using this financial planning with investment chart vector icon inspiration pdf. This PPT design covers three stages, thus making it a great tool to use. It also caters to a variety of topics including financial planning with investment chart vector icon. Download this PPT design now to present a convincing pitch that not only emphasizes the topic but also showcases your presentation skills.
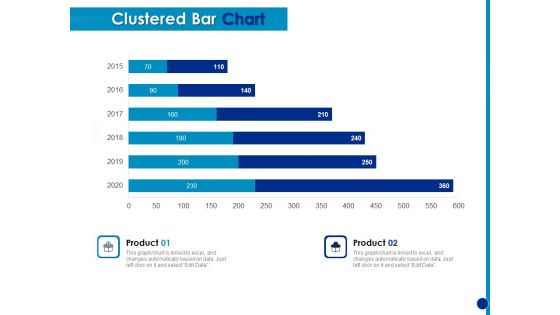
Generating Financial Support Clustered Bar Chart Ppt Portfolio Structure PDF
Presenting this set of slides with name generating financial support clustered bar chart ppt portfolio structure pdf. The topics discussed in these slide is clustered bar chart. This is a completely editable PowerPoint presentation and is available for immediate download. Download now and impress your audience.


 Continue with Email

 Home
Home


