Financial Comparison
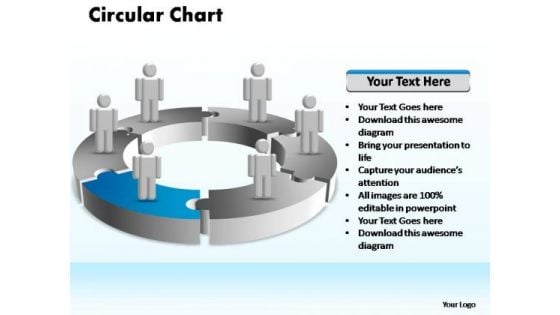
PowerPoint Slides Sales Circular Ppt Slide Layout
PowerPoint Slides Sales Circular PPT Slide layout-Highlight the key components of your entire manufacturing/ business process. Illustrate how each element flows seamlessly onto the next stage. Emphasise on any critical or key factors within them. Demonstrate how they all combine to form the final product.-PowerPoint Slides Sales Circular PPT Slide layout Address problems with our PowerPoint Slides Sales Circular Ppt Slide Layout. Download without worries with our money back guaranteee.
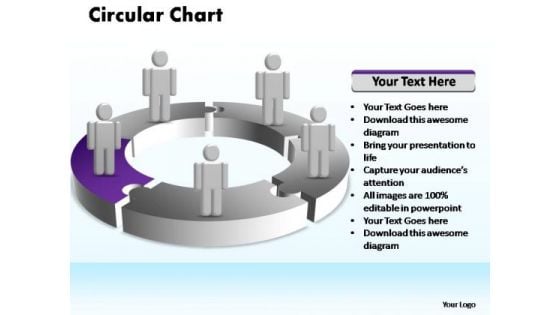
PowerPoint Theme Leadership Circular Ppt Theme
PowerPoint Theme Leadership Circular PPT Theme-Highlight the key components of your entire manufacturing/ business process. Illustrate how each element flows seamlessly onto the next stage. Emphasise on any critical or key factors within them. Demonstrate how they all combine to form the final product.-PowerPoint Theme Leadership Circular PPT Theme Retrieve your thoughts with our PowerPoint Theme Leadership Circular Ppt Theme. Download without worries with our money back guaranteee.
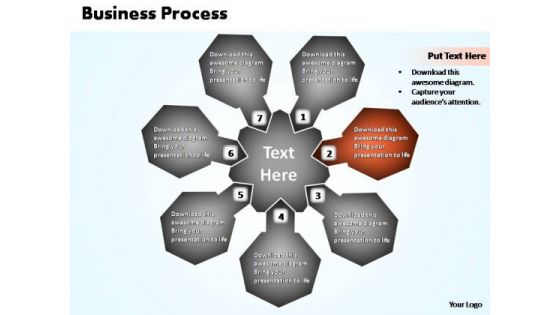
PowerPoint Process Global Business Process Chart Ppt Presentation
PowerPoint Process Global Business Process Chart PPT Presentation-Highlight the key components of your entire manufacturing/ business process. Illustrate how each element flows seamlessly onto the next stage. Emphasise on any critical or key factors within them. Demonstrate how they all combine to form the final product.-PowerPoint Process Global Business Process Chart PPT Presentation Enlist teams with our PowerPoint Process Global Business Process Chart Ppt Presentation. Download without worries with our money back guaranteee.
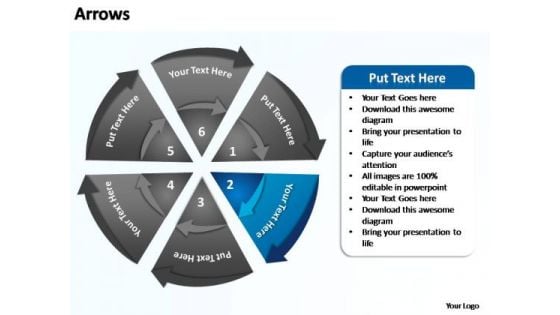
PowerPoint Themes Education Flow Of Circular Ppt Design
PowerPoint Themes Education Flow Of Circular PPT Design-Highlight the key components of your entire manufacturing/ business process. Illustrate how each element flows seamlessly onto the next stage. Emphasise on any critical or key factors within them. Demonstrate how they all combine to form the final product.-PowerPoint Themes Education Flow Of Circular PPT Design Intensify growth with our PowerPoint Themes Education Flow Of Circular Ppt Design. Download without worries with our money back guaranteee.
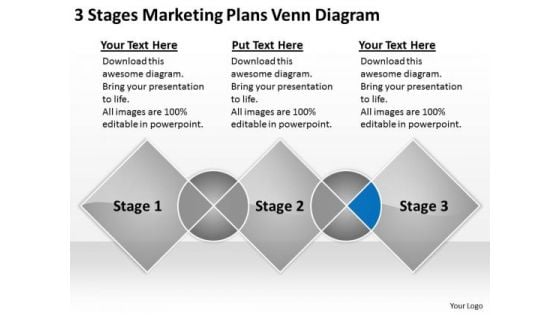
3 Stages Marketing Plans Venn Diagram Business Outline PowerPoint Slides
We present our 3 stages marketing plans venn diagram business outline PowerPoint Slides.Download and present our Business PowerPoint Templates because Timeline crunches are a fact of life. Meet all deadlines using our PowerPoint Templates and Slides. Download our Marketing PowerPoint Templates because Our PowerPoint Templates and Slides are created with admirable insight. Use them and give your group a sense of your logical mind. Download our Venn Diagrams PowerPoint Templates because You have a driving passion to excel in your field. Our PowerPoint Templates and Slides will prove ideal vehicles for your ideas. Use our Process and Flows PowerPoint Templates because Our PowerPoint Templates and Slides will give you great value for your money. Be assured of finding the best projection to highlight your words. Download and present our Shapes PowerPoint Templates because Our PowerPoint Templates and Slides provide you with a vast range of viable options. Select the appropriate ones and just fill in your text. Use these PowerPoint slides for presentations relating to Project, integrate, integrating, plan, concept, product, vision, components, circles, venn, product,management, business, elements, diagram, process,workflow, goal, overlapping, marketing, word, management, manage, lifecycle, intersect, method, company, venndiagram, overlap,intersecting, information, background, principle, industry, conceptual, square, initiative, communicate, communication. The prominent colors used in the PowerPoint template are Blue, White, Gray. With our 3 Stages Marketing Plans Venn Diagram Business Outline PowerPoint Slides success is a fait accompli. Bet your bottom dollar that it will happen.
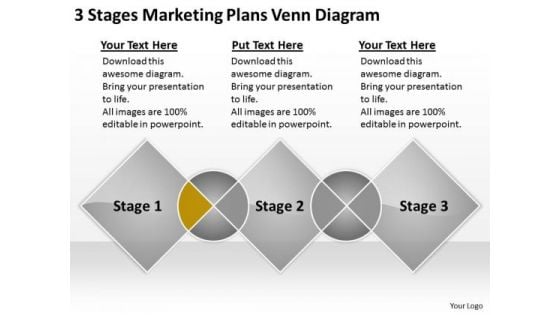
3 Stages Marketing Plans Venn Diagram Ppt Business For PowerPoint Slides
We present our 3 stages marketing plans venn diagram ppt business for PowerPoint Slides.Present our Process and Flows PowerPoint Templates because Our PowerPoint Templates and Slides help you pinpoint your timelines. Highlight the reasons for your deadlines with their use. Use our Flow Charts PowerPoint Templates because Our PowerPoint Templates and Slides ensures Effective communication. They help you put across your views with precision and clarity. Present our Business PowerPoint Templates because Our PowerPoint Templates and Slides are aesthetically designed to attract attention. We gaurantee that they will grab all the eyeballs you need. Use our Venn Diagrams PowerPoint Templates because Our PowerPoint Templates and Slides offer you the needful to organise your thoughts. Use them to list out your views in a logical sequence. Download our Marketing PowerPoint Templates because you can Add colour to your speech with our PowerPoint Templates and Slides. Your presentation will leave your audience speechless.Use these PowerPoint slides for presentations relating to Project, integrate, integrating, plan, concept, product, vision, components, circles, venn, product,management, business, elements, diagram, process,workflow, goal, overlapping, marketing, word, management, manage, lifecycle, intersect, method, company, venndiagram, overlap,intersecting, information, background, principle, industry, conceptual, square, initiative, communicate, communication. The prominent colors used in the PowerPoint template are Yellow, Gray, Black. Critique plans with our 3 Stages Marketing Plans Venn Diagram Ppt Business For PowerPoint Slides. Download without worries with our money back guaranteee.
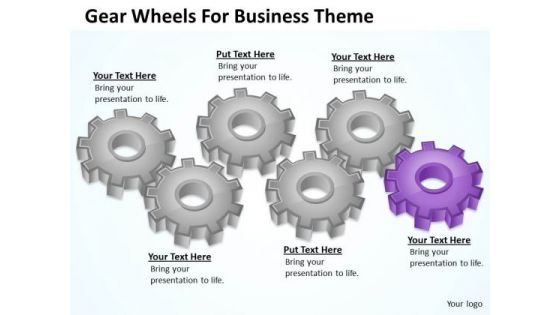
Gear Wheels For Business Theme Ppt Action Plan PowerPoint Slides
We present our gear wheels for business theme ppt action plan PowerPoint Slides.Download and present our Gear Wheels PowerPoint Templates because Our PowerPoint Templates and Slides will let you Clearly mark the path for others to follow. Download our Success PowerPoint Templates because Our PowerPoint Templates and Slides will bullet point your ideas. See them fall into place one by one. Download and present our Process and Flows PowerPoint Templates because Our PowerPoint Templates and Slides are specially created by a professional team with vast experience. They diligently strive to come up with the right vehicle for your brilliant Ideas. Use our Business PowerPoint Templates because Our PowerPoint Templates and Slides will give you great value for your money. Be assured of finding the best projection to highlight your words. Use our Marketing PowerPoint Templates because You canTake a leap off the starting blocks with our PowerPoint Templates and Slides. They will put you ahead of the competition in quick time.Use these PowerPoint slides for presentations relating to Gear, cog, cogwheel, concept, icon, teamwork, wheel, round, solid, isolated, roll, purple, white, machinery, flow, unique, difference, element, engine, abstract, equipment, illustration, creativity, dimensional, industrial, design, swirl, machine, connect, background, work, industry, conceptual, component. The prominent colors used in the PowerPoint template are Purple, Gray, Blue light. Our Gear Wheels For Business Theme Ppt Action Plan PowerPoint Slides are quite alluring. They embody the X-factor.
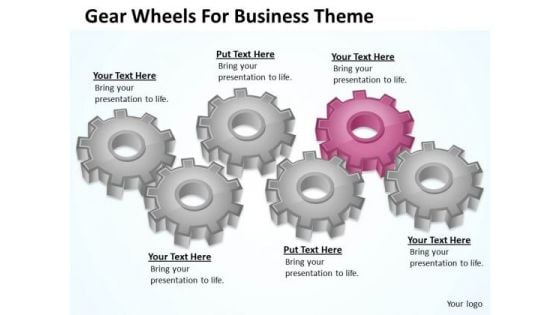
Gear Wheels For Business Theme Ppt Frozen Yogurt Plan PowerPoint Slides
We present our gear wheels for business theme ppt frozen yogurt plan PowerPoint Slides.Present our Gear Wheels PowerPoint Templates because Our PowerPoint Templates and Slides are topically designed to provide an attractive backdrop to any subject. Download and present our Success PowerPoint Templates because Our PowerPoint Templates and Slides will effectively help you save your valuable time. They are readymade to fit into any presentation structure. Use our Process and Flows PowerPoint Templates because Our PowerPoint Templates and Slides will give you great value for your money. Be assured of finding the best projection to highlight your words. Download and present our Business PowerPoint Templates because You have a driving passion to excel in your field. Our PowerPoint Templates and Slides will prove ideal vehicles for your ideas. Present our Marketing PowerPoint Templates because You should Bet on your luck with our PowerPoint Templates and Slides. Be assured that you will hit the jackpot.Use these PowerPoint slides for presentations relating to Gear, cog, cogwheel, concept, icon, teamwork, wheel, round, solid, isolated, roll, purple, white, machinery, flow, unique, difference, element, engine, abstract, equipment, illustration, creativity, dimensional, industrial, design, swirl, machine, connect, background, work, industry, conceptual, component. The prominent colors used in the PowerPoint template are Pink, Gray, Blue light. Complete your projects on time with our Gear Wheels For Business Theme Ppt Frozen Yogurt Plan PowerPoint Slides. Dont pass up this opportunity to shine.
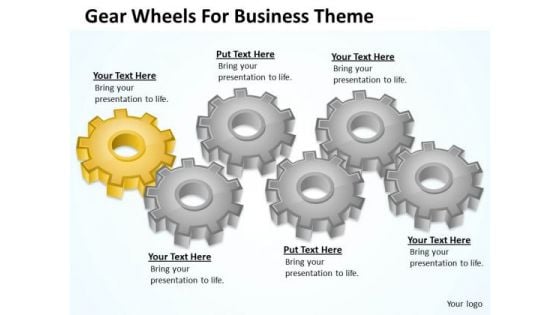
Gear Wheels For Business Theme Ppt Plan PowerPoint Slides
We present our gear wheels for business theme ppt plan PowerPoint Slides.Present our Gear Wheels PowerPoint Templates because Our PowerPoint Templates and Slides offer you the widest possible range of options. Use our Success PowerPoint Templates because Our PowerPoint Templates and Slides will give you great value for your money. Be assured of finding the best projection to highlight your words. Use our Process and Flows PowerPoint Templates because Our PowerPoint Templates and Slides will let you Hit the target. Go the full distance with ease and elan. Download our Business PowerPoint Templates because It will Give impetus to the hopes of your colleagues. Our PowerPoint Templates and Slides will aid you in winning their trust. Use our Marketing PowerPoint Templates because Our PowerPoint Templates and Slides team portray an attitude of elegance. Personify this quality by using them regularly.Use these PowerPoint slides for presentations relating to Gear, cog, cogwheel, concept, icon, teamwork, wheel, round, solid, isolated, roll, purple, white, machinery, flow, unique, difference, element, engine, abstract, equipment, illustration, creativity, dimensional, industrial, design, swirl, machine, connect, background, work, industry, conceptual, component. The prominent colors used in the PowerPoint template are Yellow, Blue light, Gray. Get that promotion with our Gear Wheels For Business Theme Ppt Plan PowerPoint Slides. You will come out on top.
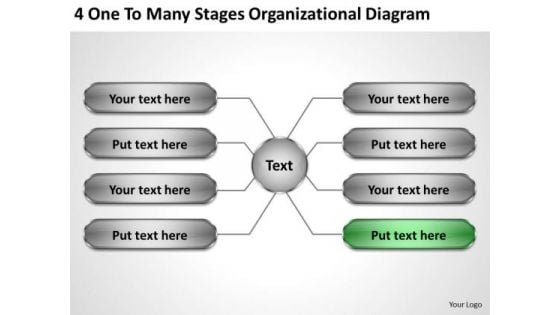
Modern Marketing Concepts 4 One To Many Stages Organizational Diagram Business Unit Strategy
We present our modern marketing concepts 4 one to many stages organizational diagram business unit strategy.Present our Marketing PowerPoint Templates because Our PowerPoint Templates and Slides will let your team Walk through your plans. See their energy levels rise as you show them the way. Download and present our Business PowerPoint Templates because Our PowerPoint Templates and Slides will embellish your thoughts. See them provide the desired motivation to your team. Download our Shapes PowerPoint Templates because They will Put your wonderful verbal artistry on display. Our PowerPoint Templates and Slides will provide you the necessary glam and glitter. Download our Process and Flows PowerPoint Templates because It will get your audience in sync. Download and present our Curves and Lines PowerPoint Templates because Our PowerPoint Templates and Slides are truly out of this world. Even the MIB duo has been keeping tabs on our team.Use these PowerPoint slides for presentations relating to Development, Web, Design, Building, Plan, Hand, Success, Successful, Internet, Visitor, Site, Website, Network, White, Innovation, Formula, Media, Business, Server, Concept, Characteristic, Organizing, Diagram, Drawing, Marketing, Word, Starting, Technology, Security, Blogging, Strategy, Technique, Young, Writing, Domain, Text, Quality, Organization, Brainstorming, Information, Background, Hosting, Blog, Database, Software, Component, White Board, Entrepreneur, Communication. The prominent colors used in the PowerPoint template are Green, Gray, Black. Advocate changes with our Modern Marketing Concepts 4 One To Many Stages Organizational Diagram Business Unit Strategy. Download without worries with our money back guaranteee.
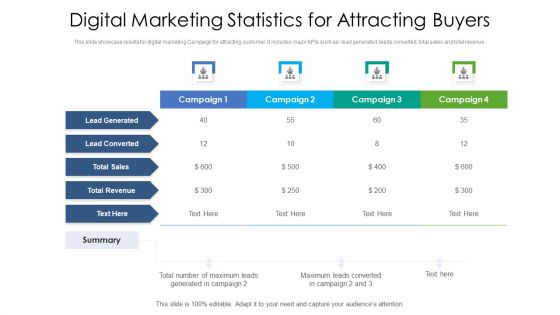
Digital Marketing Statistics For Attracting Buyers Ppt PowerPoint Presentation Gallery Graphics Tutorials PDF
This slide showcase results for digital marketing Campaign for attracting customer. It includes major KPIs such as- lead generated, leads converted, total sales and total revenue. Pitch your topic with ease and precision using this digital marketing statistics for attracting buyers ppt powerpoint presentation gallery graphics tutorials pdf. This layout presents information on revenue, sales, campaign. It is also available for immediate download and adjustment. So, changes can be made in the color, design, graphics or any other component to create a unique layout.
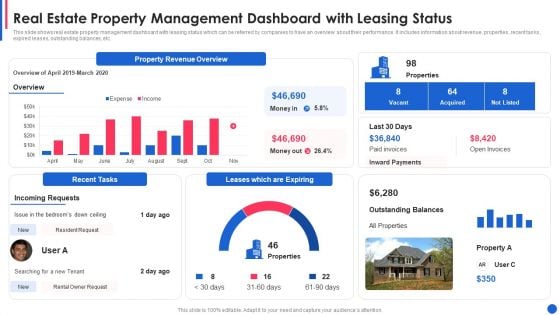
Real Estate Property Management Dashboard With Leasing Status Graphics PDF
This slide shows real estate property management dashboard with leasing status which can be referred by companies to have an overview about their performance. It includes information about revenue, properties, recent tasks, expired leases, outstanding balances, etc.Pitch your topic with ease and precision using this real estate property management dashboard with leasing status graphics pdf This layout presents information on property revenue overview, leases which are expiring, recent tasks It is also available for immediate download and adjustment. So, changes can be made in the color, design, graphics or any other component to create a unique layout.
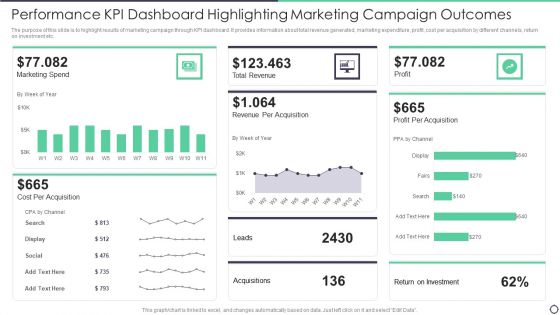
Performance Kpi Dashboard Highlighting Marketing Campaign Outcomes Topics PDF
The purpose of this slide is to highlight results of marketing campaign through KPI dashboard. It provides information about total revenue generated, marketing expenditure, profit, cost per acquisition by different channels, return on investment etc. Pitch your topic with ease and precision using this Performance Kpi Dashboard Highlighting Marketing Campaign Outcomes Topics PDF. This layout presents information on Cost, Marketing, Revenue. It is also available for immediate download and adjustment. So, changes can be made in the color, design, graphics or any other component to create a unique layout.
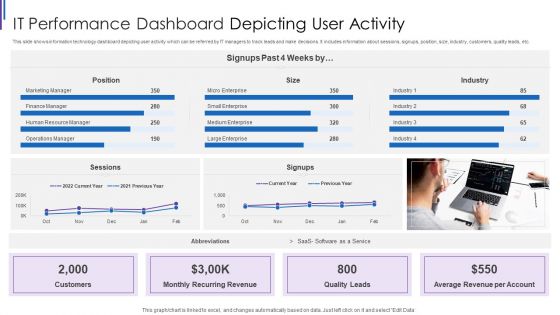
IT Performance Dashboard Depicting User Activity Inspiration PDF
This slide shows information technology dashboard depicting user activity which can be referred by IT managers to track leads and make decisions. It includes information about sessions, signups, position, size, industry, customers, quality leads, etc. Pitch your topic with ease and precision using this IT Performance Dashboard Depicting User Activity Inspiration PDF. This layout presents information on Monthly Recurring Revenue, Average Revenue Per, Account Quality Leads, Customers Position Sessions. It is also available for immediate download and adjustment. So, changes can be made in the color, design, graphics or any other component to create a unique layout.

New Service Launch And Development Strategy To Gain Market Share What Organization Can Expect Portrait PDF
This slide showcases purpose of new launch that can help organization to identify the goals before conducting promotion and launching new service. Its key components are increase revenue, increase market share and competitor edge.Presenting New Service Launch And Development Strategy To Gain Market Share What Organization Can Expect Portrait PDF to provide visual cues and insights. Share and navigate important information on three stages that need your due attention. This template can be used to pitch topics like Expected Benefits, Introducing Service, Increase In Revenue In addtion, this PPT design contains high resolution images, graphics, etc, that are easily editable and available for immediate download.
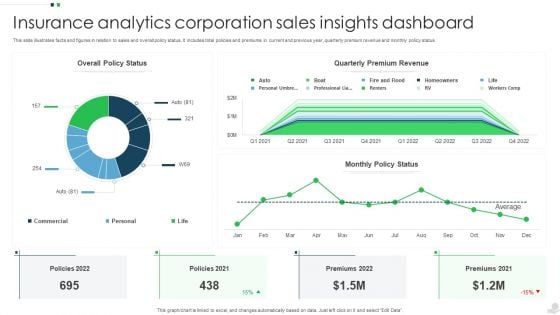
Insurance Analytics Corporation Sales Insights Dashboard Structure PDF
This slide illustrates facts and figures in relation to sales and overall policy status. It includes total policies and premiums in current and previous year, quarterly premium revenue and monthly policy status. Pitch your topic with ease and precision using this Insurance Analytics Corporation Sales Insights Dashboard Structure PDF. This layout presents information on Quarterly Premium Revenue, Sales Insights Dashboard, Insurance Analytics Corporation. It is also available for immediate download and adjustment. So, changes can be made in the color, design, graphics or any other component to create a unique layout.
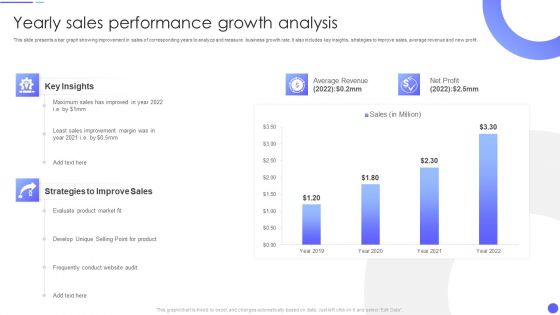
Yearly Sales Performance Growth Analysis Rules PDF
This slide presents a bar graph showing improvement in sales of corresponding years to analyze and measure business growth rate. It also includes key insights, strategies to improve sales, average revenue and new profit.Pitch your topic with ease and precision using this Yearly Sales Performance Growth Analysis Rules PDF This layout presents information on Average Revenue, Strategies To Improve, Sales Improvement It is also available for immediate download and adjustment. So, changes can be made in the color, design, graphics or any other component to create a unique layout.
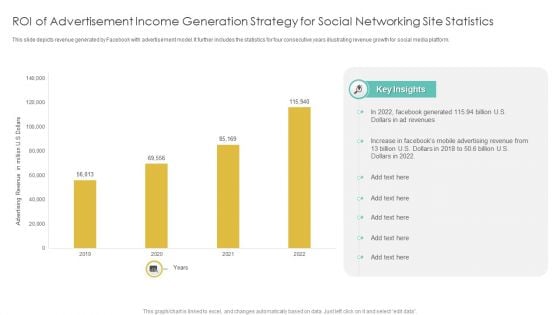
Roi Of Advertisement Income Generation Strategy For Social Networking Site Statistics Diagrams PDF
This slide depicts revenue generated by Facebook with advertisement model. It further includes the statistics for four consecutive years illustrating revenue growth for social media platform. Pitch your topic with ease and precision using this Roi Of Advertisement Income Generation Strategy For Social Networking Site Statistics Diagrams PDF. This layout presents information on Advertisement Income, Generation Strategy, Social Networking Site Statistics. It is also available for immediate download and adjustment. So, changes can be made in the color, design, graphics or any other component to create a unique layout.
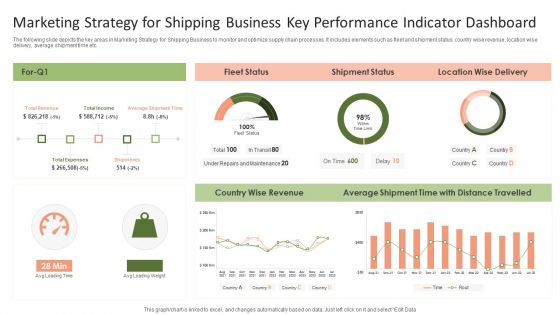
Marketing Strategy For Shipping Business Key Performance Indicator Dashboard Graphics PDF
The following slide depicts the key areas in Marketing Strategy for Shipping Business to monitor and optimize supply chain processes. It includes elements such as fleet and shipment status, country wise revenue, location wise delivery, average shipment time etc.Pitch your topic with ease and precision using this Marketing Strategy For Shipping Business Key Performance Indicator Dashboard Graphics PDF. This layout presents information on Shipment Status, Average Shipment, Wise Revenue. It is also available for immediate download and adjustment. So, changes can be made in the color, design, graphics or any other component to create a unique layout.
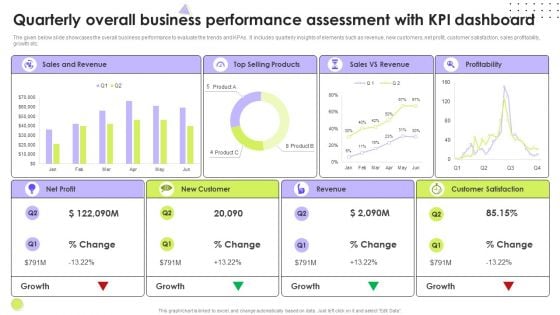
Quarterly Overall Business Performance Assessment With Kpi Dashboard Microsoft PDF
The given below slide showcases the overall business performance to evaluate the trends and KPAs. It includes quarterly insights of elements such as revenue, new customers, net profit, customer satisfaction, sales profitability, growth etc. Pitch your topic with ease and precision using this Quarterly Overall Business Performance Assessment With Kpi Dashboard Microsoft PDF. This layout presents information on Revenue, Customer Satisfaction, Net Profit. It is also available for immediate download and adjustment. So, changes can be made in the color, design, graphics or any other component to create a unique layout.
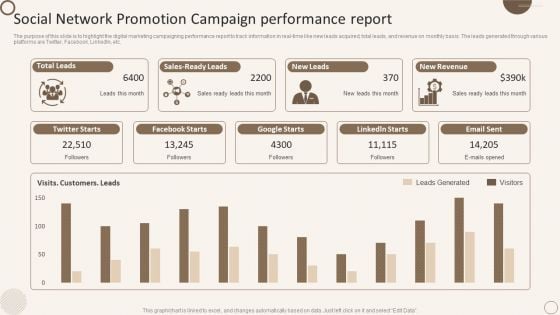
Social Network Promotion Campaign Performance Report Demonstration PDF
The purpose of this slide is to highlight the digital marketing campaigning performance report to track information in real-time like new leads acquired, total leads, and revenue on monthly basis. The leads generated through various platforms are Twitter, Facebook, LinkedIn, etc. Pitch your topic with ease and precision using this Social Network Promotion Campaign Performance Report Demonstration PDF. This layout presents information on Sales Ready Leads, New Leads, New Revenue. It is also available for immediate download and adjustment. So, changes can be made in the color, design, graphics or any other component to create a unique layout.
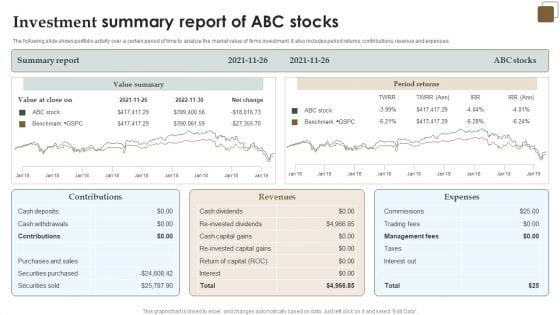
Investment Summary Report Of ABC Stocks Introduction PDF
The following slide shows portfolio activity over a certain period of time to analyze the market value of firms investment. It also includes period returns, contributions, revenue and expenses. Pitch your topic with ease and precision using this Investment Summary Report Of ABC Stocks Introduction PDF. This layout presents information on Summary Report, Value Summary, Revenues, Expenses. It is also available for immediate download and adjustment. So, changes can be made in the color, design, graphics or any other component to create a unique layout.
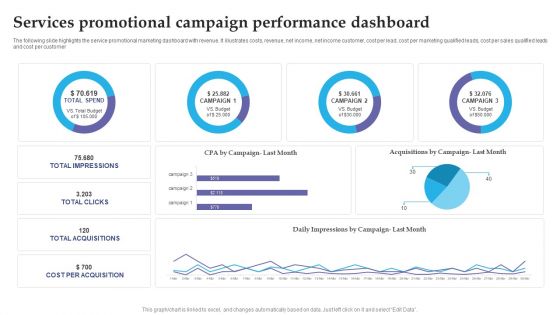
Services Promotional Campaign Performance Dashboard Slides PDF
The following slide highlights the service promotional marketing dashboard with revenue. It illustrates costs, revenue, net income, net income customer, cost per lead, cost per marketing qualified leads, cost per sales qualified leads and cost per customer. Pitch your topic with ease and precision using this Services Promotional Campaign Performance Dashboard Slides PDF. This layout presents information on Services Promotional, Campaign Performance Dashboard. It is also available for immediate download and adjustment. So, changes can be made in the color, design, graphics or any other component to create a unique layout.

Project Metrics Dashboard With Average Margin Sample PDF
This slide focuses on project management dashboard which covers number of active projects, average margin, revenues, costs, tasks status, resources with planned and actual efforts, available hours, tasks assignments with project deadlines, client, etc. Pitch your topic with ease and precision using this Project Metrics Dashboard With Average Margin Sample PDF. This layout presents information on Average Margin, Revenue, Cost. It is also available for immediate download and adjustment. So, changes can be made in the color, design, graphics or any other component to create a unique layout.
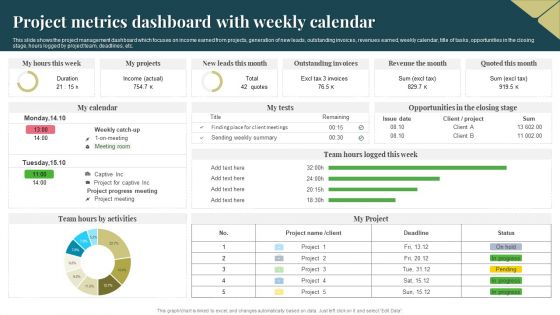
Project Metrics Dashboard With Weekly Calendar Download PDF
This slide shows the project management dashboard which focuses on income earned from projects, generation of new leads, outstanding invoices, revenues earned, weekly calendar, title of tasks, opportunities in the closing stage, hours logged by project team, deadlines, etc. Pitch your topic with ease and precision using this Project Metrics Dashboard With Weekly Calendar Download PDF. This layout presents information on Income, Revenue, Project. It is also available for immediate download and adjustment. So, changes can be made in the color, design, graphics or any other component to create a unique layout.

Kpis To Measure International Growth Performance Ppt Infographics Graphic Tips PDF
This slide shows various KPIs which can be used to evaluate international growth performance. It includes revenue, e-commerce conversion rate, cost per acquisition, bounce rate, etc. Pitch your topic with ease and precision using this Kpis To Measure International Growth Performance Ppt Infographics Graphic Tips PDF. This layout presents information on Revenue, Cost Per Acquisition, Bounce Rate. It is also available for immediate download and adjustment. So, changes can be made in the color, design, graphics or any other component to create a unique layout.
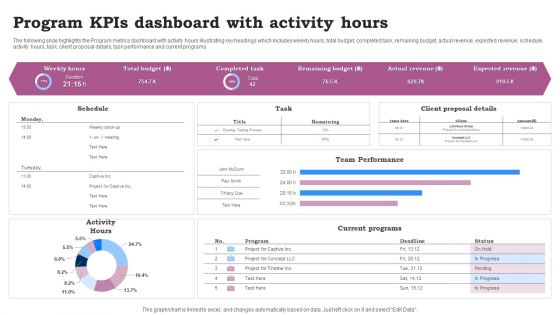
Program Kpis Dashboard With Activity Hours Ppt Infographics Clipart Images PDF
The following slide highlights the Program metrics dashboard with activity hours illustrating key headings which includes weekly hours, total budget, completed task, remaining budget, actual revenue, expected revenue, schedule, activity hours, task, client proposal details, task performance and current programs. Pitch your topic with ease and precision using this Program Kpis Dashboard With Activity Hours Ppt Infographics Clipart Images PDF. This layout presents information on Team Performance, Current Programs, Activity Hours. It is also available for immediate download and adjustment. So, changes can be made in the color, design, graphics or any other component to create a unique layout.
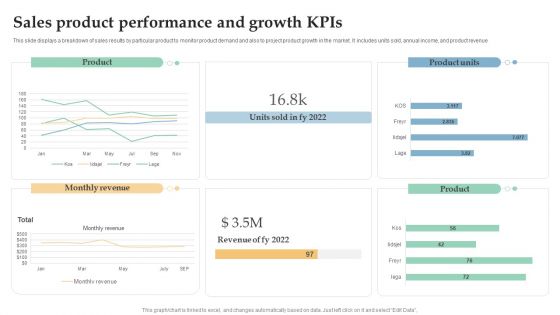
Sales Product Performance And Growth Kpis Ppt Layouts Mockup PDF
This slide displays a breakdown of sales results by particular product to monitor product demand and also to project product growth in the market. It includes units sold, annual income, and product revenue. Pitch your topic with ease and precision using this Sales Product Performance And Growth Kpis Ppt Layouts Mockup PDF. This layout presents information on Monthly Revenue, Product, Product Units. It is also available for immediate download and adjustment. So, changes can be made in the color, design, graphics or any other component to create a unique layout.
Consumer Journey Mapping Techniques Loyalty Program Performance Tracking Dashboard Portrait PDF
This slide covers the KPI dashboard for analyzing customer loyalty campaign results. It includes metrics such as revenue, liability, NQP accrued, transaction count, members, redemption ratio, etc. Pitch your topic with ease and precision using this Consumer Journey Mapping Techniques Loyalty Program Performance Tracking Dashboard Portrait PDF. This layout presents information on Transaction Count, Revenue, Redemption Ratio. It is also available for immediate download and adjustment. So, changes can be made in the color, design, graphics or any other component to create a unique layout.
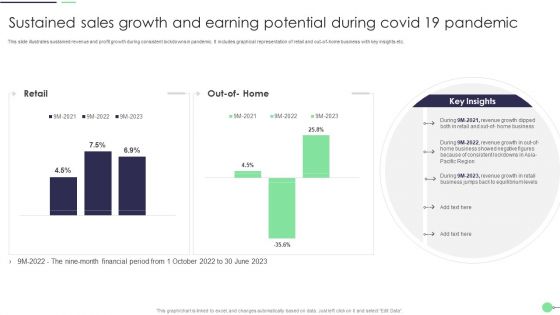
Sustained Sales Growth And Earning Potential During Covid 19 Pandemic Demonstration PDF
This slide illustrates sustained revenue and profit growth during consistent lockdowns in pandemic. It includes graphical representation of retail and out of home business with key insights etc. Pitch your topic with ease and precision using this Sustained Sales Growth And Earning Potential During Covid 19 Pandemic Demonstration PDF. This layout presents information on Revenue Growth, Business, Retail. It is also available for immediate download and adjustment. So, changes can be made in the color, design, graphics or any other component to create a unique layout.
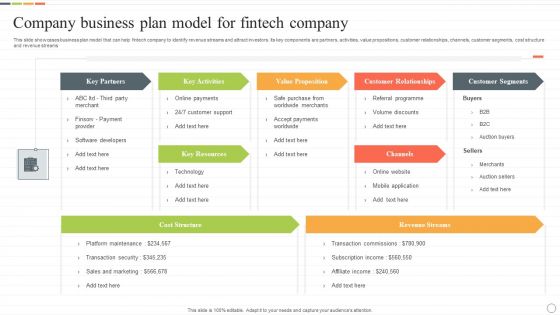
Company Business Plan Model For Fintech Company Structure PDF
This slide showcases business plan model that can help fintech company to identify revenue streams and attract investors. Its key components are partners, activities, value propositions, customer relationships, channels, customer segments, cost structure and revenue streams. Showcasing this set of slides titled Company Business Plan Model For Fintech Company Structure PDF. The topics addressed in these templates are Value Proposition, Customer Relationships, Customer Segments. All the content presented in this PPT design is completely editable. Download it and make adjustments in color, background, font etc. as per your unique business setting.
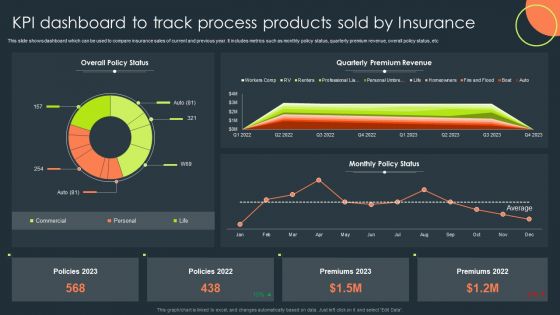
KPI Dashboard To Track Process Products Sold By Insurance Topics PDF
This slide shows dashboard which can be used to compare insurance sales of current and previous year. It includes metrics such as monthly policy status, quarterly premium revenue, overall policy status, etc. Pitch your topic with ease and precision using this KPI Dashboard To Track Process Products Sold By Insurance Topics PDF. This layout presents information on Overall Policy Status, Quarterly Premium Revenue, Monthly Policy Status. It is also available for immediate download and adjustment. So, changes can be made in the color, design, graphics or any other component to create a unique layout.
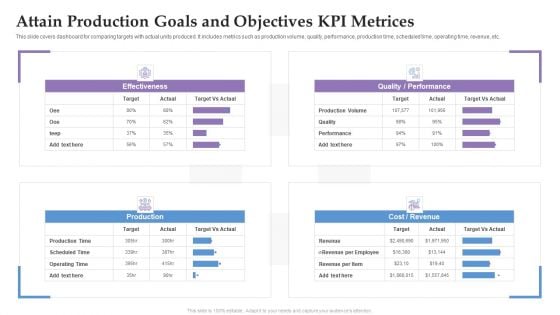
Attain Production Goals And Objectives KPI Metrices Ppt Summary Format Ideas PDF
This slide covers dashboard for comparing targets with actual units produced. It includes metrics such as production volume, quality, performance, production time, scheduled time, operating time, revenue, etc. Pitch your topic with ease and precision using this Attain Production Goals And Objectives KPI Metrices Ppt Summary Format Ideas PDF. This layout presents information on Production, Cost, Revenue, Performance. It is also available for immediate download and adjustment. So, changes can be made in the color, design, graphics or any other component to create a unique layout.
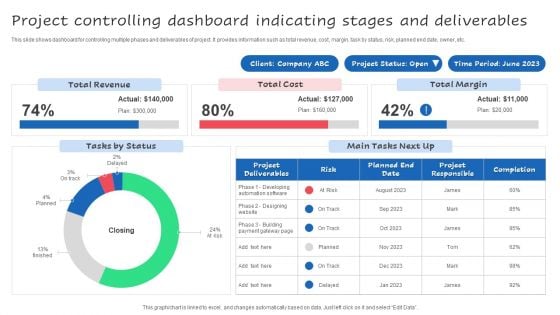
Project Controlling Dashboard Indicating Stages And Deliverables Ppt Styles Guide PDF
This slide shows dashboard for controlling multiple phases and deliverables of project. It provides information such as total revenue, cost, margin, task by status, risk, planned end date, owner, etc. Pitch your topic with ease and precision using this Project Controlling Dashboard Indicating Stages And Deliverables Ppt Styles Guide PDF. This layout presents information on Total Revenue, Total Margin, Total Cost. It is also available for immediate download and adjustment. So, changes can be made in the color, design, graphics or any other component to create a unique layout.
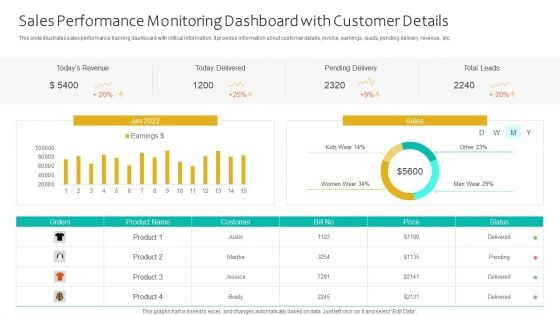
Sales Performance Monitoring Dashboard With Customer Details Ppt Infographics Themes PDF
This slide illustrates sales performance tracking dashboard with critical information. It provides information about customer details, invoice, earnings, leads, pending delivery, revenue, etc. Pitch your topic with ease and precision using this Sales Performance Monitoring Dashboard With Customer Details Ppt Infographics Themes PDF. This layout presents information on Todays Revenue, Today Delivered, Pending Delivery, Total Leads. It is also available for immediate download and adjustment. So, changes can be made in the color, design, graphics or any other component to create a unique layout.
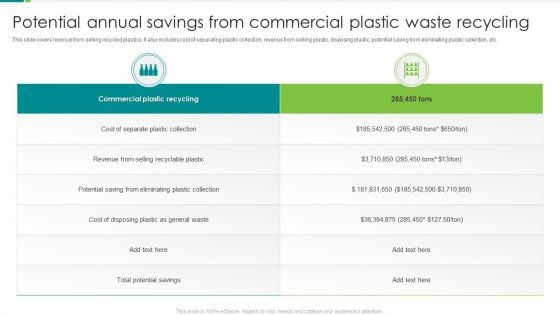
Potential Annual Savings From Commercial Plastic Waste Recycling Structure PDF
This slide covers revenue from selling recycled plastics. It also includes cost of separating plastic collection, revenue from selling plastic, disposing plastic, potential saving from eliminating plastic. Pitch your topic with ease and precision using this Potential Annual Savings From Commercial Plastic Waste Recycling Structure PDF. This layout presents information on Commercial Plastic Recycling, Total Potential Savings, Selling Recyclable Plastic. It is also available for immediate download and adjustment. So, changes can be made in the color, design, graphics or any other component to create a unique layout.
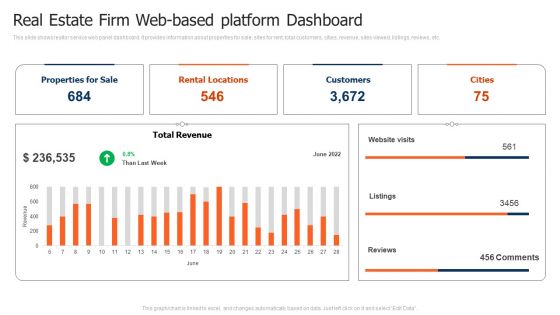
Real Estate Firm Web Based Platform Dashboard Background PDF
This slide shows realtor service web panel dashboard. It provides information about properties for sale, sites for rent, total customers, cities, revenue, sites viewed, listings, reviews, etc. Pitch your topic with ease and precision using this Real Estate Firm Web Based Platform Dashboard Background PDF. This layout presents information on Total Revenue, Rental Locations, Properties For Sale. It is also available for immediate download and adjustment. So, changes can be made in the color, design, graphics or any other component to create a unique layout.
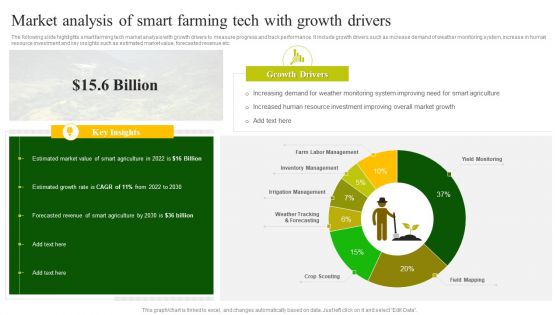
Market Analysis Of Smart Farming Tech With Growth Drivers Template PDF
The following slide highlights smart farming tech market analysis with growth drivers to measure progress and track performance. It include growth drivers such as increase demand of weather monitoring system, increase in human resource investment and key insights such as estimated market value, forecasted revenue etc.Pitch your topic with ease and precision using this Market Analysis Of Smart Farming Tech With Growth Drivers Template PDF. This layout presents information on Estimated Growth, Estimated Market Value, Forecasted Revenue. It is also available for immediate download and adjustment. So, changes can be made in the color, design, graphics or any other component to create a unique layout.
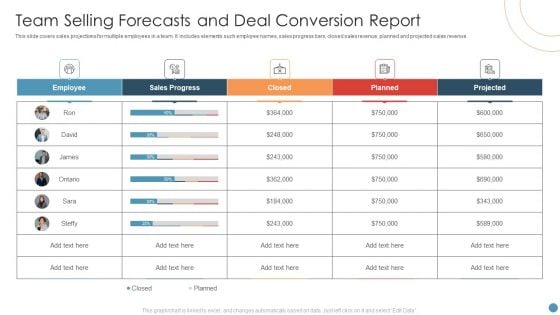
Team Selling Forecasts And Deal Conversion Report Themes PDF
This slide covers sales projections for multiple employees in a team. It includes elements such employee names, sales progress bars, closed sales revenue, planned and projected sales revenue. Pitch your topic with ease and precision using this Team Selling Forecasts And Deal Conversion Report Themes PDF. This layout presents information on Sales Progress, Employee, Team Selling Forecasts. It is also available for immediate download and adjustment. So, changes can be made in the color, design, graphics or any other component to create a unique layout.
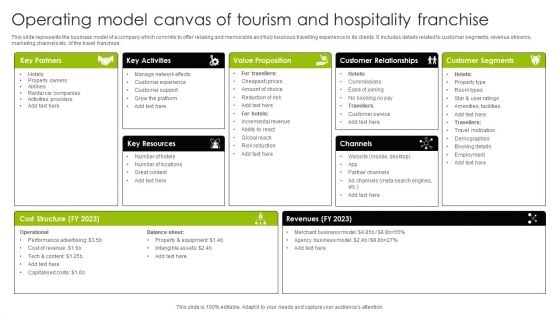
Operating Model Canvas Of Tourism And Hospitality Franchise Ppt Portfolio Grid PDF
This slide represents the business model of a company which commits to offer relaxing and memorable and truly luxurious travelling experience to its clients. It includes details related to customer segments, revenue streams, marketing channels etc. of the travel franchise. Pitch your topic with ease and precision using this Operating Model Canvas Of Tourism And Hospitality Franchise Ppt Portfolio Grid PDF. This layout presents information on Cost Structure, Revenue Streams, Key Resources, Value Propositions. It is also available for immediate download and adjustment. So, changes can be made in the color, design, graphics or any other component to create a unique layout.
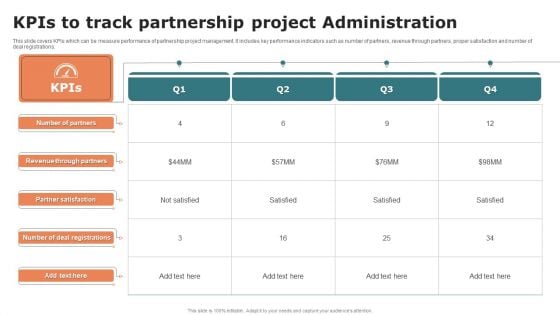
Kpis To Track Partnership Project Administration Graphics PDF
This slide covers KPIs which can be measure performance of partnership project management. It includes key performance indicators such as number of partners, revenue through partners, proper satisfaction and number of deal registrations. Pitch your topic with ease and precision using this Kpis To Track Partnership Project Administration Graphics PDF. This layout presents information on Partner Satisfaction, Revenue Through Partners, Number Of Partners. It is also available for immediate download and adjustment. So, changes can be made in the color, design, graphics or any other component to create a unique layout.

Manufactured Products Sales Performance Monitoring Dashboard Information PDF
This slide shows the dashboard the data related to the sales performance of the products manufactured by the organization in order to effectively measure and monitor the performance of the sales team. It shows details related to revenue generated and units sold etc.Pitch your topic with ease and precision using this Manufactured Products Sales Performance Monitoring Dashboard Information PDF. This layout presents information on Monthly Revenue, Manufactured Products, Sales Performance Monitoring. It is also available for immediate download and adjustment. So, changes can be made in the color, design, graphics or any other component to create a unique layout.
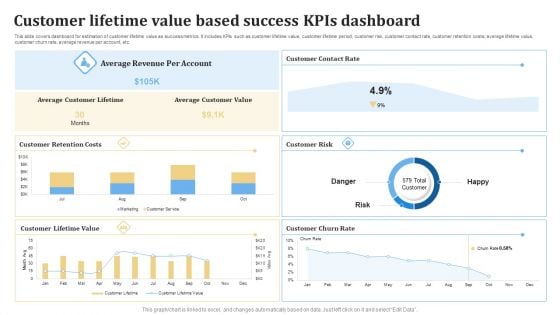
Customer Lifetime Value Based Success KPIS Dashboard Ppt PowerPoint Presentation Layouts Gridlines PDF
This slide covers dashboard for estimation of customer lifetime value as success metrics. It includes KPIs such as customer lifetime value, customer lifetime period, customer risk, customer contact rate, customer retention costs, average lifetime value, customer churn rate, average revenue per account, etc. Pitch your topic with ease and precision using this Customer Lifetime Value Based Success KPIS Dashboard Ppt PowerPoint Presentation Layouts Gridlines PDF. This layout presents information on Average Revenue, Customer Lifetime, Customer Risk. It is also available for immediate download and adjustment. So, changes can be made in the color, design, graphics or any other component to create a unique layout.
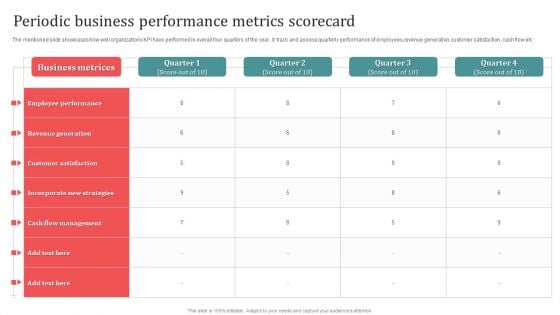
Periodic Business Performance Metrics Scorecard Ideas PDF
The mentioned slide showcases how well organizations KPI have performed in overall four quarters of the year. It track and assess quarterly performance of employees,revenue generation,customer satisfaction, cash flow etc. Pitch your topic with ease and precision using this Periodic Business Performance Metrics Scorecard Ideas PDF. This layout presents information on Employee Performance, Revenue Generation, Customer Satisfaction. It is also available for immediate download and adjustment. So, changes can be made in the color, design, graphics or any other component to create a unique layout.
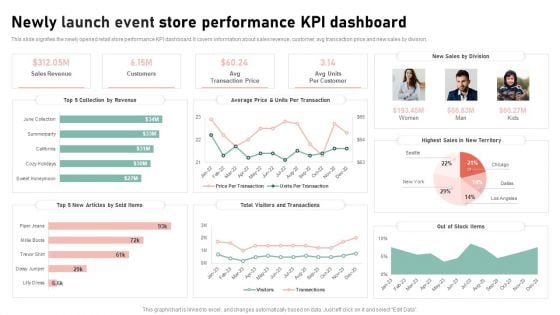
Newly Launch Event Store Performance Kpi Dashboard Elements Sample PDF
This slide signifies the newly opened retail store performance KPI dashboard. It covers information about sales revenue, customer, avg transaction price and new sales by division. Pitch your topic with ease and precision using this Newly Launch Event Store Performance Kpi Dashboard Elements Sample PDF. This layout presents information on Collection By Revenue, Articles By Sold Items, Visitors And Transactions. It is also available for immediate download and adjustment. So, changes can be made in the color, design, graphics or any other component to create a unique layout.
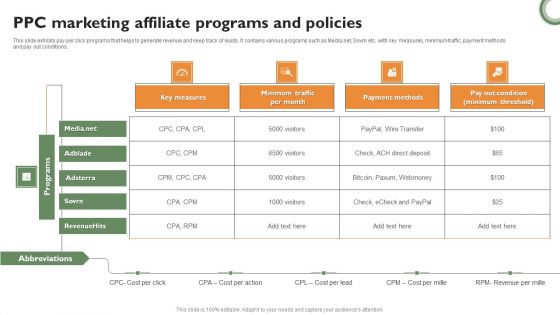
PPC Marketing Affiliate Programs And Policies Pictures PDF
This slide exhibits pay per click programs that helps to generate revenue and keep track of leads. It contains various programs such as Media.net, Sovrn etc. with key measures, minimum traffic, payment methods and pay out conditions. Pitch your topic with ease and precision using this PPC Marketing Affiliate Programs And Policies Pictures PDF. This layout presents information on Key Measures, Cost Per Action, Revenue. It is also available for immediate download and adjustment. So, changes can be made in the color, design, graphics or any other component to create a unique layout.
Multi Channel Marketing Strategies Performance Tracking Dashboard Elements PDF
This slide covers dashboard to track achievements of various communication channel. It includes elements such as revenue, sessions, costs, CTR. ROAS. It also includes communication channels such as Instagram, Facebook, Google Ads, Pinterest and Twitter. Pitch your topic with ease and precision using this Multi Channel Marketing Strategies Performance Tracking Dashboard Elements PDF. This layout presents information on Channel Grouping, Revenue Cost Date, Sessions. It is also available for immediate download and adjustment. So, changes can be made in the color, design, graphics or any other component to create a unique layout.
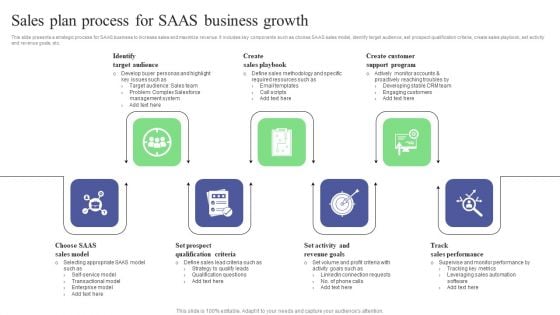
Sales Plan Process For SAAS Business Growth Guidelines PDF
This slide presents a strategic process for SAAS business to increase sales and maximize revenue. It includes key components such as choose SAAS sales model, identify target audience, set prospect qualification criteria, create sales playbook, set activity and revenue goals, etc. Presenting Sales Plan Process For SAAS Business Growth Guidelines PDF to dispense important information. This template comprises seven stages. It also presents valuable insights into the topics including Create Customer Support Program, Create Sales Playbook, Identify Target Audience. This is a completely customizable PowerPoint theme that can be put to use immediately. So, download it and address the topic impactfully.
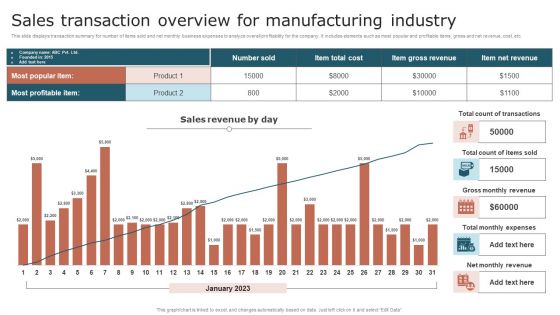
Sales Transaction Overview For Manufacturing Industry Elements PDF
This slide displays transaction summary for number of items sold and net monthly business expenses to analyze overall profitability for the company. It includes elements such as most popular and profitable items, gross and net revenue, cost, etc. Pitch your topic with ease and precision using this Sales Transaction Overview For Manufacturing Industry Elements PDF. This layout presents information on Product, Sales Revenue, Transactions. It is also available for immediate download and adjustment. So, changes can be made in the color, design, graphics or any other component to create a unique layout.
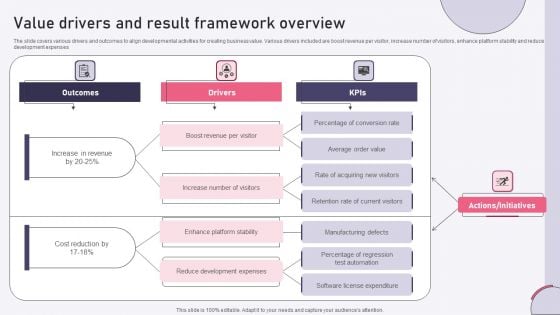
Value Drivers And Result Framework Overview Ppt Infographics Ideas PDF
The slide covers various drivers and outcomes to align developmental activities for creating business value. Various drivers included are boost revenue per visitor, increase number of visitors, enhance platform stability and reduce development expenses. Pitch your topic with ease and precision using this Value Drivers And Result Framework Overview Ppt Infographics Ideas PDF. This layout presents information on Outcomes, Drivers, Kpis, Boost Revenue, Per Visitor. It is also available for immediate download and adjustment. So, changes can be made in the color, design, graphics or any other component to create a unique layout.
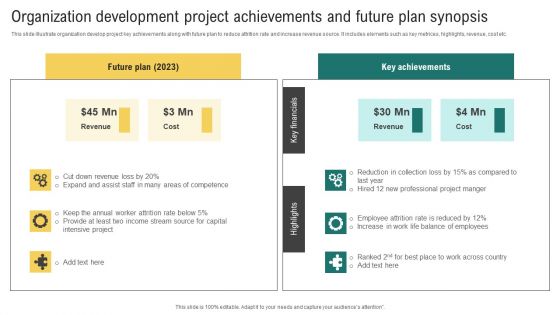
Organization Development Project Achievements And Future Plan Synopsis Microsoft PDF
This slide illustrate organization develop project key achievements along with future plan to reduce attrition rate and increase revenue source. It includes elements such as key metrices, highlights, revenue, cost etc. Pitch your topic with ease and precision using this Organization Development Project Achievements And Future Plan Synopsis Microsoft PDF. This layout presents information on Future Plan, Key Achievements, Expand Assist. It is also available for immediate download and adjustment. So, changes can be made in the color, design, graphics or any other component to create a unique layout.
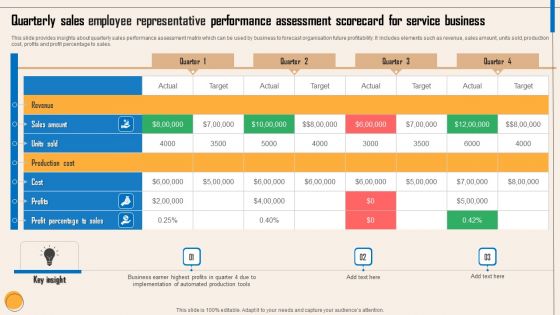
Quarterly Sales Employee Representative Performance Assessment Scorecard For Service Business Professional PDF
This slide provides insights about quarterly sales performance assessment matrix which can be used by business to forecast organisation future profitability. It includes elements such as revenue, sales amount, units sold, production cost, profits and profit percentage to sales. Pitch your topic with ease and precision using this Quarterly Sales Employee Representative Performance Assessment Scorecard For Service Business Professional PDF. This layout presents information on Revenue, Sales Amount, Units Sold, Production Cost, Cost, Profits, Profit Percentage To Sales. It is also available for immediate download and adjustment. So, changes can be made in the color, design, graphics or any other component to create a unique layout.
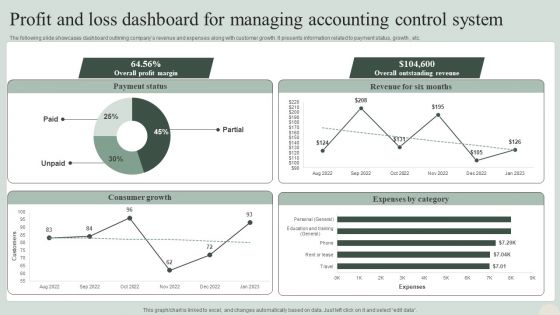
Profit And Loss Dashboard For Managing Accounting Control System Information PDF
The following slide showcases dashboard outlining companys revenue and expenses along with customer growth. It presents information related to payment status, growth , etc. Pitch your topic with ease and precision using this Profit And Loss Dashboard For Managing Accounting Control System Information PDF. This layout presents information on Consumer Growth, Expenses By Category, Overall Outstanding Revenue. It is also available for immediate download and adjustment. So, changes can be made in the color, design, graphics or any other component to create a unique layout.
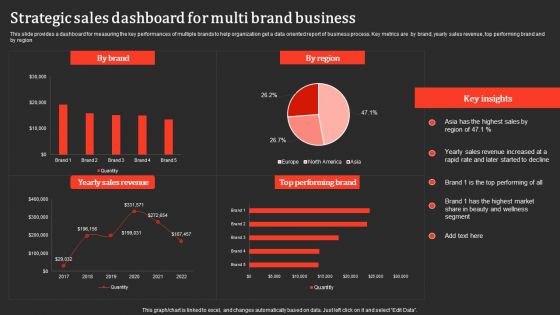
Strategic Sales Dashboard For Multi Brand Business Professional PDF
This slide provides a dashboard for measuring the key performances of multiple brands to help organization get a data oriented report of business process. Key metrics are by brand, yearly sales revenue, top performing brand and by region. Pitch your topic with ease and precision using this Strategic Sales Dashboard For Multi Brand Business Professional PDF. This layout presents information on Yearly Sales Revenue, Performing Brand. It is also available for immediate download and adjustment. So, changes can be made in the color, design, graphics or any other component to create a unique layout.
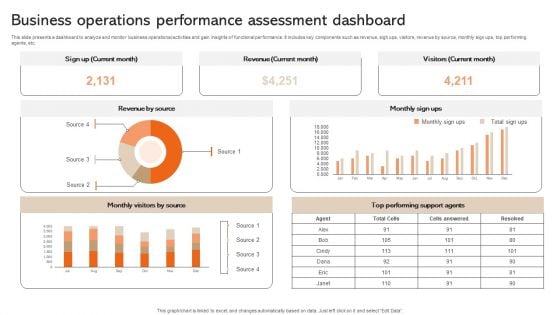
Business Operations Performance Assessment Dashboard Information PDF
This slide presents a dashboard to analyze and monitor business operational activities and gain insights of functional performance. It includes key components such as revenue, sigh ups, visitors, revenue by source, monthly sign ups, top performing agents, etc. Showcasing this set of slides titled Business Operations Performance Assessment Dashboard Information PDF. The topics addressed in these templates are Source, Monthly, Agents. All the content presented in this PPT design is completely editable. Download it and make adjustments in color, background, font etc. as per your unique business setting.
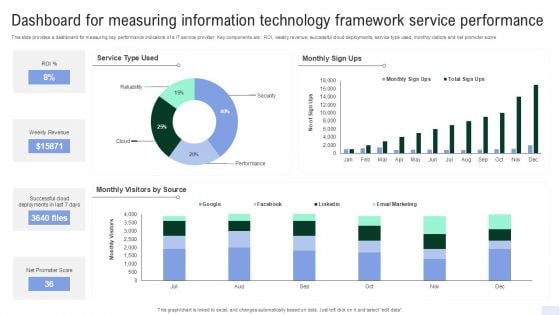
Dashboard For Measuring Information Technology Framework Service Performance Ideas PDF
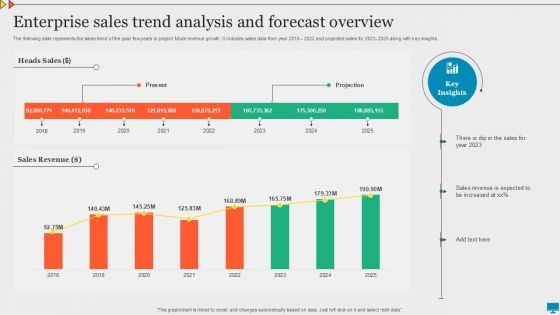
Enterprise Sales Trend Analysis And Forecast Overview Summary PDF
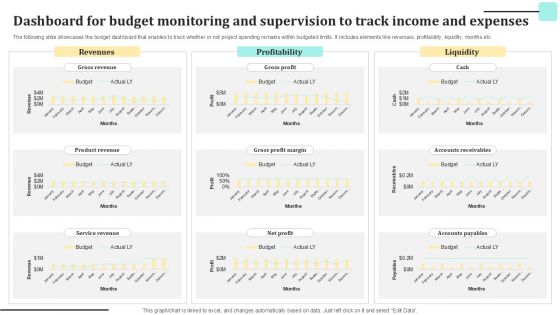
Dashboard For Budget Monitoring And Supervision To Track Income And Expenses Guidelines PDF
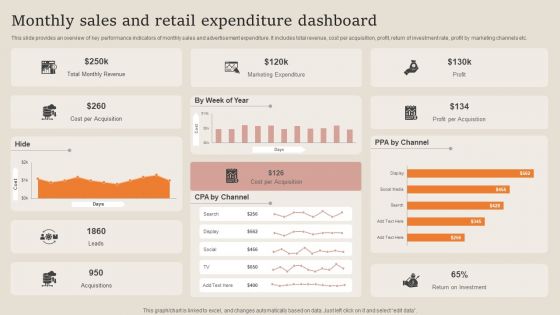
Monthly Sales And Retail Expenditure Dashboard Summary PDF
This slide provides an overview of key performance indicators of monthly sales and advertisement expenditure. It includes total revenue, cost per acquisition, profit, return of investment rate, profit by marketing channels etc. Pitch your topic with ease and precision using this Monthly Sales And Retail Expenditure Dashboard Summary PDF. This layout presents information on Marketing Expenditure, Revenue, Cost Per Acquisition. It is also available for immediate download and adjustment. So, changes can be made in the color, design, graphics or any other component to create a unique layout.
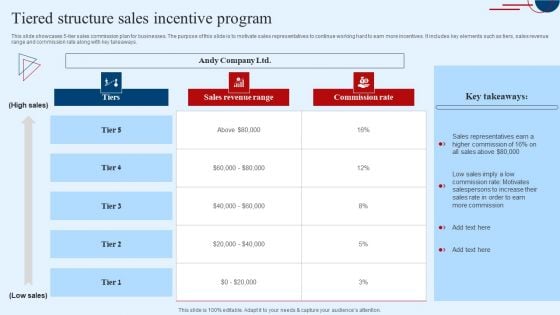
Tiered Structure Sales Incentive Program Mockup PDF
This slide showcases 5 tier sales commission plan for businesses. The purpose of this slide is to motivate sales representatives to continue working hard to earn more incentives. It includes key elements such as tiers, sales revenue range and commission rate along with key takeaways.Pitch your topic with ease and precision using this Tiered Structure Sales Incentive Program Mockup PDF. This layout presents information on Sales Revenue Range, Commission Rate. It is also available for immediate download and adjustment. So, changes can be made in the color, design, graphics or any other component to create a unique layout.


 Continue with Email

 Home
Home


