Financial Goals
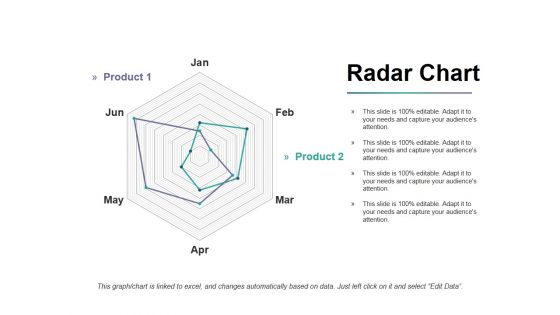
Radar Chart Ppt PowerPoint Presentation Infographics Portfolio
This is a radar chart ppt powerpoint presentation infographics portfolio. This is a two stage process. The stages in this process are product, finance, shapes, business, marketing.
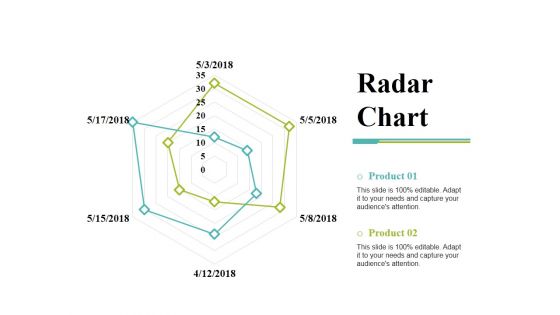
Radar Chart Ppt PowerPoint Presentation Gallery Templates
This is a radar chart ppt powerpoint presentation gallery templates. This is a two stage process. The stages in this process are radar chart, product, shape, business.
Stock Chart Ppt PowerPoint Presentation Icon Format
This is a stock chart ppt powerpoint presentation icon format. This is a two stage process. The stages in this process are product, close, high, volume, low.
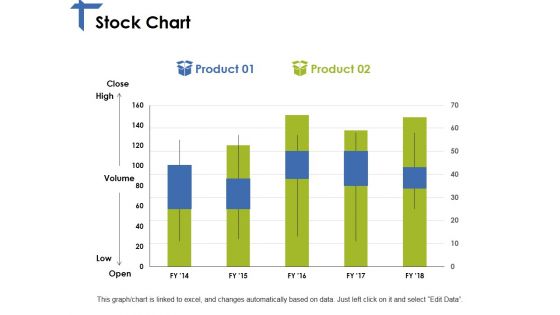
Stock Chart Ppt PowerPoint Presentation Slides Graphics Pictures
This is a stock chart ppt powerpoint presentation slides graphics pictures. This is a two stage process. The stages in this process are product, high, volume, low, open.

Radar Chart Ppt PowerPoint Presentation Ideas Portrait
This is a radar chart ppt powerpoint presentation ideas portrait. This is a two stage process. The stages in this process are product, radar chart, finance, business, marketing.
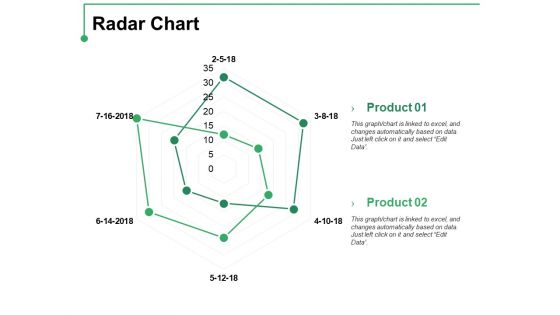
Radar Chart Ppt PowerPoint Presentation Pictures Themes
This is a radar chart ppt powerpoint presentation pictures themes. This is a two stage process. The stages in this process are product, radar chart, finance, business.

Radar Chart Ppt PowerPoint Presentation Show Guidelines
This is a radar chart ppt powerpoint presentation show guidelines. This is a two stage process. The stages in this process are product, radar chart, business, finance, marketing.
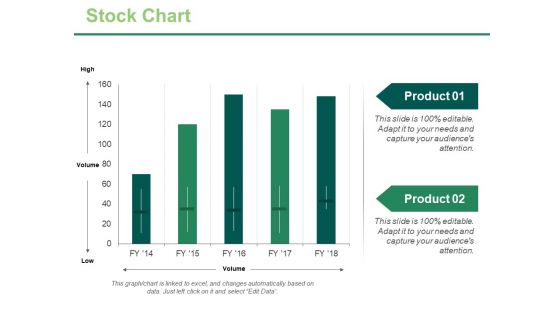
Stock Chart Ppt PowerPoint Presentation Ideas Infographics
This is a stock chart ppt powerpoint presentation ideas infographics. This is a two stage process. The stages in this process are high, volume, low, product, stock chart.
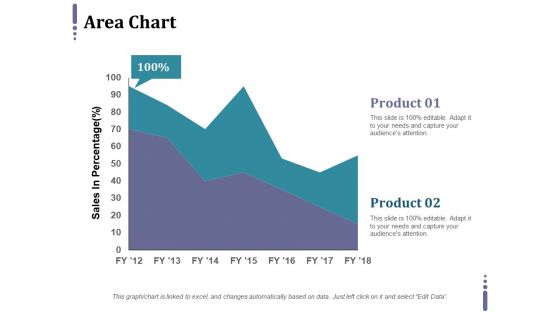
Area Chart Ppt PowerPoint Presentation Professional Grid
This is a area chart ppt powerpoint presentation professional grid. This is a two stage process. The stages in this process are product, sales in percentage, business.
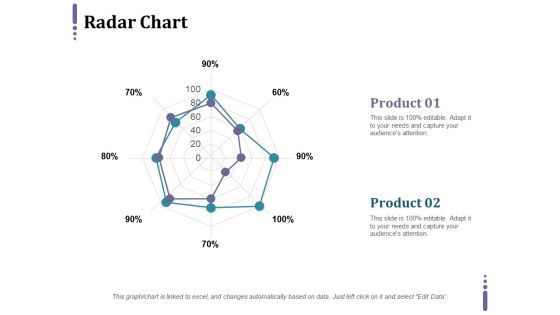
Radar Chart Ppt PowerPoint Presentation Styles Themes
This is a radar chart ppt powerpoint presentation styles themes. This is a two stage process. The stages in this process are product, finance, shape, radar chart, business.
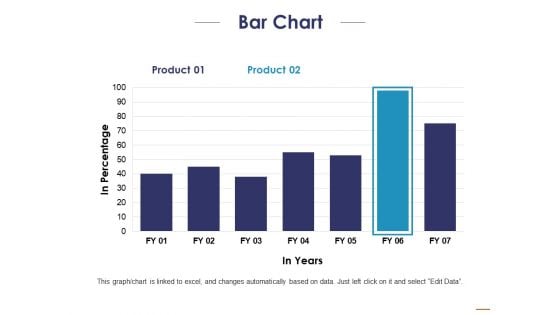
Bar Chart Ppt PowerPoint Presentation Portfolio Inspiration
This is a bar chart ppt powerpoint presentation portfolio inspiration. This is a two stage process. The stages in this process are product, in percentage, in years.
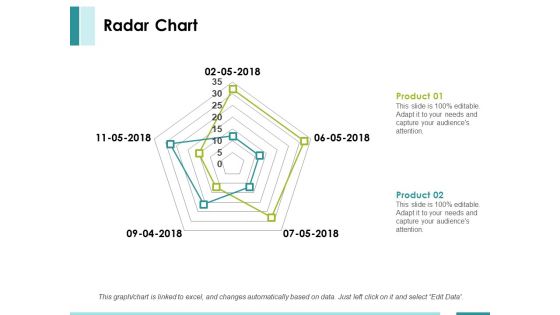
Radar Chart Ppt PowerPoint Presentation Summary Layout
This is a radar chart ppt powerpoint presentation summary layout. This is a two stage process. The stages in this process are product, finance, shape, radar chart, business.
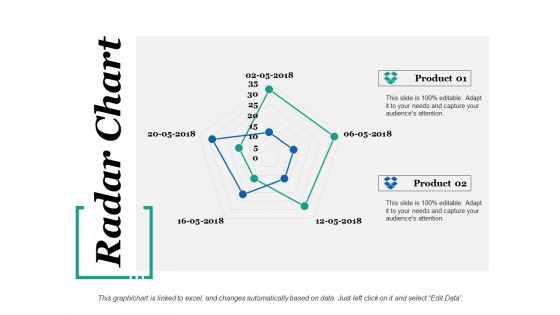
Radar Chart Ppt PowerPoint Presentation File Rules
This is a radar chart ppt powerpoint presentation file rules. This is a two stage process. The stages in this process are product, radar chart, finance.
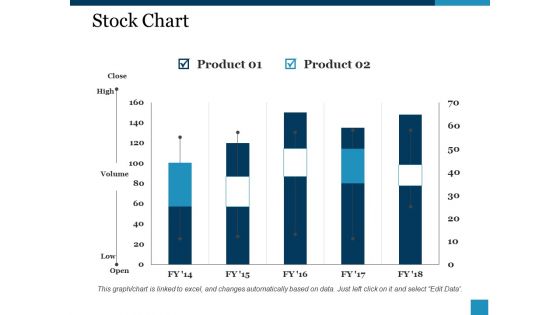
Stock Chart Ppt PowerPoint Presentation Guide
This is a stock chart ppt powerpoint presentation guide. This is a two stage process. The stages in this process are product, close, high, volume, low.
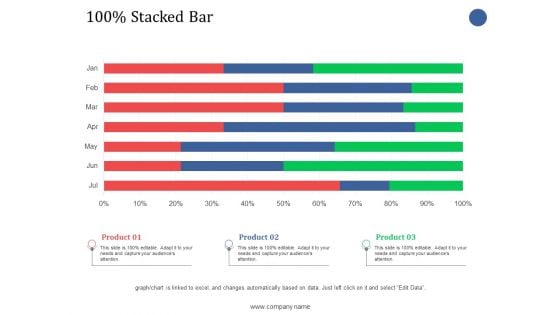
Stacked Bar Ppt PowerPoint Presentation Infographic Template Graphics
This is a stacked bar ppt powerpoint presentation infographic template graphics. This is a three stage process. The stages in this process are stacked bar, finance, product, business.
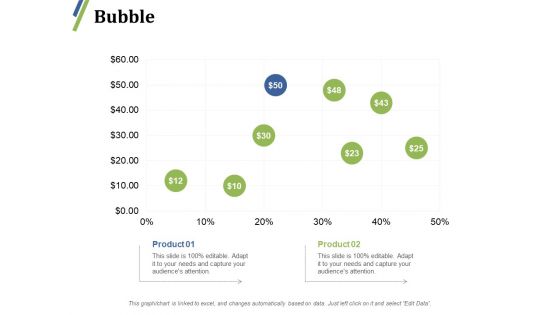
Bubble Ppt PowerPoint Presentation Professional Background Image
This is a bubble ppt powerpoint presentation professional background image. This is a two stage process. The stages in this process are bubble, product, finance, percentage, dollar.
Stacked Bar Ppt PowerPoint Presentation Icon Layouts
This is a stacked bar ppt powerpoint presentation icon layouts.This is a three stage process. The stages in this process are stacked bar, product, business, management, marketing.
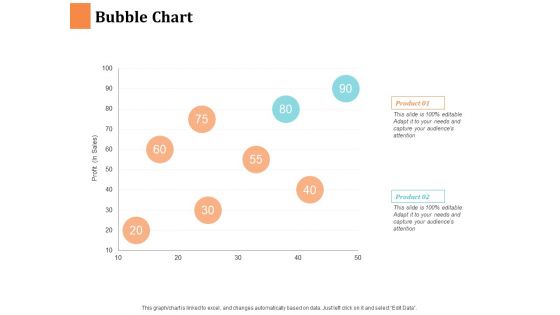
Bubble Chart Ppt PowerPoint Presentation Show Microsoft
This is a bubble chart ppt powerpoint presentation show microsoft. This is a two stage process. The stages in this process are bubble chart, product, business, management, marketing.

Clustered Column Line Ppt PowerPoint Presentation Styles Elements
This is a clustered column line ppt powerpoint presentation styles elements. This is a two stage process. The stages in this process are product, percentage, management, marketing.
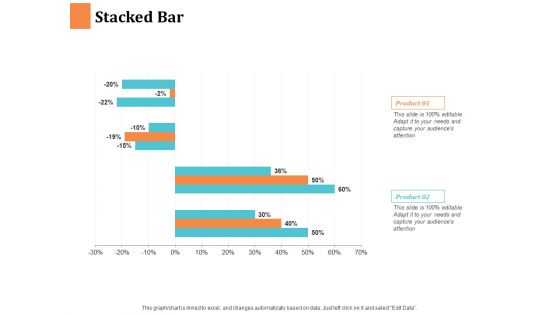
Stacked Bar Ppt PowerPoint Presentation Visual Aids Pictures
This is a stacked bar ppt powerpoint presentation visual aids pictures. This is a two stage process. The stages in this process are product, percentage, finance, business, marketing.
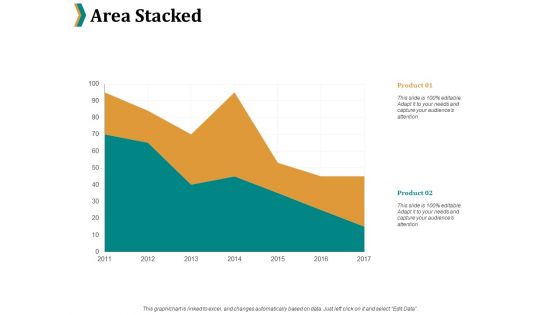
Area Stacked Ppt PowerPoint Presentation Show Structure
This is a area stacked ppt powerpoint presentation show structure. This is a two two stage process. The stages in this process are product, percentage, marketing, business.
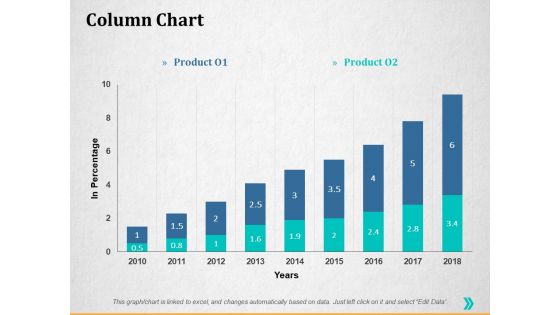
Column Chart Ppt PowerPoint Presentation Infographics Graphics Template
This is a column chart ppt powerpoint presentation infographics graphics template. This is a two stage process. The stages in this process are percentage, product, business, management, marketing.
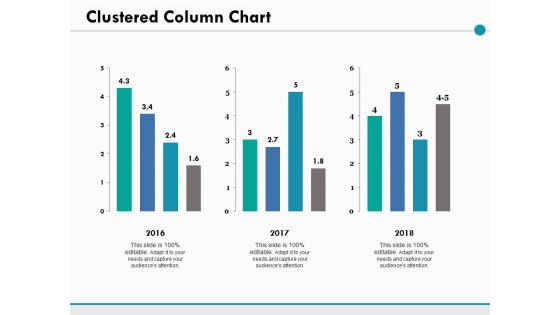
Clustered Column Chart Ppt PowerPoint Presentation Ideas Picture
This is a clustered column chart ppt powerpoint presentation ideas picture. This is a three stage process. The stages in this process are percentage, product, management, marketing.
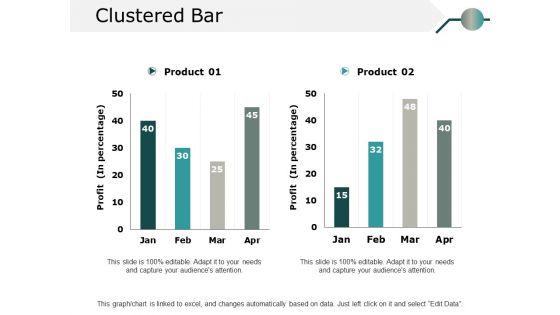
Clustered Bar Ppt PowerPoint Presentation Summary Elements
This is a clustered bar ppt powerpoint presentation summary elements. This is a two stage process. The stages in this process are percentage, product, business, marketing.
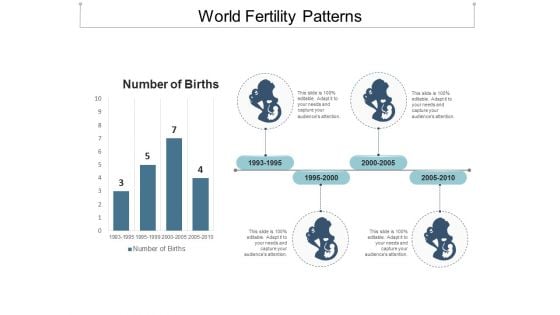
World Fertility Patterns Ppt Powerpoint Presentation Gallery Smartart
This is a world fertility patterns ppt powerpoint presentation gallery smartart. This is a four stage process. The stages in this process are fertility, productiveness, fecundity.
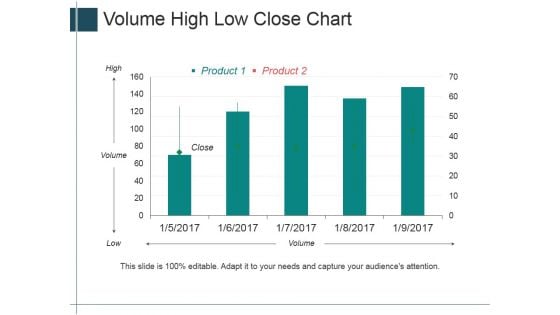
Volume High Low Close Chart Ppt PowerPoint Presentation Summary Layout Ideas
This is a volume high low close chart ppt powerpoint presentation summary layout ideas. This is a five stage process. The stages in this process are high, volume, low, close, product.
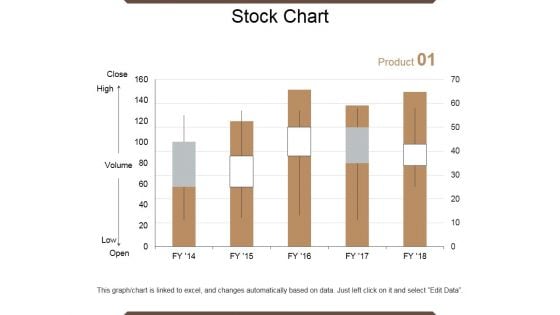
Stock Chart Ppt PowerPoint Presentation Outline Graphics Example
This is a stock chart ppt powerpoint presentation outline graphics example. This is a five stage process. The stages in this process are close, volume, low, high, open, product.
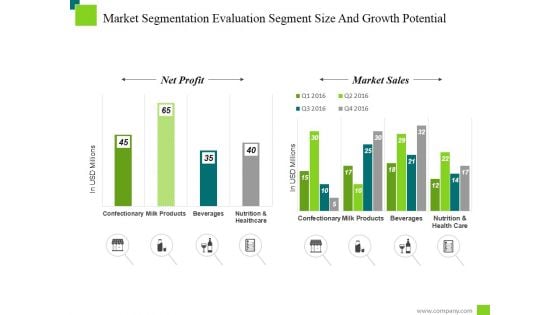
Market Segmentation Evaluation Segment Size And Growth Potential Ppt PowerPoint Presentation Model
This is a market segmentation evaluation segment size and growth potential ppt powerpoint presentation model. This is a two stage process. The stages in this process are net profit, market sales, milk products, confectionary.
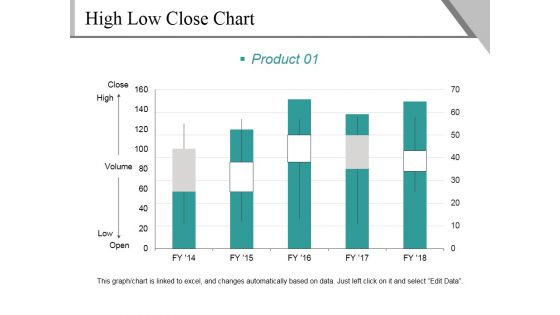
High Low Close Chart Template 1 Ppt PowerPoint Presentation Infographics Graphics Design
This is a high low close chart template 1 ppt powerpoint presentation infographics graphics design. This is a five stage process. The stages in this process are close, high, volume, low, open, product.
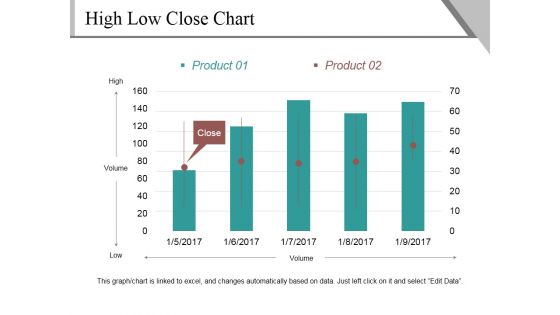
High Low Close Chart Template 2 Ppt PowerPoint Presentation Outline Show
This is a high low close chart template 2 ppt powerpoint presentation outline show. This is a five stage process. The stages in this process are high, volume, low, close, product.

Clustered Column Line Ppt PowerPoint Presentation Slide
This is a clustered column line ppt powerpoint presentation slide. This is a three stage process. The stages in this process are bar graph, growth, finance, product, sales in percentage.
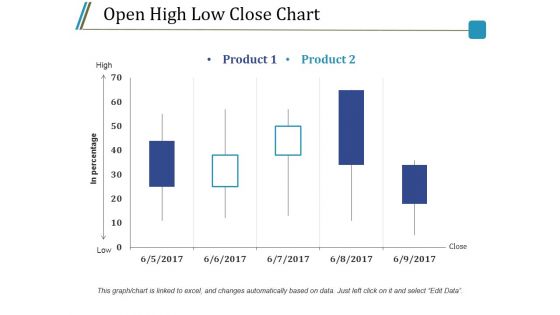
Open High Low Close Chart Ppt PowerPoint Presentation Styles Model
This is a open high low close chart ppt powerpoint presentation styles model. This is a five stage process. The stages in this process are product, high, low, in percentage, close.
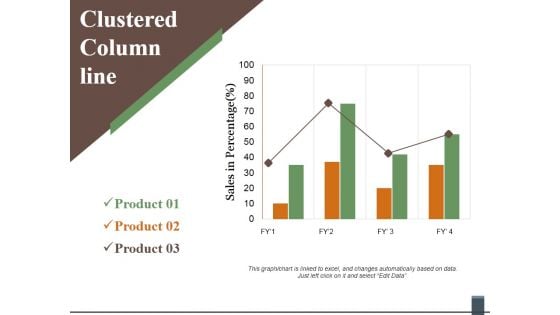
Clustered Column Line Ppt PowerPoint Presentation Inspiration Guidelines
This is a clustered column line ppt powerpoint presentation inspiration guidelines. This is a three stage process. The stages in this process are product, sales in percentage, graph, line, finance, business.
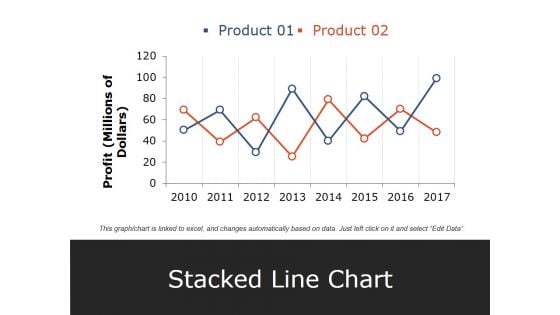
Stacked Line Chart Ppt PowerPoint Presentation Pictures Elements
This is a stacked line chart ppt powerpoint presentation pictures elements. This is a two stage process. The stages in this process are product, profit, stacked line chart, year, business.
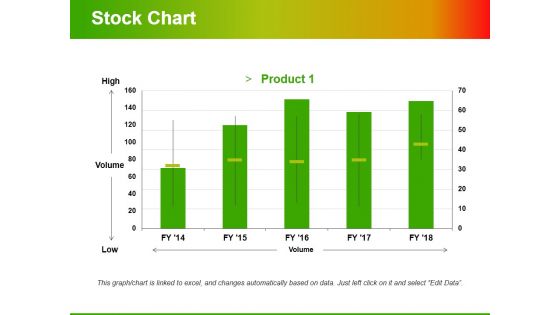
Stock Chart Template 2 Ppt PowerPoint Presentation Infographic Template Styles
This is a stock chart template 2 ppt powerpoint presentation infographic template styles. This is a one stage process. The stages in this process are high, volume, low, product, volume.
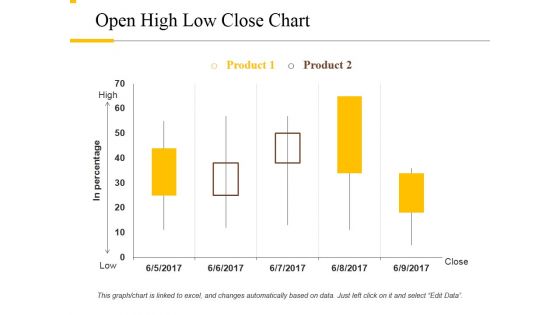
Open High Low Close Chart Ppt PowerPoint Presentation Outline Rules
This is a open high low close chart ppt powerpoint presentation outline rules. This is a two stage process. The stages in this process are product, high, low, close, in percentage.
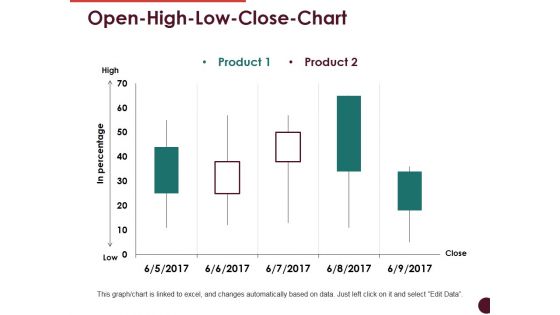
Open High Low Close Chart Ppt PowerPoint Presentation Professional Visuals
This is a open high low close chart ppt powerpoint presentation professional visuals. This is a two stage process. The stages in this process are high, low, in percentage, product, close.
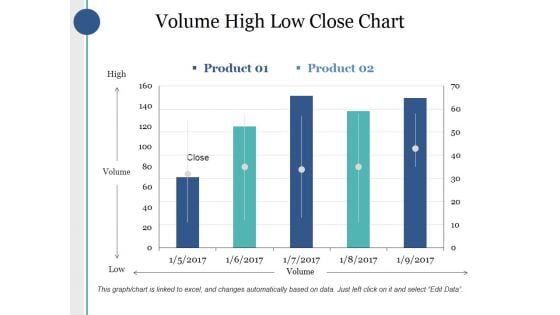
Volume High Low Close Chart Ppt PowerPoint Presentation Infographics Good
This is a volume high low close chart ppt powerpoint presentation infographics good. This is a two stage process. The stages in this process are high, volume, low, product, close.
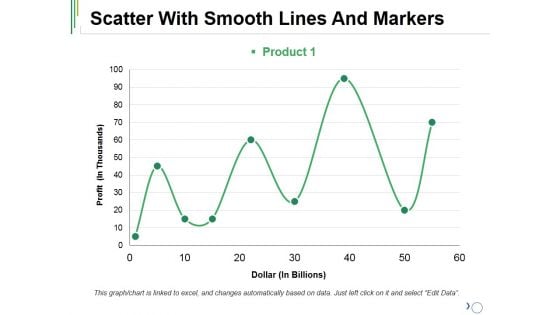
Scatter With Smooth Lines And Markers Ppt PowerPoint Presentation Outline Mockup
This is a scatter with smooth lines and markers ppt powerpoint presentation outline mockup. This is a one stage process. The stages in this process are product, finance, line graph, business, management.
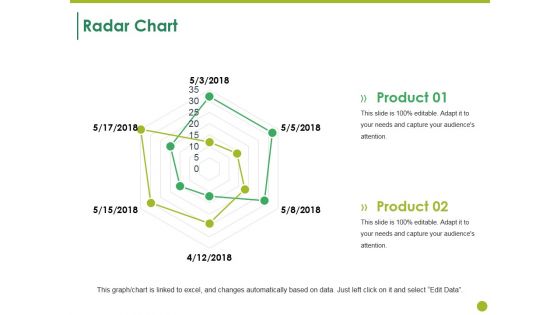
Radar Chart Ppt PowerPoint Presentation Summary Design Templates
This is a radar chart ppt powerpoint presentation summary design templates. This is a two stage process. The stages in this process are radar chart, product, shapes, business, marketing.

Radar Chart Ppt PowerPoint Presentation Inspiration Infographic Template
This is a radar chart ppt powerpoint presentation inspiration infographic template. This is a two stage process. The stages in this process are radar chart, product, business, finance, marketing.
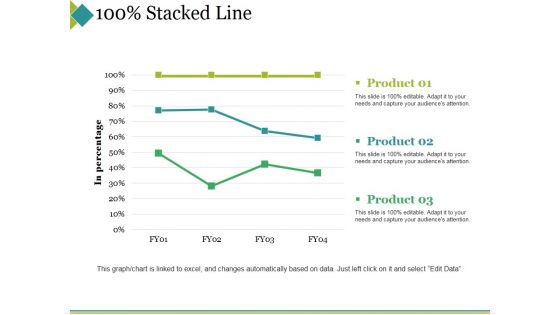
Stacked Line Ppt PowerPoint Presentation Professional Background Designs
This is a stacked line ppt powerpoint presentation professional background designs. This is a three stage process. The stages in this process are product, in percentage, stacked line, finance, business.

Radar Chart Ppt PowerPoint Presentation Infographics Visual Aids
This is a radar chart ppt powerpoint presentation infographics visual aids. This is a two stage process. The stages in this process are radar chart, product, finance, business, marketing.
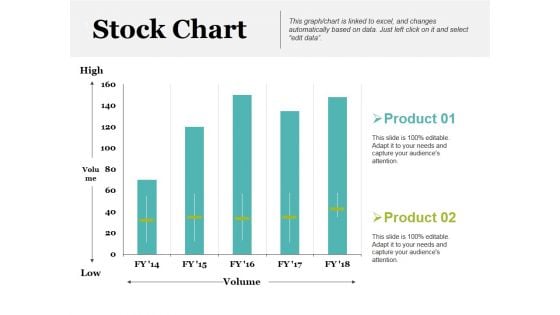
Stock Chart Ppt PowerPoint Presentation Inspiration Example Introduction
This is a stock chart ppt powerpoint presentation inspiration example introduction. This is a two stage process. The stages in this process are product, high, volume, low, stock chart.
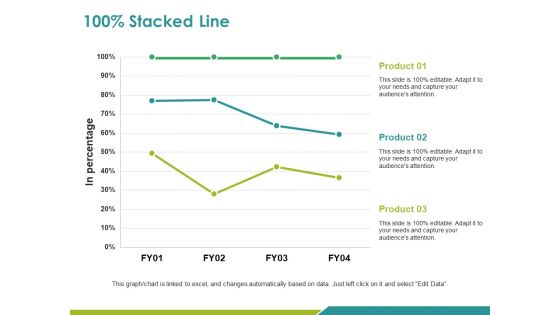
Stacked Line Ppt PowerPoint Presentation Pictures Example Topics
This is a stacked line ppt powerpoint presentation pictures example topics. This is a three stage process. The stages in this process are product, in percentage, stacked line, business, marketing.
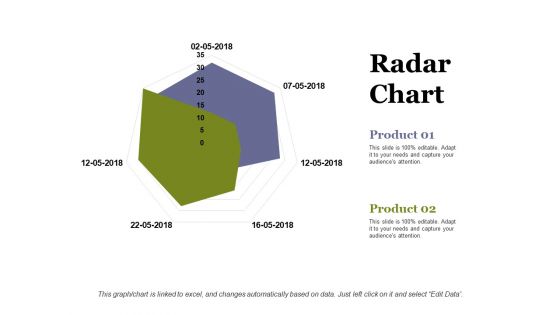
Radar Chart Ppt PowerPoint Presentation Infographic Template Information
This is a radar chart ppt powerpoint presentation infographic template information. This is a two stage process. The stages in this process are radar chart, product, business, marketing, shape.
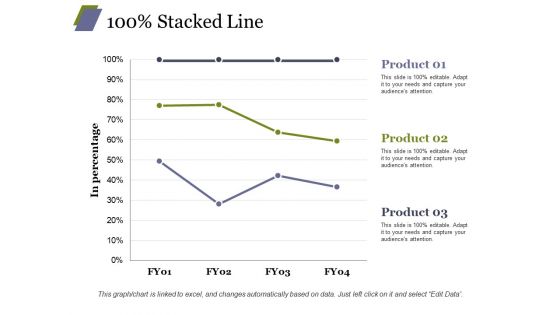
Stacked Line Ppt PowerPoint Presentation Infographics Vector
This is a stacked line ppt powerpoint presentation infographics vector. This is a three stage process. The stages in this process are product, stacked line, business, marketing, in percentage.
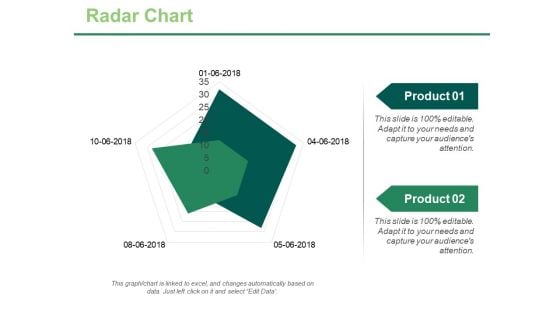
Radar Chart Ppt PowerPoint Presentation Portfolio Graphics Template
This is a radar chart ppt powerpoint presentation portfolio graphics template. This is a two stage process. The stages in this process are product, finance, shape, radar chart, business.

Radar Chart Ppt PowerPoint Presentation Professional Infographic Template
This is a radar chart ppt powerpoint presentation professional infographic template. This is a two stage process. The stages in this process are product, finance, shape, radar chart, business.
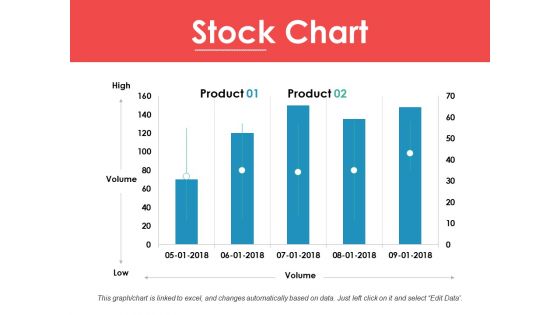
Stock Chart Ppt PowerPoint Presentation Ideas Infographic Template
This is a stock chart ppt powerpoint presentation ideas infographic template. This is a two stage process. The stages in this process are high, volume, low, product, stock chart.
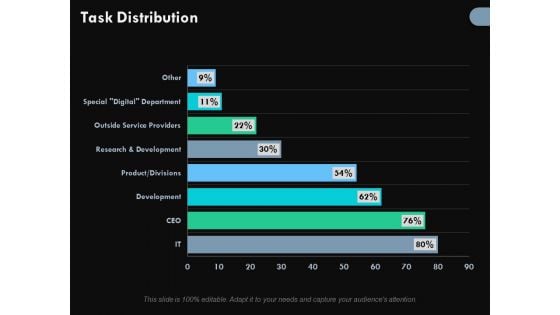
Task Distribution Ppt PowerPoint Presentation Design Ideas
This is a task distribution ppt powerpoint presentation design ideas. This is a eight stage process. The stages in this process are outside service providers, research and development, product, divisions, percentage.
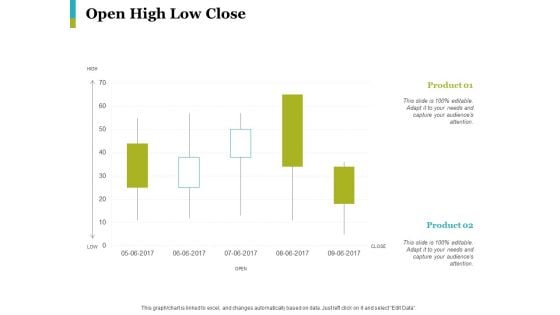
Open High Low Close Ppt PowerPoint Presentation Styles Graphics Example
This is a open high low close ppt powerpoint presentation styles graphics example.This is a two stage process. The stages in this process are product, percentage, chart, management, marketing.
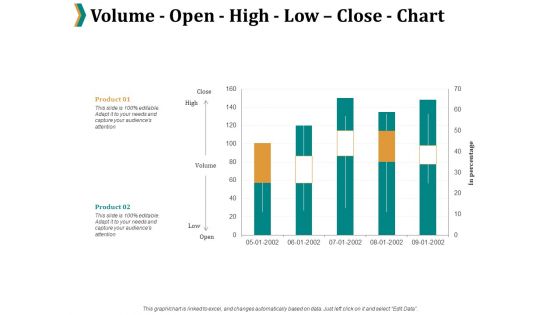
Volume Open High Low Close Chart Ppt PowerPoint Presentation Professional Maker
This is a volume open high low close chart ppt powerpoint presentation professional maker. This is a two stage process. The stages in this process are percentage, product, marketing.
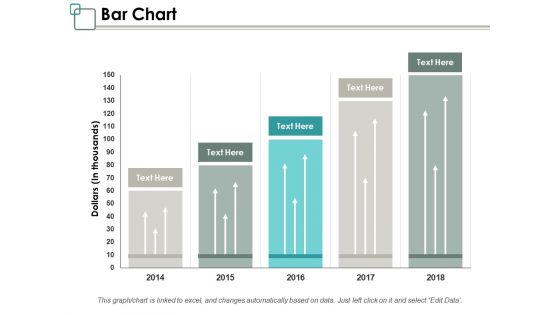
Bar Chart Ppt PowerPoint Presentation Infographic Template Graphics Design
This is a bar chart ppt powerpoint presentation infographic template graphics design. This is a five stage process. The stages in this process are management, marketing, business, percentage, product.

5 Step Sales Process Ppt PowerPoint Presentation Inspiration Styles Cpb
This is a 5 step sales process ppt powerpoint presentation inspiration styles cpb. This is a three stage process. The stages in this process are percentage, product, business, management, marketing.
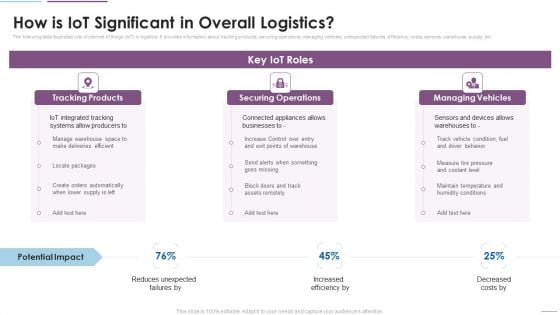
Supply Chain Management How Is Iot Significant In Overall Logistics Ideas PDF
The following slide illustrates role of internet of things IoT in logistics. It provides information about tracking products, securing operations, managing vehicles, unexpected failures, efficiency, costs, sensors, warehouse, supply, etc. Presenting Supply Chain Management How Is Iot Significant In Overall Logistics Ideas PDF to provide visual cues and insights. Share and navigate important information on three stages that need your due attention. This template can be used to pitch topics like Tracking Products, Securing Operations, Managing Vehicles. In addtion, this PPT design contains high resolution images, graphics, etc, that are easily editable and available for immediate download.

Strategies To Enter Physical Fitness Club Business Corporate Wellness Statistics Inspiration PDF
This slide states that Healthy work force means more positivity in the office, reduced medical costs and more overall productivity. This is a strategies to enter physical fitness club business corporate wellness statistics inspiration pdf template with various stages. Focus and dispense information on three stages using this creative set, that comes with editable features. It contains large content boxes to add your information on topics like companies, employees, health, management, achievement. You can also showcase facts, figures, and other relevant content using this PPT layout. Grab it now.
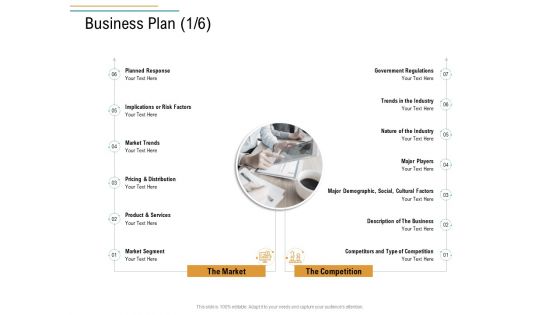
Business Operations Assessment Business Plan Ppt Infographic Template Microsoft PDF
This is a business operations assessment business plan ppt infographic template microsoft pdf template with various stages. Focus and dispense information on seven stages using this creative set, that comes with editable features. It contains large content boxes to add your information on topics like planned response, implications or risk factors, market trends, pricing and distribution, product and services, market segment, government regulations, trends industry, nature industry. You can also showcase facts, figures, and other relevant content using this PPT layout. Grab it now.
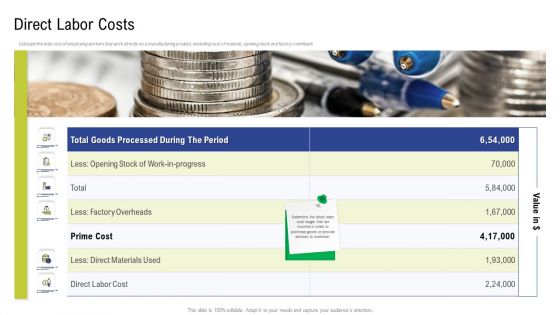
Factory Costs Components Direct Labor Costs Ppt Inspiration Graphics Example PDF
Calculate the total cost of employing workers that work directly on a manufacturing product, excluding cost of material, opening stock and factory overheads.Presenting factory costs components direct labor costs ppt inspiration graphics example pdf. to provide visual cues and insights. Share and navigate important information on six stages that need your due attention. This template can be used to pitch topics like total goods processed during the period, prime cost. In addtion, this PPT design contains high resolution images, graphics, etc, that are easily editable and available for immediate download.
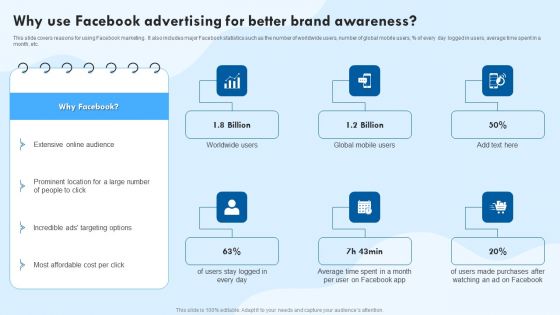
Why Use Facebook Advertising For Better Brand Awareness Ppt Ideas Design Templates PDF
This slide covers reasons for using Facebook marketing. It also includes major Facebook statistics such as the number of worldwide users, number of global mobile users, percent of every day logged in users, average time spent in a month, etc. Power up your presentations with our Why Use Facebook Advertising For Better Brand Awareness Ppt Ideas Design Templates PDF single-slide PPT template. Our visually-stunning template will help you deliver your message with confidence. With easy-to-use editing options and fully customizable features, you can create polished and captivating presentations in no time. Say goodbye to boring slides and hello to impactful presentations with our top-quality template. Download now and get ready to wow your audience. singles.


 Continue with Email

 Home
Home


