Financial Graphs
Bar Graph Icon Showing Operating Rhythm Ppt Powerpoint Presentation Ideas Templates
This is a bar graph icon showing operating rhythm ppt powerpoint presentation ideas templates. This is a three stage process. The stages in this process are six sigma, operating rhythm, business rhythm.
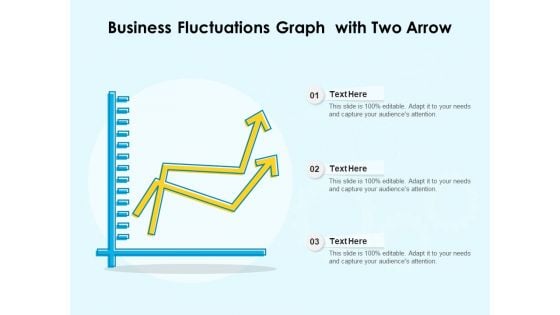
Business Fluctuations Graph With Two Arrow Ppt PowerPoint Presentation Tips PDF
Persuade your audience using this business fluctuations graph with two arrow ppt powerpoint presentation tips pdf. This PPT design covers three stages, thus making it a great tool to use. It also caters to a variety of topics including business fluctuations graph with two arrow. Download this PPT design now to present a convincing pitch that not only emphasizes the topic but also showcases your presentation skills.

Stock Market Growth Rate Graph Image Ppt PowerPoint Presentation Professional Influencers PDF
Persuade your audience using this stock market growth rate graph image ppt powerpoint presentation professional influencers pdf. This PPT design covers two stages, thus making it a great tool to use. It also caters to a variety of topics including stock market growth rate graph image. Download this PPT design now to present a convincing pitch that not only emphasizes the topic but also showcases your presentation skills.
Bar Graph With Arrows For Data Representation Vector Icon Ppt PowerPoint Presentation Summary Picture PDF
Presenting bar graph with arrows for data representation vector icon ppt powerpoint presentation summary picture pdf to dispense important information. This template comprises three stages. It also presents valuable insights into the topics including bar graph with arrows for data representation vector icon. This is a completely customizable PowerPoint theme that can be put to use immediately. So, download it and address the topic impactfully.
Service Level Agreement KPI Dashboard With Graph And Analytics Icon Inspiration PDF
Persuade your audience using this Service Level Agreement KPI Dashboard With Graph And Analytics Icon Inspiration PDF. This PPT design covers three stages, thus making it a great tool to use. It also caters to a variety of topics including Service Level, Agreement KPI Dashboard, Graph And Analytics, Icon. Download this PPT design now to present a convincing pitch that not only emphasizes the topic but also showcases your presentation skills.
Graph Icon For Quick And Current Liquidity Ratio Analysis Template PDF
Persuade your audience using this Graph Icon For Quick And Current Liquidity Ratio Analysis Template PDF. This PPT design covers Three stages, thus making it a great tool to use. It also caters to a variety of topics including Graph Icon, Quick And Current, Liquidity Ratio Analysis. Download this PPT design now to present a convincing pitch that not only emphasizes the topic but also showcases your presentation skills.
Digital Money Cash Inflow And Outflow Icon Ppt PowerPoint Presentation Diagram Graph Charts PDF
Presenting Digital Money Cash Inflow And Outflow Icon Ppt PowerPoint Presentation Diagram Graph Charts PDF to dispense important information. This template comprises three stages. It also presents valuable insights into the topics including Digital Money, Cash Inflow, Outflow Icon. This is a completely customizable PowerPoint theme that can be put to use immediately. So, download it and address the topic impactfully.
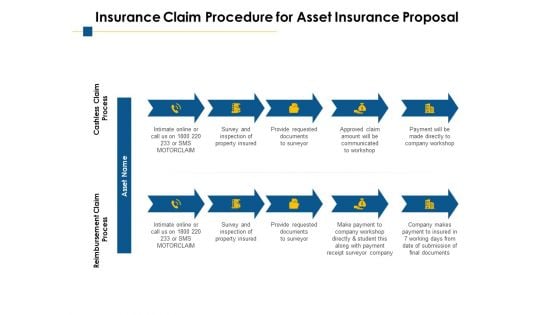
Insurance Claim Procedure For Asset Insurance Proposal Ppt PowerPoint Presentation Diagram Graph Charts
Presenting this set of slides with name insurance claim procedure for asset insurance proposal ppt powerpoint presentation diagram graph charts. This is a ten stage process. The stages in this process are reimbursement claim process, cashless claim process, asset. This is a completely editable PowerPoint presentation and is available for immediate download. Download now and impress your audience.
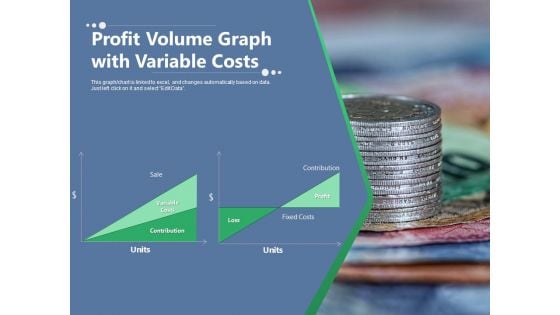
Profit Volume Graph With Variable Costs Ppt PowerPoint Presentation Outline Brochure PDF
Presenting this set of slides with name profit volume graph with variable costs ppt powerpoint presentation outline brochure pdf. This is a one stage process. The stages in this process are sale, contribution, variable costs, profit, fixed costs, loss, units. This is a completely editable PowerPoint presentation and is available for immediate download. Download now and impress your audience.
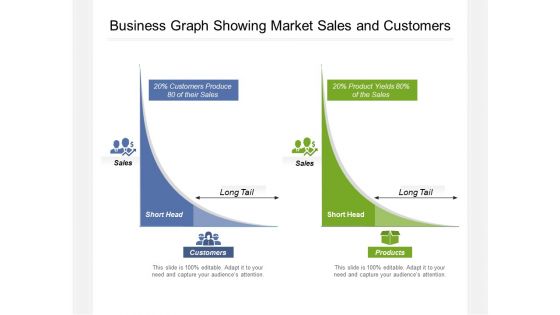
Business Graph Showing Market Sales And Customers Ppt PowerPoint Presentation Ideas Inspiration PDF
Presenting this set of slides with name business graph showing market sales and customers ppt powerpoint presentation ideas inspiration pdf. This is a two stage process. The stages in this process are Short Head, Customers, Sales, Long Tail, Short Head, Products. This is a completely editable PowerPoint presentation and is available for immediate download. Download now and impress your audience.
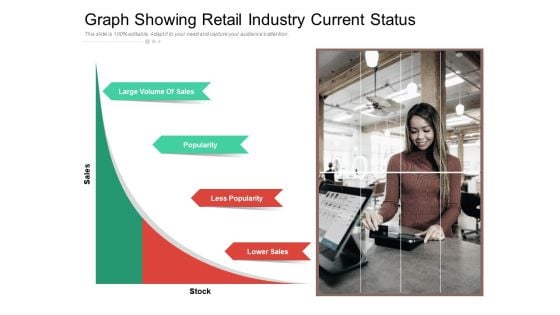
Graph Showing Retail Industry Current Status Ppt PowerPoint Presentation Styles Design Inspiration PDF
Presenting this set of slides with name graph showing retail industry current status ppt powerpoint presentation styles design inspiration pdf. This is a one stage process. The stages in this process are large volume of sales, popularity, less popularity, lower sales, stock, sales. This is a completely editable PowerPoint presentation and is available for immediate download. Download now and impress your audience.
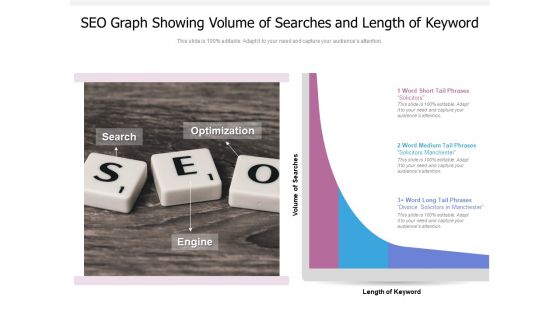
SEO Graph Showing Volume Of Searches And Length Of Keyword Ppt PowerPoint Presentation File Layouts PDF
Presenting this set of slides with name seo graph showing volume of searches and length of keyword ppt powerpoint presentation file layouts pdf. This is a three stage process. The stages in this process are search, optimization, engine, length of keyword, volume of searches. This is a completely editable PowerPoint presentation and is available for immediate download. Download now and impress your audience.
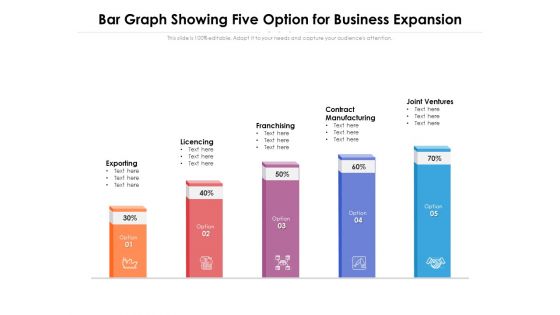
Bar Graph Showing Five Option For Business Expansion Ppt PowerPoint Presentation Portfolio Brochure PDF
Presenting this set of slides with name bar graph showing five option for business expansion ppt powerpoint presentation portfolio brochure pdf. This is a five stage process. The stages in this process are exporting, licencing, franchising, contract manufacturing, joint ventures. This is a completely editable PowerPoint presentation and is available for immediate download. Download now and impress your audience.
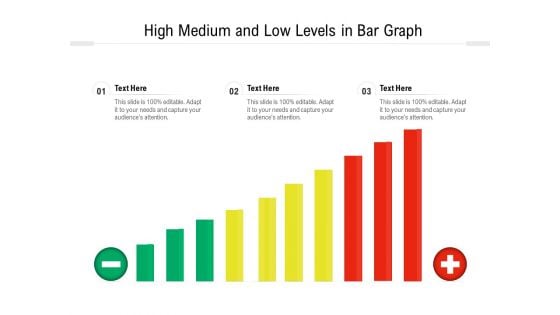
High Medium And Low Levels In Bar Graph Ppt PowerPoint Presentation Professional Design Ideas PDF
Presenting high medium and low levels in bar graph ppt powerpoint presentation professional design ideas pdf to dispense important information. This template comprises one stages. It also presents valuable insights into the topics including low, medium, high. This is a completely customizable PowerPoint theme that can be put to use immediately. So, download it and address the topic impactfully.
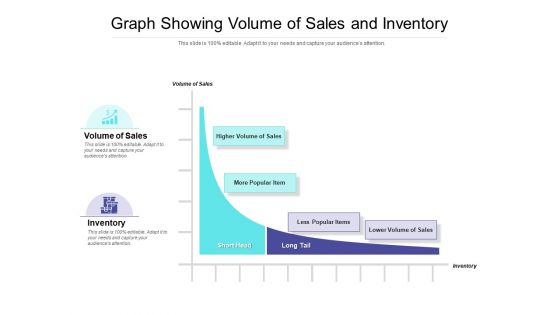
Graph Showing Volume Of Sales And Inventory Ppt PowerPoint Presentation Outline Professional PDF
Presenting this set of slides with name graph showing volume of sales and inventory ppt powerpoint presentation outline professional pdf. This is a two stage process. The stages in this process are volume of sales, inventory, higher volume of sales, higher volume of sales, less popular items, lower volume of sales. This is a completely editable PowerPoint presentation and is available for immediate download. Download now and impress your audience.
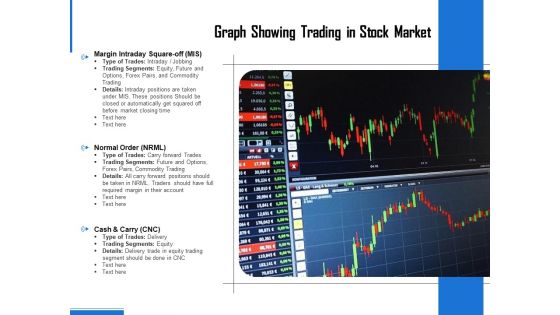
Graph Showing Trading In Stock Market Ppt PowerPoint Presentation Professional Backgrounds PDF
Persuade your audience using this graph showing trading in stock market ppt powerpoint presentation professional backgrounds pdf. This PPT design covers one stages, thus making it a great tool to use. It also caters to a variety of topics including margin intraday square off mis, normal order nrml, cash and carry cnc. Download this PPT design now to present a convincing pitch that not only emphasizes the topic but also showcases your presentation skills.
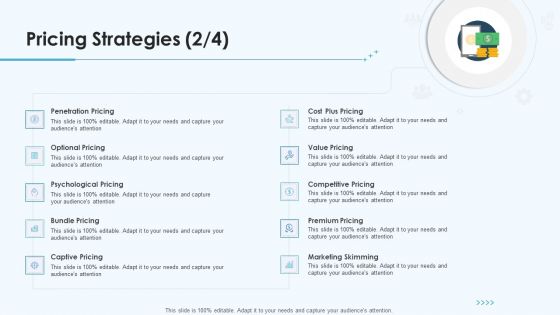
Product Pricing Strategies Pricing Strategies Skimming Ppt Diagram Graph Charts PDF
This is a product pricing strategies pricing strategies skimming ppt diagram graph charts pdf template with various stages. Focus and dispense information on ten stages using this creative set, that comes with editable features. It contains large content boxes to add your information on topics like psychological pricing, captive pricing, marketing skimming, premium pricing, value pricing. You can also showcase facts, figures, and other relevant content using this PPT layout. Grab it now.
Bar Graph With Dollar Marketing PowerPoint Templates And PowerPoint Themes 1012
Bar Graph with Dollar Marketing PowerPoint Templates And PowerPoint Themes 1012-Emphatically define your message with our above template which contains a graphic of bar graph with dollar notes. This image clearly defines the concept of business statistics and financial reviews. Our stunning image makes your presentations professional showing that you care about even the smallest details. Create captivating presentations to deliver comparative and weighted arguments.-Bar Graph with Dollar Marketing PowerPoint Templates And PowerPoint Themes 1012-This PowerPoint template can be used for presentations relating to-Business graph and dollar, money, finance, success, business, marketing Your career will soar away. Our Bar Graph With Dollar Marketing PowerPoint Templates And PowerPoint Themes 1012 will give it wings.
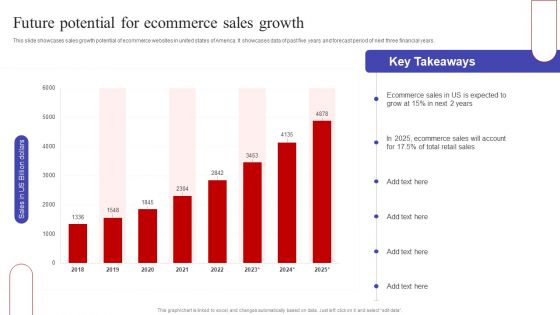
Future Potential For Ecommerce Sales Growth Ppt PowerPoint Presentation Diagram Graph Charts PDF
This slide showcases sales growth potential of ecommerce websites in united states of America. It showcases data of past five years and forecast period of next three financial years. Here you can discover an assortment of the finest PowerPoint and Google Slides templates. With these templates, you can create presentations for a variety of purposes while simultaneously providing your audience with an eye catching visual experience. Download Future Potential For Ecommerce Sales Growth Ppt PowerPoint Presentation Diagram Graph Charts PDF to deliver an impeccable presentation. These templates will make your job of preparing presentations much quicker, yet still, maintain a high level of quality. Slidegeeks has experienced researchers who prepare these templates and write high quality content for you. Later on, you can personalize the content by editing the Future Potential For Ecommerce Sales Growth Ppt PowerPoint Presentation Diagram Graph Charts PDF.
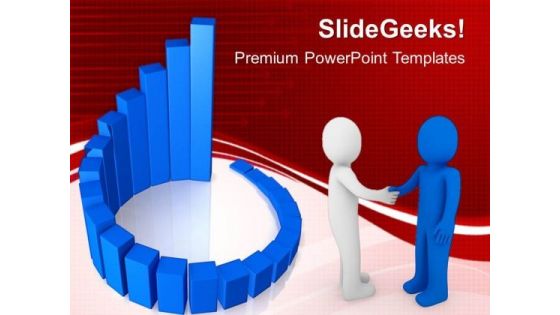
Circular Bar Graph Business Success PowerPoint Templates And PowerPoint Themes 1012
Circular Bar Graph Business Success PowerPoint Templates And PowerPoint Themes 1012-The above template displays a diagram of blue circular progress bars. This image represent the concept of business growth and success. This template imitates economy, finance, global, goal, growth, ideas, information, management, profit and statistics. This image has been conceived to enable you to emphatically communicate your ideas in your Business and Marketing PPT presentations. Use this template for financial analysis, business reviews and statistics. Go ahead and add charm to your presentations with our high quality template.-Circular Bar Graph Business Success PowerPoint Templates And PowerPoint Themes 1012-This PowerPoint template can be used for presentations relating to-Circular success graph, marketing, business, finance, success, circle charts Fashion your plans on our Circular Bar Graph Business Success PowerPoint Templates And PowerPoint Themes 1012. They will always keep you in contention.
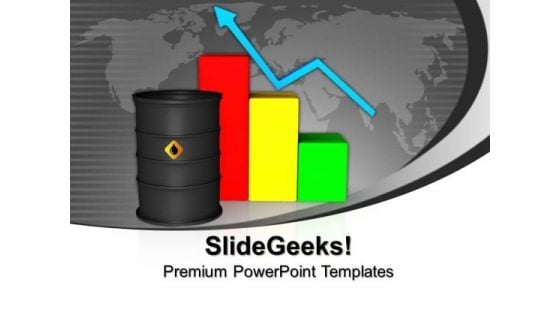
Oil Barrel With Finance Graph Industrial PowerPoint Templates And PowerPoint Themes 1012
The above template displays a diagram of black barrels of oil by a colorful bar graph with an arrow. This image signifies business concept. This image has been conceived to enable you to emphatically communicate your ideas in your Business and Financial PPT presentation. Our PPT images are so perfectly/ideally designed that it reveals the very basis of our PPT template to make your clients understand. Mastermind plans with our Oil Barrel With Finance Graph Industrial PowerPoint Templates And PowerPoint Themes 1012. Download without worries with our money back guaranteee.
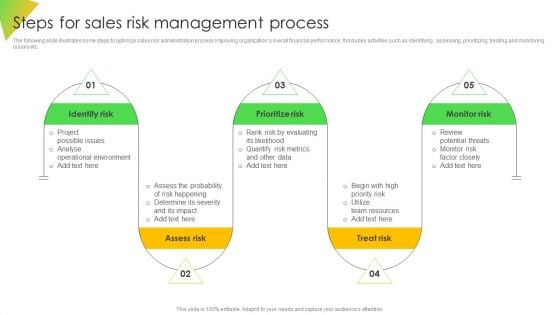
Steps For Sales Risk Management Process Ppt Diagram Graph Charts PDF
The following slide illustrates some steps to optimize sales risk administration process improving organizations overall financial performance. It includes activities such as identifying , assessing, prioritizing, treating and monitoring issues etc. The Steps For Sales Risk Management Process Ppt Diagram Graph Charts PDF is a compilation of the most recent design trends as a series of slides. It is suitable for any subject or industry presentation, containing attractive visuals and photo spots for businesses to clearly express their messages. This template contains a variety of slides for the user to input data, such as structures to contrast two elements, bullet points, and slides for written information. Slidegeeks is prepared to create an impression.
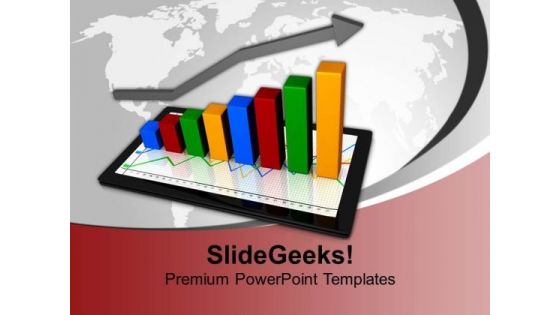
Computer Tablet With Graph Business PowerPoint Templates And PowerPoint Themes 1012
Computer Tablet With Graph Business PowerPoint Templates And PowerPoint Themes 1012-Develop competitive advantage with our above template which contains a diagram of computer tablet with bra graph showing success and growth. It portrays the concept of account, balance, business, data, economy, finance, graph, growth, information, investment, market, profit, report, research, statistics and success. Adjust the above image in your PPT presentations to visually support your content in your Business and Financial PPT slideshows. Present your views using our innovative slides and be assured of leaving a lasting impression.-Computer Tablet With Graph Business PowerPoint Templates And PowerPoint Themes 1012-This PowerPoint template can be used for presentations relating to-Computer Tablet With Graph, Arrows, Finance, Business, Marketing, Symbol Our Computer Tablet With Graph Business PowerPoint Templates And PowerPoint Themes 1012 will keep the faith. They will show allegiance to your thoughts.

Business Graph And Growth Of Money PowerPoint Templates Ppt Backgrounds For Slides 1112
We present our Business Graph And Growth Of Money PowerPoint Templates PPT Backgrounds For Slides 1112.Use our Finance PowerPoint Templates because clarity of thought has been the key to your growth. Present our Success PowerPoint Templates because a healthy person is the esence of a sense of happiness. Download our Money PowerPoint Templates because the graphic is a symbol of growth and success. Download our Future PowerPoint Templates because you can outline your targets to your team. Use our New year PowerPoint Templates because this is a time to reflect and retrospect on successes and failures.Use these PowerPoint slides for presentations relating to 2013 Financial success concept, Finance, Success, Money, Future, New year. The prominent colors used in the PowerPoint template are Yellow, White, Blue. You can be sure our Business Graph And Growth Of Money PowerPoint Templates PPT Backgrounds For Slides 1112 are Elegant. Professionals tell us our Money PowerPoint templates and PPT Slides are Quaint. We assure you our Business Graph And Growth Of Money PowerPoint Templates PPT Backgrounds For Slides 1112 are Detailed. PowerPoint presentation experts tell us our Success PowerPoint templates and PPT Slides are second to none. The feedback we get is that our Business Graph And Growth Of Money PowerPoint Templates PPT Backgrounds For Slides 1112 are Wonderful. PowerPoint presentation experts tell us our concept PowerPoint templates and PPT Slides are Beautiful. Give your audience a feel of your ability. Dole out a dose on our Business Graph And Growth Of Money PowerPoint Templates Ppt Backgrounds For Slides 1112.
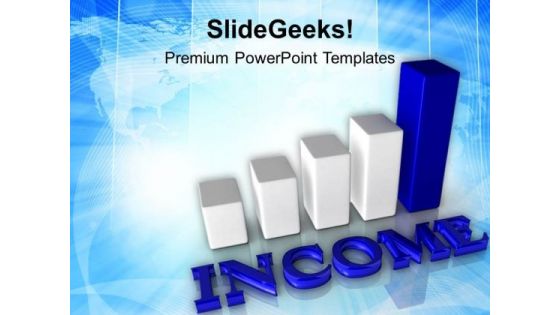
Income Bar Graph Business Analysis PowerPoint Templates Ppt Backgrounds For Slides 0413
We present our Income Bar Graph Business Analysis PowerPoint Templates PPT Backgrounds For Slides 0413.Use our Business PowerPoint Templates because Our PowerPoint Templates and Slides has conjured up a web of all you need with the help of our great team. Use them to string together your glistening ideas. Use our Marketing PowerPoint Templates because You can Score a slam dunk with our PowerPoint Templates and Slides. Watch your audience hang onto your every word. Use our Success PowerPoint Templates because Our PowerPoint Templates and Slides will definately Enhance the stature of your presentation. Adorn the beauty of your thoughts with their colourful backgrounds. Present our Shapes PowerPoint Templates because They will bring a lot to the table. Their alluring flavours will make your audience salivate. Present our Process and Flows PowerPoint Templates because You aspire to touch the sky with glory. Let our PowerPoint Templates and Slides provide the fuel for your ascent.Use these PowerPoint slides for presentations relating to Income financial diagramme, business, marketing, success, shapes, process and flows. The prominent colors used in the PowerPoint template are Gray, White, Blue navy. Assure the faint hearted with our Income Bar Graph Business Analysis PowerPoint Templates Ppt Backgrounds For Slides 0413. Affirm the belief they have in you.
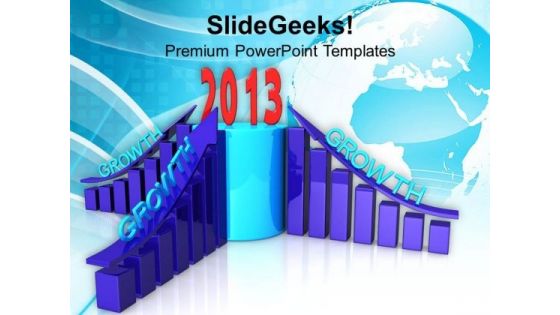
Graph Represents Growth New Year Concept PowerPoint Templates Ppt Backgrounds For Slides 1212
We present our Graph Represents Growth New Year Concept PowerPoint Templates PPT Backgrounds For Slides 1212.Download our New year PowerPoint Templates because this slide can help to bullet point your views. Download and present our Business PowerPoint Templates because this diagram can set an example to enthuse your team with the passion and fervour of your ideas. Download our Success PowerPoint Templates because you can Show them how you can save the day. Download and present our Finance PowerPoint Templates because you envisage some areas of difficulty in the near future. The overall financial situation could be a source of worry. Use our Shapes PowerPoint Templates because motivating your team will cross all barriers.Use these PowerPoint slides for presentations relating to 2013 business graph illustration, business, success, new year, shapes, finance. The prominent colors used in the PowerPoint template are Blue, Blue light, Red. You can be sure our Graph Represents Growth New Year Concept PowerPoint Templates PPT Backgrounds For Slides 1212 are Ultra. We assure you our new PowerPoint templates and PPT Slides are Precious. Use our Graph Represents Growth New Year Concept PowerPoint Templates PPT Backgrounds For Slides 1212 are Versatile. Customers tell us our graph PowerPoint templates and PPT Slides are Charming. Use our Graph Represents Growth New Year Concept PowerPoint Templates PPT Backgrounds For Slides 1212 are Efficacious. The feedback we get is that our year PowerPoint templates and PPT Slides are Efficient. You will never be abysmal with our Graph Represents Growth New Year Concept PowerPoint Templates Ppt Backgrounds For Slides 1212. They start from above the average.
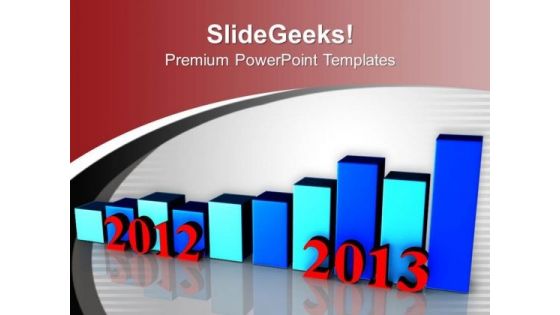
Business Growth 2012 To 2013 Bar Graph PowerPoint Templates Ppt Backgrounds For Slides 1212
We present our Business Growth 2012 To 2013 Bar Graph PowerPoint Templates PPT Backgrounds For Slides 1212.Use our Business PowerPoint Templates because the majestic tiger lord of all it surveys.It exudes power even when it is in repose. Present our Finance PowerPoint Templates because you envisage some areas of difficulty in the near future. The overall financial situation could be a source of worry. Present our Success PowerPoint Templates because you have come up with a brilliant breakthrough idea. you can also visualise the interest it will generate. Use our Future PowerPoint Templates because your team and you always raise a toast. Use our New Year PowerPoint Templates because you should Demonstrate how you think out of the box.Use these PowerPoint slides for presentations relating to Business Growth 2011 To 2013 Bar Graph, New Year, Business, Success, Future, Finance. The prominent colors used in the PowerPoint template are Blue, Red, Blue light. Professionals tell us our Business Growth 2012 To 2013 Bar Graph PowerPoint Templates PPT Backgrounds For Slides 1212 are Delightful. PowerPoint presentation experts tell us our Graph PowerPoint templates and PPT Slides are Spectacular. The feedback we get is that our Business Growth 2012 To 2013 Bar Graph PowerPoint Templates PPT Backgrounds For Slides 1212 are Functional. Customers tell us our New PowerPoint templates and PPT Slides are topically designed to provide an attractive backdrop to any subject. We assure you our Business Growth 2012 To 2013 Bar Graph PowerPoint Templates PPT Backgrounds For Slides 1212 are Excellent. The feedback we get is that our 2011 PowerPoint templates and PPT Slides are Luxurious. Attain stardom with our Business Growth 2012 To 2013 Bar Graph PowerPoint Templates Ppt Backgrounds For Slides 1212. You will come out on top.
Bar Graph Made By Dollar Bills Finance PowerPoint Templates Ppt Backgrounds For Slides 1112
We present our Bar Graph Made By Dollar Bills Finance PowerPoint Templates PPT Backgrounds For Slides 1112.Present our Money PowerPoint Templates because you can Show them the way, be Captain of the ship and lead them to new shores. Present our Business PowerPoint Templates because The foundation of the structure of your business is resilient and dependable. Convey this confidence to your colleagues and assure them of a great and enduring future. Download and present our Success PowerPoint Templates because you have come up with a brilliant breakthrough idea. you can also visualise the interest it will generate. Present our Finance PowerPoint Templates because you envisage some areas of difficulty in the near future. The overall financial situation could be a source of worry. Download and present our Future PowerPoint Templates because let this slide illustrates others piggyback on you to see well over the horizon.Use these PowerPoint slides for presentations relating to Bar graph from us dollars, money, business, finance, success, future. The prominent colors used in the PowerPoint template are Green, Gray, White. People tell us our Bar Graph Made By Dollar Bills Finance PowerPoint Templates PPT Backgrounds For Slides 1112 provide great value for your money. Be assured of finding the best projection to highlight your words. Presenters tell us our business PowerPoint templates and PPT Slides are Fancy. PowerPoint presentation experts tell us our Bar Graph Made By Dollar Bills Finance PowerPoint Templates PPT Backgrounds For Slides 1112 are Multicolored. Customers tell us our business PowerPoint templates and PPT Slides are Beautiful. Customers tell us our Bar Graph Made By Dollar Bills Finance PowerPoint Templates PPT Backgrounds For Slides 1112 are Luxuriant. Customers tell us our finance PowerPoint templates and PPT Slides are Magnificent. Give the right exposure to your ideas. Our Bar Graph Made By Dollar Bills Finance PowerPoint Templates Ppt Backgrounds For Slides 1112 will enhance their clarity.
American Dollar Graph Finance PowerPoint Templates Ppt Backgrounds For Slides 1112
We present our American Dollar Graph Finance PowerPoint Templates PPT Backgrounds For Slides 1112.Download and present our Americana PowerPoint Templates because our presentation designs are for those on the go. Download and present our Business PowerPoint Templates because you have had your share of being a goldfish in a small bowl.you are ready to launch out and spread your wings. Download and present our Marketing PowerPoint Templates because you can Employ the right colours for your brilliant ideas. Download and present our Finance PowerPoint Templates because you envisage some areas of difficulty in the near future. The overall financial situation could be a source of worry. Download our Success PowerPoint Templates because you have come up with a brilliant breakthrough idea. you can also visualise the interest it will generate.Use these PowerPoint slides for presentations relating to Dollars graph on usa map flag, americana, business, finance, marketing, success. The prominent colors used in the PowerPoint template are Blue, Red, White. People tell us our American Dollar Graph Finance PowerPoint Templates PPT Backgrounds For Slides 1112 effectively help you save your valuable time. Presenters tell us our flag PowerPoint templates and PPT Slides are Attractive. PowerPoint presentation experts tell us our American Dollar Graph Finance PowerPoint Templates PPT Backgrounds For Slides 1112 are Splendid. Customers tell us our finance PowerPoint templates and PPT Slides are Fashionable. Customers tell us our American Dollar Graph Finance PowerPoint Templates PPT Backgrounds For Slides 1112 are Breathtaking. Customers tell us our map PowerPoint templates and PPT Slides are readymade to fit into any presentation structure. Lead your attack with our American Dollar Graph Finance PowerPoint Templates Ppt Backgrounds For Slides 1112. You will come out on top.
Computer Tablet With Business Graph Sales PowerPoint Templates Ppt Backgrounds For Slides 1212
We present our Computer Tablet With Business Graph Sales PowerPoint Templates PPT Backgrounds For Slides 1212.Download our Technology PowerPoint Templates because you have the ideas and plans on how to achieve success. Present our Money PowerPoint Templates because you can Show them the way, be Captain of the ship and lead them to new shores. Download our Marketing PowerPoint Templates because The marketplace is the merger of your dreams and your ability. Download and present our Computer PowerPoint Templates because this shows ideas to get the different elements of your Business to mesh and coalesce into a focused team driven by a common goal to achieve the common aim with Excellence. Download our Success PowerPoint Templates because iT outlines the entire thought process for the benefit of others. Tell it to the world with your characteristic aplomb.Use these PowerPoint slides for presentations relating to Modern financial analysis, technology, money, marketing, computer, success. The prominent colors used in the PowerPoint template are Blue, Red, Green. Professionals tell us our Computer Tablet With Business Graph Sales PowerPoint Templates PPT Backgrounds For Slides 1212 provide great value for your money. Be assured of finding the best projection to highlight your words. Use our computer PowerPoint templates and PPT Slides are designed by professionals We assure you our Computer Tablet With Business Graph Sales PowerPoint Templates PPT Backgrounds For Slides 1212 are Bold. We assure you our PowerPoint templates and PPT Slides will make the presenter look like a pro even if they are not computer savvy. Presenters tell us our Computer Tablet With Business Graph Sales PowerPoint Templates PPT Backgrounds For Slides 1212 are Zippy. PowerPoint presentation experts tell us our money PowerPoint templates and PPT Slides are Chic. You have been given an exacting task. Plan your approach with our Computer Tablet With Business Graph Sales PowerPoint Templates Ppt Backgrounds For Slides 1212.
Bar Graph Dollar Finance PowerPoint Templates Ppt Backgrounds For Slides 1212
We present our Bar Graph Dollar Finance PowerPoint Templates PPT Backgrounds For Slides 1212.Use our Money PowerPoint Templates because in this Slide Various threads are joining up and being stitched together providing necessary strength Now you have to take the last leap. Present our Finance PowerPoint Templates because you envisage some areas of difficulty in the near future. The overall financial situation could be a source of worry. Use our Marketing PowerPoint Templates because it can illustrate your chain of ideas focusing on that aspect or resource in order to enhance the quality of your product. Use our Business PowerPoint Templates because it helps you to explain your plans in all earnest to your colleagues and raise the bar for all. Use our Success PowerPoint Templates because you have come up with a brilliant breakthrough idea. you can also visualise the interest it will generate.Use these PowerPoint slides for presentations relating to Money marketing chart, business, money, finance, marketing, success. The prominent colors used in the PowerPoint template are Green, Black, Gray. Customers tell us our Bar Graph Dollar Finance PowerPoint Templates PPT Backgrounds For Slides 1212 are Chic. Presenters tell us our chart PowerPoint templates and PPT Slides are Handsome. Use our Bar Graph Dollar Finance PowerPoint Templates PPT Backgrounds For Slides 1212 are Radiant. PowerPoint presentation experts tell us our PowerPoint templates and PPT Slides are Radiant. Customers tell us our Bar Graph Dollar Finance PowerPoint Templates PPT Backgrounds For Slides 1212 are Dynamic. Presenters tell us our success PowerPoint templates and PPT Slides are Stylish. Convince the audience of the feasibility of your ideas. Ensure comprehension with our Bar Graph Dollar Finance PowerPoint Templates Ppt Backgrounds For Slides 1212.
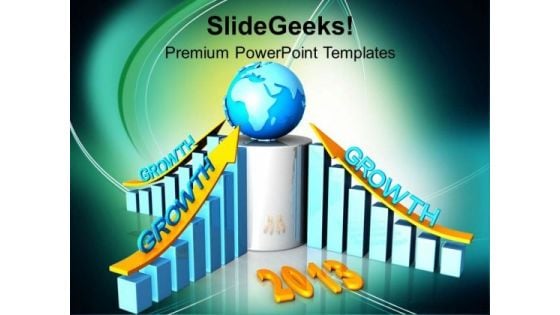
Bar Graph With Growth Arrow Global Business PowerPoint Templates Ppt Backgrounds For Slides 1112
We present our Bar Graph With Growth Arrow Global Business PowerPoint Templates PPT Backgrounds For Slides 1112.Present our Globe PowerPoint Templates because our ready backdrops leave a lasting impression. Present our Finance PowerPoint Templates because you envisage some areas of difficulty in the near future. The overall financial situation could be a source of worry. Download our Arrows PowerPoint Templates because the ideas and plans are on your finger tips. Download and present our Success PowerPoint Templates because the choices you make today will determine the future growth of your enterprise. Download and present our New year PowerPoint Templates because you can Set out the goals and your plan of action for teamwork.Use these PowerPoint slides for presentations relating to Growth Chart with globe, Globe, Finance, Arrows, Success, New year. The prominent colors used in the PowerPoint template are Blue, Yellow, Gray. You can be sure our Bar Graph With Growth Arrow Global Business PowerPoint Templates PPT Backgrounds For Slides 1112 are Glamorous. Professionals tell us our Arrows PowerPoint templates and PPT Slides are the best it can get when it comes to presenting. We assure you our Bar Graph With Growth Arrow Global Business PowerPoint Templates PPT Backgrounds For Slides 1112 are designed to make your presentations professional. PowerPoint presentation experts tell us our Success PowerPoint templates and PPT Slides are No-nonsense. The feedback we get is that our Bar Graph With Growth Arrow Global Business PowerPoint Templates PPT Backgrounds For Slides 1112 are Wistful. PowerPoint presentation experts tell us our Success PowerPoint templates and PPT Slides are Glamorous. Our Bar Graph With Growth Arrow Global Business PowerPoint Templates Ppt Backgrounds For Slides 1112 can be exceedingly captivating. Bewitch your audience with your thoughts.
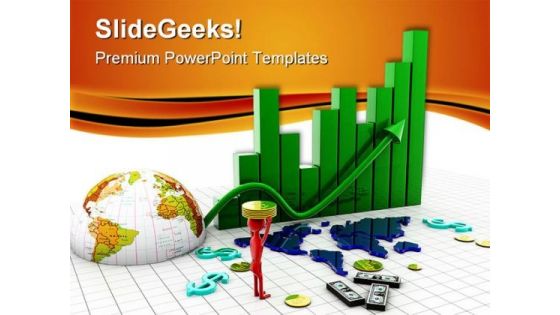
Business Graph With Dollars Globe PowerPoint Templates And PowerPoint Backgrounds 0311
Microsoft PowerPoint Template and Background with bar graphs dollar sign and diagram Convincing an audience is no mean feat. Do it with ease with our Business Graph With Dollars Globe PowerPoint Templates And PowerPoint Backgrounds 0311.
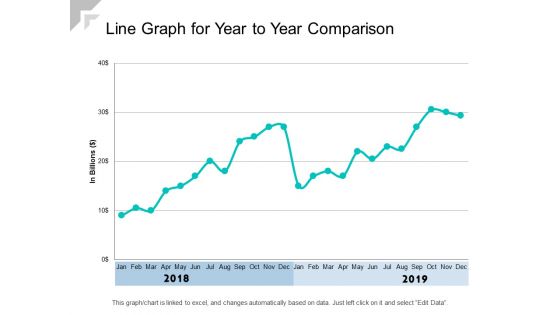
Line Graph For Year To Year Comparison Ppt PowerPoint Presentation Show Graphics Example
Presenting this set of slides with name line graph for year to year comparison ppt powerpoint presentation show graphics example. The topics discussed in these slides are revenue trend, bar chart, financial. This is a completely editable PowerPoint presentation and is available for immediate download. Download now and impress your audience.

Microsoft Corporations Revenue Growth Graph Microsoft Long Term Business Professional PDF
This slide represents graph which ca be used to calculate the revenue growth of Microsoft in last twenty years. Microsofts revenue has been growing continuously over the past 5 years since. Presenting this PowerPoint presentation, titled Microsoft Corporations Revenue Growth Graph Microsoft Long Term Business Professional PDF, with topics curated by our researchers after extensive research. This editable presentation is available for immediate download and provides attractive features when used. Download now and captivate your audience. Presenting this Microsoft Corporations Revenue Growth Graph Microsoft Long Term Business Professional PDF. Our researchers have carefully researched and created these slides with all aspects taken into consideration. This is a completely customizable Microsoft Corporations Revenue Growth Graph Microsoft Long Term Business Professional PDF that is available for immediate downloading. Download now and make an impact on your audience. Highlight the attractive features available with our PPTs. This slide represents graph which ca be used to calculate the revenue growth of Microsoft in last twenty years. Microsofts revenue has been growing continuously over the past 5 years since.

Microsoft Corporations Revenue Growth Graph Strategic Advancements By Microsofts Diagrams Pdf
This slide represents graph which ca be used to calculate the revenue growth of Microsoft in last twenty years. Microsofts revenue has been growing continuously over the past 5 years since. Presenting this PowerPoint presentation, titled Microsoft Corporations Revenue Growth Graph Strategic Advancements By Microsofts Diagrams Pdf, with topics curated by our researchers after extensive research. This editable presentation is available for immediate download and provides attractive features when used. Download now and captivate your audience. Presenting this Microsoft Corporations Revenue Growth Graph Strategic Advancements By Microsofts Diagrams Pdf. Our researchers have carefully researched and created these slides with all aspects taken into consideration. This is a completely customizable Microsoft Corporations Revenue Growth Graph Strategic Advancements By Microsofts Diagrams Pdf that is available for immediate downloading. Download now and make an impact on your audience. Highlight the attractive features available with our PPTs. This slide represents graph which ca be used to calculate the revenue growth of Microsoft in last twenty years. Microsofts revenue has been growing continuously over the past 5 years since.
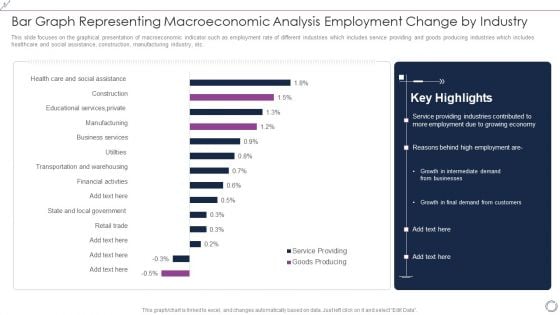
Bar Graph Representing Macroeconomic Analysis Employment Change By Industry Background PDF
This slide focuses on the graphical presentation of macroeconomic indicator such as employment rate of different industries which includes service providing and goods producing industries which includes healthcare and social assistance, construction, manufacturing industry, etc. Pitch your topic with ease and precision using this Bar Graph Representing Macroeconomic Analysis Employment Change By Industry Background PDF. This layout presents information on Goods Producing, Service Providing, Financial, Business. It is also available for immediate download and adjustment. So, changes can be made in the color, design, graphics or any other component to create a unique layout.

Micosoft Intensive Growth Microsoft Corporations Revenue Growth Graph Strategy SS V
This slide represents graph which ca be used to calculate the revenue growth of microsoft in last twenty years. Microsofts revenue has been growing continuously over the past 5 years since. Slidegeeks has constructed Micosoft Intensive Growth Microsoft Corporations Revenue Growth Graph Strategy SS V after conducting extensive research and examination. These presentation templates are constantly being generated and modified based on user preferences and critiques from editors. Here, you will find the most attractive templates for a range of purposes while taking into account ratings and remarks from users regarding the content. This is an excellent jumping-off point to explore our content and will give new users an insight into our top-notch PowerPoint Templates. This slide represents graph which ca be used to calculate the revenue growth of microsoft in last twenty years. Microsofts revenue has been growing continuously over the past 5 years since.
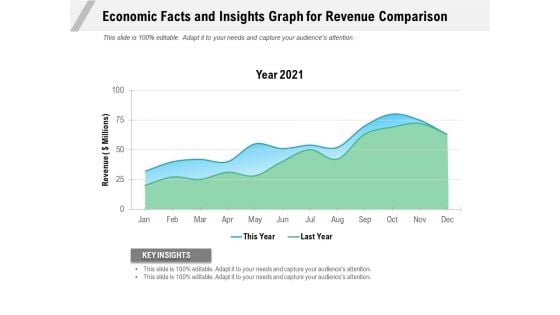
Economic Facts And Insights Graph For Revenue Comparison Ppt PowerPoint Presentation Gallery Portfolio PDF
Pitch your topic with ease and precision using this economic facts and insights graph for revenue comparison ppt powerpoint presentation gallery portfolio pdf. This layout presents information on year 2021, revenue, key insights. It is also available for immediate download and adjustment. So, changes can be made in the color, design, graphics or any other component to create a unique layout.
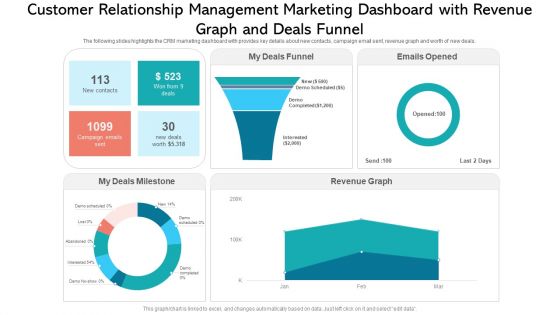
Customer Relationship Management Marketing Dashboard With Revenue Graph And Deals Funnel Ideas PDF
The following slides highlights the CRM marketing dashboard with provides key details about new contacts, campaign email sent, revenue graph and worth of new deals. Showcasing this set of slides titled customer relationship management marketing dashboard with revenue graph and deals funnel ideas pdf. The topics addressed in these templates are funnel, revenue graph, campaign. All the content presented in this PPT design is completely editable. Download it and make adjustments in color, background, font etc. as per your unique business setting.
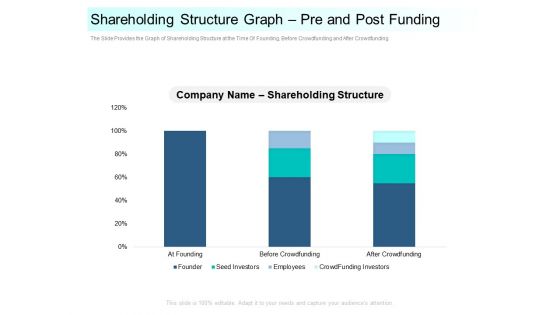
Community Capitalization Pitch Deck Shareholding Structure Graph Pre And Post Funding Template Pdf
The Slide Provides the Graph of Shareholding Structure at the Time Of Founding, Before Crowdfunding and After Crowdfunding. Deliver an awe inspiring pitch with this creative community capitalization pitch deck shareholding structure graph pre and post funding template pdf bundle. Topics like shareholding structure graph pre and post funding can be discussed with this completely editable template. It is available for immediate download depending on the needs and requirements of the user.
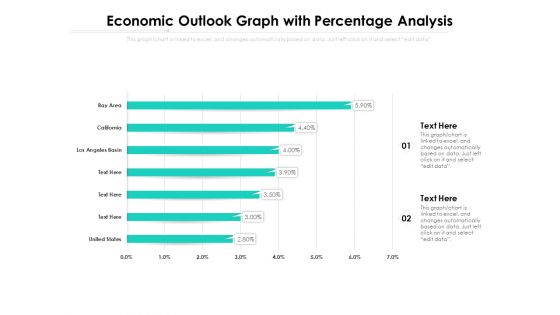
Economic Outlook Graph With Percentage Analysis Ppt PowerPoint Presentation Show Demonstration PDF
Presenting this set of slides with name economic outlook graph with percentage analysis ppt powerpoint presentation show demonstration pdf. The topics discussed in these slide is economic outlook graph with percentage analysis. This is a completely editable PowerPoint presentation and is available for immediate download. Download now and impress your audience.
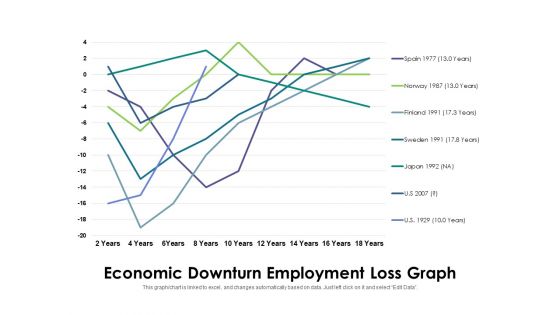
Economic Downturn Employment Loss Graph Ppt PowerPoint Presentation Outline Example File PDF
Pitch your topic with ease and precision using this economic downturn employment loss graph ppt powerpoint presentation outline example file pdf. This layout presents information on economic downturn employment loss graph. It is also available for immediate download and adjustment. So, changes can be made in the color, design, graphics or any other component to create a unique layout.
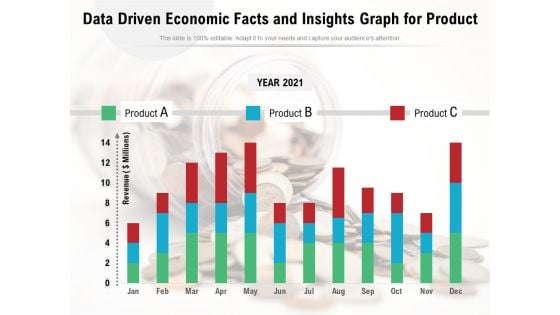
Data Driven Economic Facts And Insights Graph For Product Ppt PowerPoint Presentation Pictures Slide Download PDF
Pitch your topic with ease and precision using this data driven economic facts and insights graph for product ppt powerpoint presentation pictures slide download pdf. This layout presents information on year 2021, product, data driven economic. It is also available for immediate download and adjustment. So, changes can be made in the color, design, graphics or any other component to create a unique layout.

Graph Showing Revenue Through Social Media Marketing Ppt PowerPoint Presentation Gallery Professional PDF
Presenting this set of slides with name graph showing revenue through social media marketing ppt powerpoint presentation gallery professional pdf. The topics discussed in these slide is graph showing revenue through social media marketing. This is a completely editable PowerPoint presentation and is available for immediate download. Download now and impress your audience.
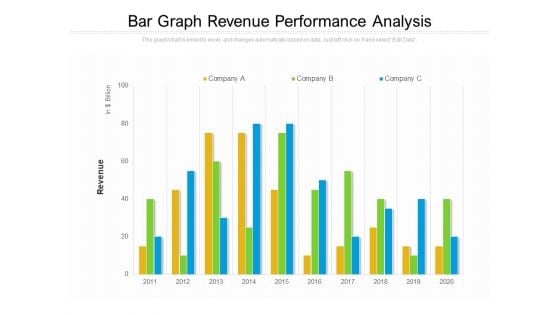
Bar Graph Revenue Performance Analysis Ppt PowerPoint Presentation Pictures Samples PDF
Presenting this set of slides with name bar graph revenue performance analysis ppt powerpoint presentation pictures samples pdf. The topics discussed in these slide is bar graph revenue performance analysis. This is a completely editable PowerPoint presentation and is available for immediate download. Download now and impress your audience.

Bar Graph Depicting Business Sales Revenue With Cagr Value Ppt PowerPoint Presentation File Outline PDF
Showcasing this set of slides titled bar graph depicting business sales revenue with cagr value ppt powerpoint presentation file outline pdf. The topics addressed in these templates are bar graph depicting business sales revenue with cagr value. All the content presented in this PPT design is completely editable. Download it and make adjustments in color, background, font etc. as per your unique business setting.
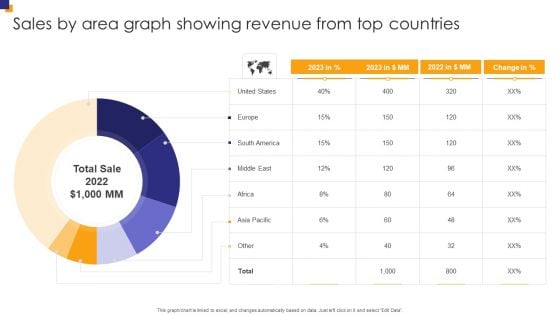
Sales By Area Graph Showing Revenue From Top Countries Inspiration PDF
Showcasing this set of slides titled Sales By Area Graph Showing Revenue From Top Countries Inspiration PDF. The topics addressed in these templates are Sales Area, Graph Showing, Revenue Countries. All the content presented in this PPT design is completely editable. Download it and make adjustments in color, background, font etc. as per your unique business setting.

Bar Graph Showing Revenues Generated By Sales Department Ppt Portfolio Graphics Example PDF
This graph or chart is linked to excel, and changes automatically based on data. Just left click on it and select edit data. Showcasing this set of slides titled bar graph showing revenues generated by sales department ppt portfolio graphics example pdf. The topics addressed in these templates are yearly sales revenues, sales team, profits. All the content presented in this PPT design is completely editable. Download it and make adjustments in color, background, font etc. as per your unique business setting.
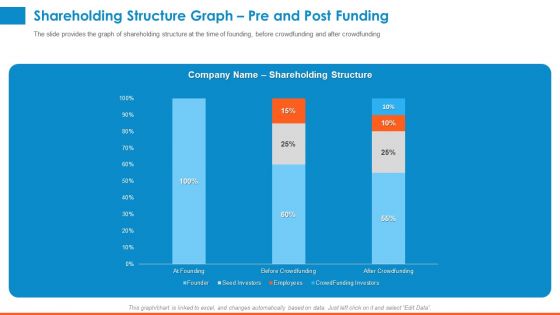
Raising Company Capital From Public Funding Sources Shareholding Structure Graph Pre And Post Funding Diagrams PDF
The slide provides the graph of shareholding structure at the time of founding, before crowdfunding and after crowdfunding. Deliver an awe-inspiring pitch with this creative raising company capital from public funding sources shareholding structure graph pre and post funding diagrams pdf bundle. Topics like founder, seed investors, employees, crowdfunding investors, before crowdfunding, after crowdfunding can be discussed with this completely editable template. It is available for immediate download depending on the needs and requirements of the user.
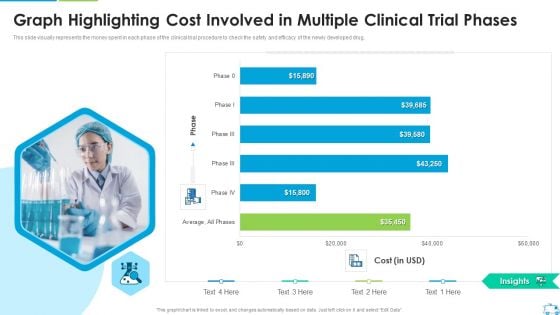
Graph Highlighting Cost Involved In Multiple Clinical Trial Phases Microsoft PDF
This slide visually represents the money spent in each phase of the clinical trial procedure to check the safety and efficacy of the newly developed drug.Deliver an awe inspiring pitch with this creative Graph Highlighting Cost Involved In Multiple Clinical Trial Phases Microsoft PDF bundle. Topics like Graph Highlighting Cost Involved In Multiple Clinical Trial Phases can be discussed with this completely editable template. It is available for immediate download depending on the needs and requirements of the user.

Microsoft Strategic Plan To Become Market Leader Microsoft Corporations Revenue Growth Graph Portrait PDF
This slide represents graph which ca be used to calculate the revenue growth of Microsoft in last twenty years. Microsofts revenue has been growing continuously over the past 5 years since. Whether you have daily or monthly meetings, a brilliant presentation is necessary. Microsoft Strategic Plan To Become Market Leader Microsoft Corporations Revenue Growth Graph Portrait PDF can be your best option for delivering a presentation. Represent everything in detail using Microsoft Strategic Plan To Become Market Leader Microsoft Corporations Revenue Growth Graph Portrait PDF and make yourself stand out in meetings. The template is versatile and follows a structure that will cater to your requirements. All the templates prepared by Slidegeeks are easy to download and edit. Our research experts have taken care of the corporate themes as well. So, give it a try and see the results.

Business Revenue Bar Graph With Business Operational Expenditure Details Summary PDF
This slide represents business revenue bar graph with OPEX details which can be referred by companies to earn more revenue by controlling expenditures. It also provides information about marketing and sales, research and development, administration, total revenue, etc. Pitch your topic with ease and precision using this Business Revenue Bar Graph With Business Operational Expenditure Details Summary PDF. This layout presents information on Cost Of Marketing, Sales, Highest Amount. It is also available for immediate download and adjustment. So, changes can be made in the color, design, graphics or any other component to create a unique layout.
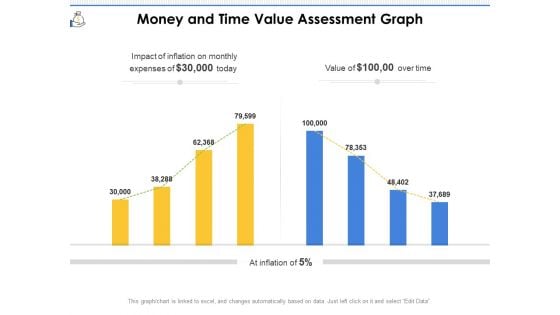
Money And Time Value Assessment Graph Ppt PowerPoint Presentation File Outline PDF
Presenting this set of slides with name money and time value assessment graph ppt powerpoint presentation file outline pdf. The topics discussed in these slides are inflation, expenses, value. This is a completely editable PowerPoint presentation and is available for immediate download. Download now and impress your audience.
Gross And Net Revenue Comparison Shown By Graph Ppt PowerPoint Presentation File Icons PDF
Presenting this set of slides with name gross and net revenue comparison shown by graph ppt powerpoint presentation file icons pdf. The topics discussed in these slides are gross profit, net profit. This is a completely editable PowerPoint presentation and is available for immediate download. Download now and impress your audience.
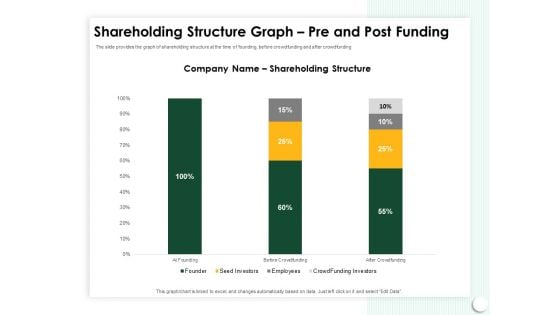
Startup Presentation For Collaborative Capital Funding Shareholding Structure Graph Pre And Post Funding Background PDF
Presenting this set of slides with name startup presentation for collaborative capital funding shareholding structure graph pre and post funding background pdf. The topics discussed in these slides are employee, shareholding structure, seed investors, crowd funding investors. This is a completely editable PowerPoint presentation and is available for immediate download. Download now and impress your audience.
Startup Pitch To Raise Capital From Crowdfunding Shareholding Structure Graph Pre And Post Funding Icons PDF
Deliver an awe-inspiring pitch with this creative startup pitch to raise capital from crowdfunding shareholding structure graph pre and post funding icons pdf bundle. Topics like founder, employee, seed investors, crowdfunding investors can be discussed with this completely editable template. It is available for immediate download depending on the needs and requirements of the user.
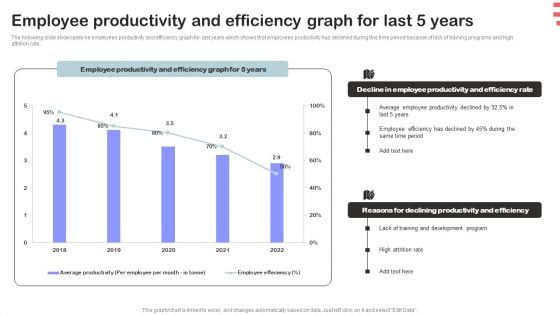
Corporate Training Program Employee Productivity And Efficiency Graph For Last 5 Years Elements PDF
The following slide showcases he employees productivity and efficiency graph for last years which shows that employees productivity has declined during this time period because of lack of training programs and high attrition rate. Make sure to capture your audiences attention in your business displays with our gratis customizable Corporate Training Program Employee Productivity And Efficiency Graph For Last 5 Years Elements PDF. These are great for business strategies, office conferences, capital raising or task suggestions. If you desire to acquire more customers for your tech business and ensure they stay satisfied, create your own sales presentation with these plain slides.
Bar Graph Showing Profit Analysis Ppt PowerPoint Presentation Icon Deck PDF
Presenting this set of slides with name bar graph showing profit analysis ppt powerpoint presentation icon deck pdf. The topics discussed in these slides are gross revenue, income. This is a completely editable PowerPoint presentation and is available for immediate download. Download now and impress your audience.
Bar Graph Showing Of Business Income And Expenditure Ppt PowerPoint Presentation Icon Show PDF
Presenting this set of slides with name bar graph showing of business income and expenditure ppt powerpoint presentation icon show pdf. The topics discussed in these slides are expenses, revenue. This is a completely editable PowerPoint presentation and is available for immediate download. Download now and impress your audience.


 Continue with Email

 Home
Home


