Financial Graphs
Subordinate Debt Pitch Deck For Fund Raising Table Of Content Ppt Icon Grid PDF
Deliver an awe-inspiring pitch with this creative subordinate debt pitch deck for fund raising table of content ppt icon grid pdf bundle. Topics like major achievements company, key sources revenue generation, market potential and target customers, key opportunities market, key statistics company, financial graph historical and projection, revenue forecast subscribers can be discussed with this completely editable template. It is available for immediate download depending on the needs and requirements of the user.
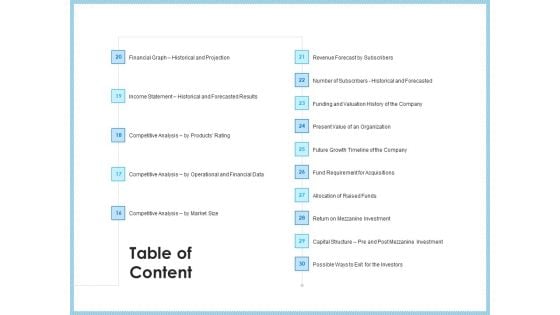
Investment Pitch To Generating Capital From Mezzanine Credit Table Of Content Market Mockup PDF
Deliver an awe-inspiring pitch with this creative investment pitch to generating capital from mezzanine credit table of content market mockup pdf bundle. Topics like financial graph historical and projection, income statement, historical and forecasted results, competitive analysis products rating, competitive analysis, market size can be discussed with this completely editable template. It is available for immediate download depending on the needs and requirements of the user.
Bar Chart Ppt PowerPoint Presentation Icon Demonstration
This is a bar chart ppt powerpoint presentation icon demonstration. This is a seven stage process. The stages in this process are product, sales in percentage, financial year, graph.
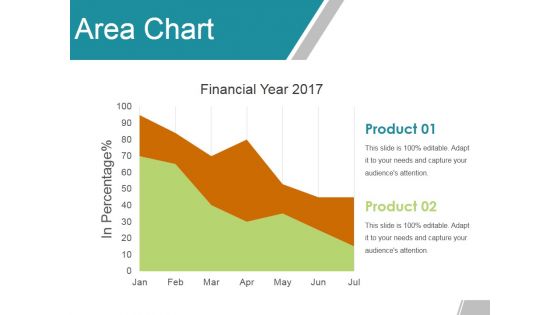
Area Chart Ppt Powerpoint Presentation Ideas Templates
This is a area chart ppt powerpoint presentation ideas templates. This is a two stage process. The stages in this process are product, financial year, in percentage, graph.
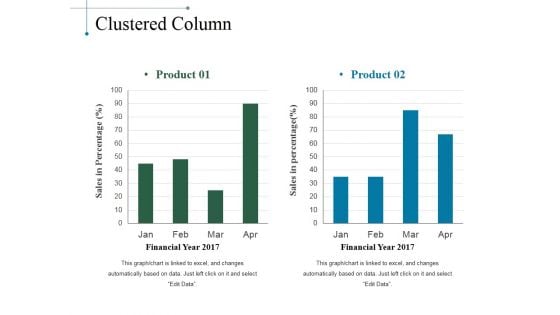
Clustered Column Ppt PowerPoint Presentation Slides Smartart
This is a clustered column ppt powerpoint presentation slides smartart. This is a two stage process. The stages in this process are product, sales in percentage, financial year, bar graph.
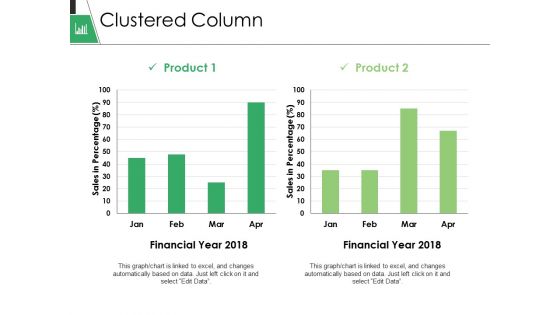
Clustered Column Ppt PowerPoint Presentation Gallery Format
This is a clustered column ppt powerpoint presentation gallery format. This is a two stage process. The stages in this process are business, marketing, graph, financial year, sales in percentage.
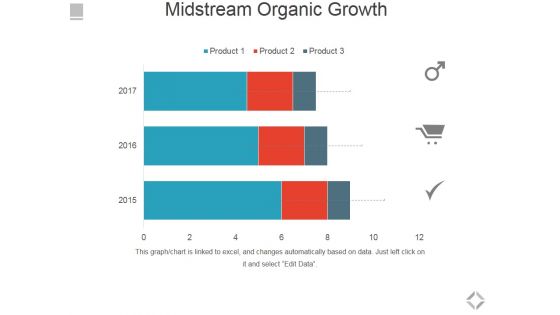
Midstream Organic Growth Ppt PowerPoint Presentation Ideas Graphics Tutorials
This is a midstream organic growth ppt powerpoint presentation ideas graphics tutorials. This is a three stage process. The stages in this process are business, marketing, bar graph, management, financials.
Clustered Column Line Ppt PowerPoint Presentation Icon Good
This is a clustered column line ppt powerpoint presentation icon good. This is a three stage process. The stages in this process are product, financial year, bar graph, business, growth.
Bar Chart Ppt PowerPoint Presentation Icon Information
This is a bar chart ppt powerpoint presentation icon information. This is a one stage process. The stages in this process are product, sales in percentage, financial years, bar graph, growth.
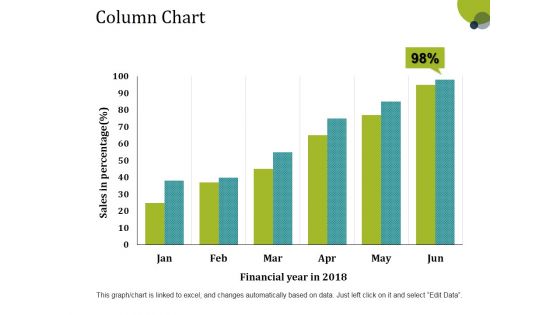
Column Chart Ppt PowerPoint Presentation Layouts Tips
This is a column chart ppt powerpoint presentation layouts tips. This is a six stage process. The stages in this process are sales in percentage, financial year, bar graph, growth, success.
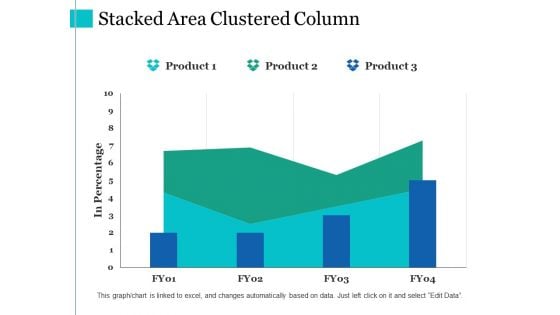
Stacked Area Clustered Column Ppt PowerPoint Presentation Summary Slides
This is a stacked area clustered column ppt powerpoint presentation summary slides. This is a three stage process. The stages in this process are product, in percentage, financial year, bar graph.
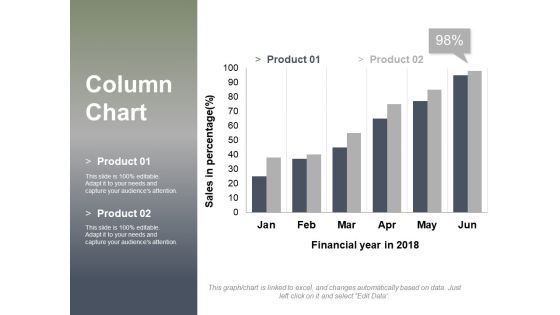
Column Chart Ppt PowerPoint Presentation Layouts Design Inspiration
This is a column chart ppt powerpoint presentation layouts design inspiration. This is a two stage process. The stages in this process are sales in percentage, financial year in, graph, business, finance, marketing.
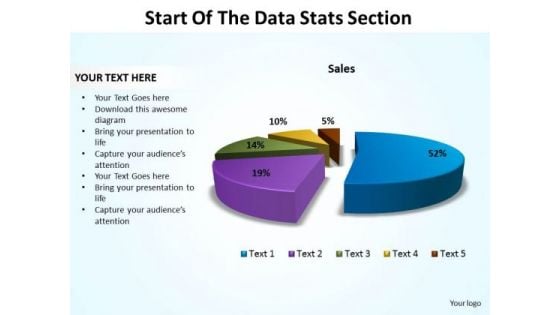
Business Marketing PowerPoint Templates Business Start Of The Data Stats Section Ppt Slides
Business Marketing PowerPoint Templates Business start of the data stats section PPT Slides-This Pie Chart is a simple template that provides a graphical, time-phased overview of a continuing sequence of stages, tasks, or events in a circular flow. You can divide a Pie Chart into segments for illustrating proportion-Business Marketing PowerPoint Templates Business start of the data stats section PPT Slides-This ppt can be used for concepts relating to-3d, Allocate, Allocation, Business, Chart, Circle, Data, Diagram, Divide, Division, Expensive, Financial, Graph Etc. Destroy failure with our Business Marketing PowerPoint Templates Business Start Of The Data Stats Section Ppt Slides. You will come out on top.
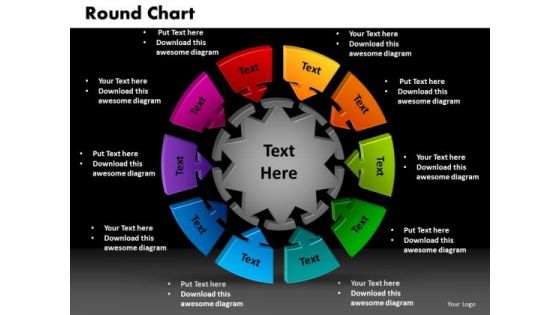
PowerPoint Slide Designs Round Chart Business Ppt Slide Designs
PowerPoint Slide Designs Round Chart Business PPT Slide Designs-Determine your targets and sequence them as per your priorities. Unravel each one for your audience while setting key timelines as you go along. Educate your listeners on the relevance and importance of each one as per your plan and how they all contribute as you strive to hit the Bullseye-PowerPoint Slide Designs Round Chart Business PPT Slide Designs-This ppt can be used for presentations relating to-3d, Angle, Arrow, Business, Chart, Circle, Complex, Concept, Data, Depth, Diagram, Dimensional, Financial, Graph, Graphic, Process Supervise your team with our PowerPoint Slide Designs Round Chart Business Ppt Slide Designs. Download without worries with our money back guaranteee.
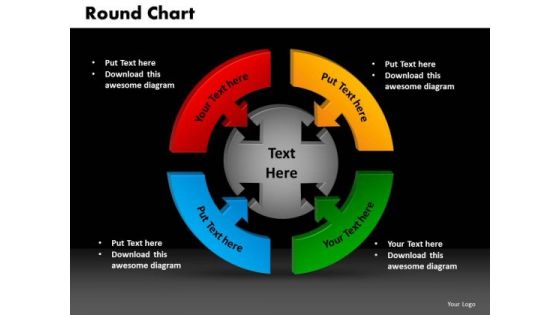
PowerPoint Design Round Chart Leadership Ppt Process
PowerPoint Design Round Chart Leadership PPT Process-Determine your targets and sequence them as per your priorities. Unravel each one for your audience while setting key timelines as you go along. Educate your listeners on the relevance and importance of each one as per your plan and how they all contribute as you strive to hit the Bullseye-PowerPoint Design Round Chart Leadership PPT Process-This ppt can be used for presentations relating to-3d, Angle, Arrow, Business, Chart, Circle, Complex, Concept, Data, Depth, Diagram, Dimensional, Financial, Graph, Graphic, Process Advise them on the regimen with our PowerPoint Design Round Chart Leadership Ppt Process. Get them ready to take the field.
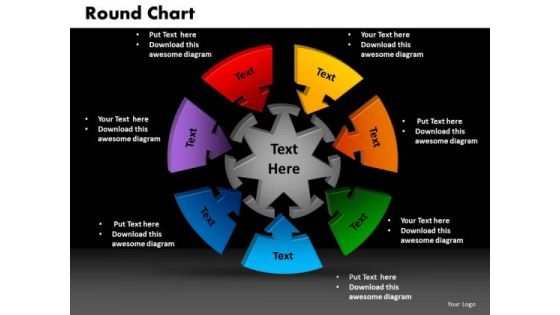
PowerPoint Design Slides Round Chart Image Ppt Themes
PowerPoint Design Slides Round Chart Image PPT Themes-Determine your targets and sequence them as per your priorities. Unravel each one for your audience while setting key timelines as you go along. Educate your listeners on the relevance and importance of each one as per your plan and how they all contribute as you strive to hit the Bullseye-PowerPoint Design Slides Round Chart Image PPT Themes-This ppt can be used for presentations relating to-3d, Angle, Arrow, Business, Chart, Circle, Complex, Concept, Data, Depth, Diagram, Dimensional, Financial, Graph, Graphic, Process Our PowerPoint Design Slides Round Chart Image Ppt Themes will fulfill your every need. Use them and effectively to gain success.
PowerPoint Designs Round Chart Business Ppt Presentation Designs
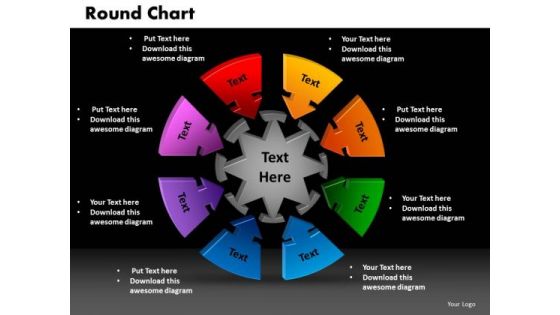
PowerPoint Designs Round Chart Business PPT Presentation Designs-Determine your targets and sequence them as per your priorities. Unravel each one for your audience while setting key timelines as you go along. Educate your listeners on the relevance and importance of each one as per your plan and how they all contribute as you strive to hit the Bullseye-PowerPoint Designs Round Chart Business PPT Presentation Designs-This ppt can be used for presentations relating to-3d, Angle, Arrow, Business, Chart, Circle, Complex, Concept, Data, Depth, Diagram, Dimensional, Financial, Graph, Graphic, Process Get your ideas buzzing with our PowerPoint Designs Round Chart Business Ppt Presentation Designs. They will be flying all around.
Clustered Column Ppt PowerPoint Presentation Gallery Structure
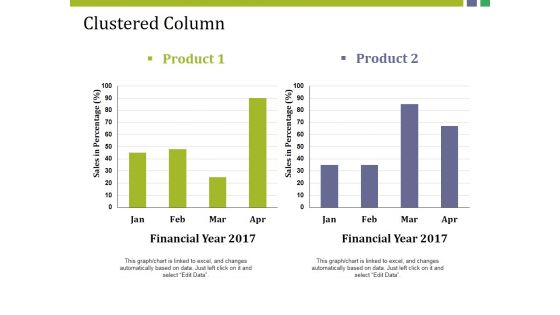
This is a clustered column ppt powerpoint presentation gallery structure. This is a two stage process. The stages in this process are product, sales in percentage, financial year, bar graph, finance.
Business Graphic PowerPoint Templates Business Stacked Bar Chart Ppt Slides
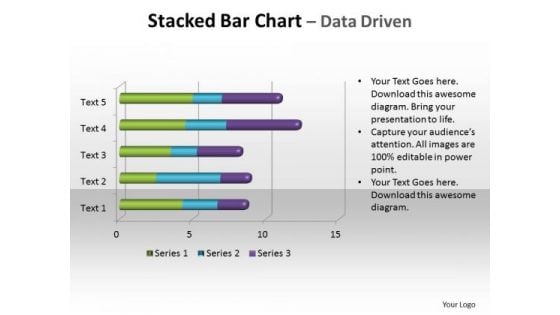
Business Graphic PowerPoint Templates Business stacked bar chart PPT Slides-You can use a 100% stacked column chart when you have three or more data series and you want to emphasize the contributions to the whole, especially if the total is the same for each category. . -Business Graphic PowerPoint Templates Business stacked bar chart PPT Slides-This ppt can be used for concepts relating to-Bar, Block, Business, Chart, Color, Colour, Column, Decline, Fill, Finance, Financial, Graph etc. Make your audience listen and observe with our Business Graphic PowerPoint Templates Business Stacked Bar Chart Ppt Slides. You will be at the top of your game.
Clustered Column Line Ppt PowerPoint Presentation Portfolio Outline
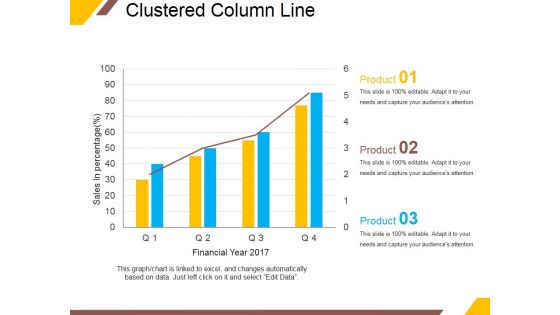
This is a clustered column line ppt powerpoint presentation portfolio outline. This is a four stage process. The stages in this process are sales in percentage, financial year, product, graph, growth.
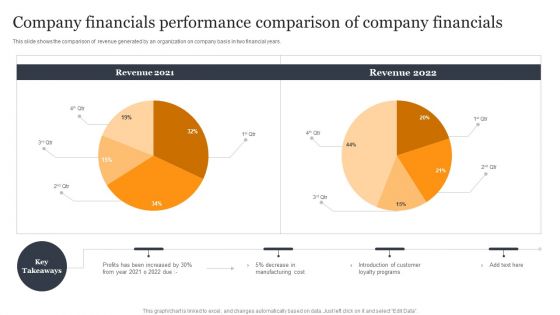
Company Financials Performance Comparison Of Company Financials Formats PDF
This slide shows the comparison of revenue generated by an organization on company basis in two financial years. Pitch your topic with ease and precision using this Company Financials Performance Comparison Of Company Financials Formats PDF. This layout presents information on Manufacturing Cost, Introduction Customer, Loyalty Programs. It is also available for immediate download and adjustment. So, changes can be made in the color, design, graphics or any other component to create a unique layout.
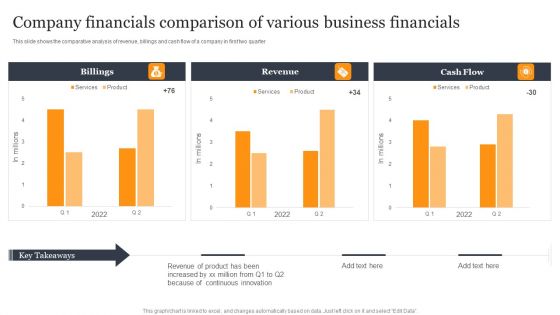
Company Financials Comparison Of Various Business Financials Template PDF
This slide shows the comparative analysis of revenue, billings and cash flow of a company in first two quarter. Pitch your topic with ease and precision using this Company Financials Comparison Of Various Business Financials Template PDF. This layout presents information on Revenue Product, Because Continuous, Been Increased. It is also available for immediate download and adjustment. So, changes can be made in the color, design, graphics or any other component to create a unique layout.
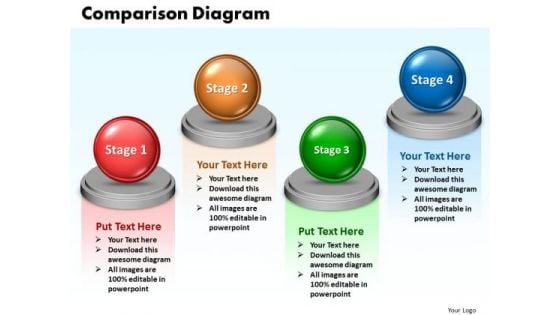
Ppt Comparison Network Diagram PowerPoint Template 4 Phase Templates
PPT comparison network diagram powerpoint template 4 phase Templates-This PowerPoint diagram slide shows four opposing views. You can use the This PowerPoint diagram slide to represent views from different functions on an issue.-PPT comparison network diagram powerpoint template 4 phase Templates-Abstract, Achievement, Business, Chart, Comparison, Concepts, Data, Descriptive, Design, Development, Diagram, Element, Figure, Finance, Financial, Graph, Graphic, Growth, Icon, Ideas, Improvement, Investment, Market, Money, Progress, Raise, Real, Report, Revenue, Sale, Shape, Sign, Silhouette, Stock, Success, Symbol, Technology Reveal the depth of your knowledge. Showcase your erudition on our Ppt Comparison Network Diagram PowerPoint Template 4 Phase Templates.
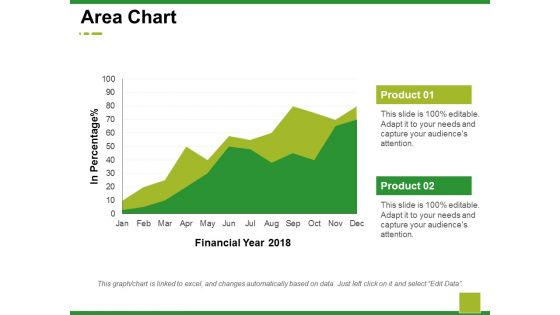
Area Chart Ppt PowerPoint Presentation Model Demonstration
This is a area chart ppt powerpoint presentation model demonstration. This is a two stage process. The stages in this process are business, marketing, financial year, in percentage, graph.
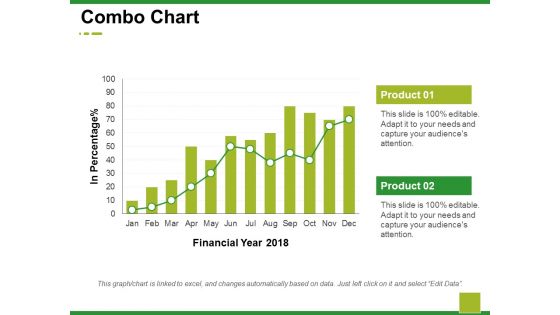
Combo Chart Ppt PowerPoint Presentation Summary Background Images
This is a combo chart ppt powerpoint presentation summary background images. This is a two stage process. The stages in this process are business, marketing, financial year, in percentage, graph.
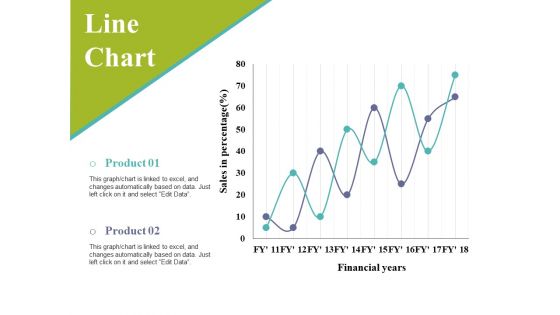
Line Chart Ppt PowerPoint Presentation Infographic Template Slides
This is a line chart ppt powerpoint presentation infographic template slides. This is a two stage process. The stages in this process are sales in percentage, financial years, business, marketing, graph.
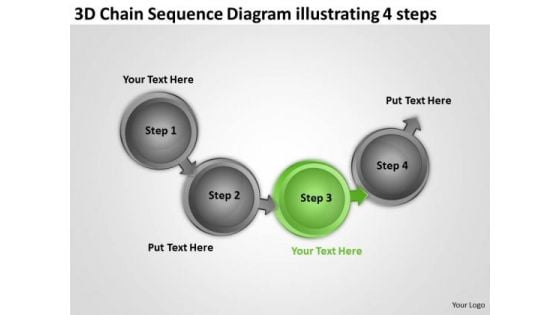
3d Chain Sequence Diagram Illustrating 4 Steps Ppt Business Plan Financials PowerPoint Slides
We present our 3d chain sequence diagram illustrating 4 steps ppt business plan financials PowerPoint Slides.Present our Finance PowerPoint Templates because Our PowerPoint Templates and Slides will fulfill your every need. Use them and effectively satisfy the desires of your audience. Use our Business PowerPoint Templates because you can see clearly through to the bigger bowl ahead. Time your jump to perfection and hit the nail on the head. Use our Circle Charts PowerPoint Templates because this template will explain the value of its wellness to human life. Use our Flow charts PowerPoint Templates because it depicts Rolling along while gathering profits along the way is the aim. Use our Arrows PowerPoint Templates because clear thnking is your strength, transmit your thoughts to your eager team.Use these PowerPoint slides for presentations relating to Arrow, Business, Chain, Chart, Circle, Circle, Frame, Color, Concept, Connect, Connection, Connectivity, Corporate, Data, Design, Diagram, Financial, Flow, Flowchart, Graph, Graphical, Group, Important, Organization, Organize, Plan, Process, Rectangle, Relation, Set, Steps, Structure, Teamwork. The prominent colors used in the PowerPoint template are Green, Gray, Black. Professionals tell us our 3d chain sequence diagram illustrating 4 steps ppt business plan financials PowerPoint Slides will make the presenter successul in his career/life. We assure you our Concept PowerPoint templates and PPT Slides are Gorgeous. People tell us our 3d chain sequence diagram illustrating 4 steps ppt business plan financials PowerPoint Slides are Ultra. Customers tell us our Chart PowerPoint templates and PPT Slides are Perfect. Use our 3d chain sequence diagram illustrating 4 steps ppt business plan financials PowerPoint Slides are Efficient. We assure you our Circle PowerPoint templates and PPT Slides are Gorgeous. End all differences with our 3d Chain Sequence Diagram Illustrating 4 Steps Ppt Business Plan Financials PowerPoint Slides. They encourage achieving consensus.
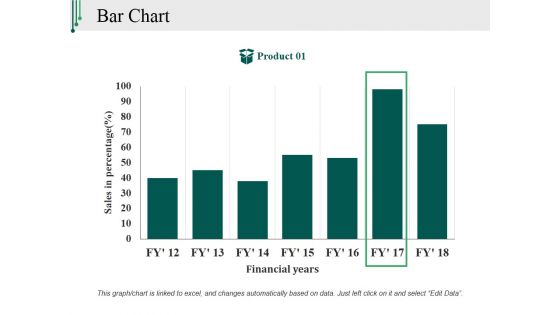
Bar Chart Ppt PowerPoint Presentation Outline Backgrounds
This is a bar chart ppt powerpoint presentation outline backgrounds. This is a one stage process. The stages in this process are sales in percentage, financial years, product, bar graph, finance.
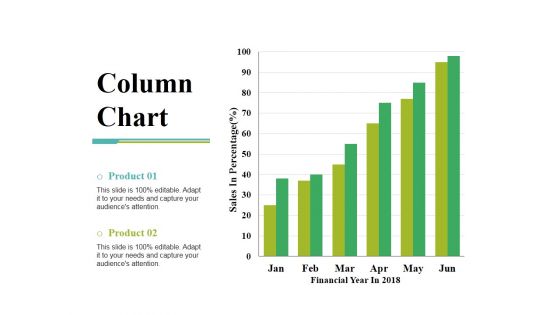
Column Chart Ppt PowerPoint Presentation Gallery Slide Portrait
This is a column chart ppt powerpoint presentation gallery slide portrait. This is a two stage process. The stages in this process are sales in percentage, financial year, product, bar graph, growth.
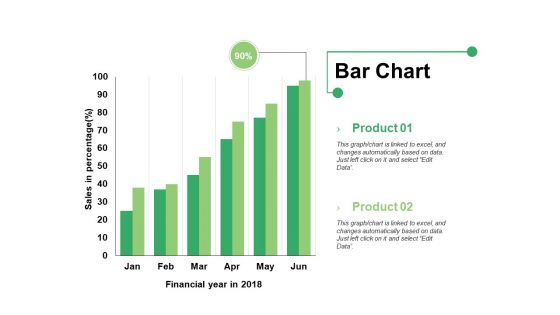
Bar Chart Ppt PowerPoint Presentation Infographics Format Ideas
This is a bar chart ppt powerpoint presentation infographics format ideas. This is a two stage process. The stages in this process are bar graph, product, financial year, sales in percentage.
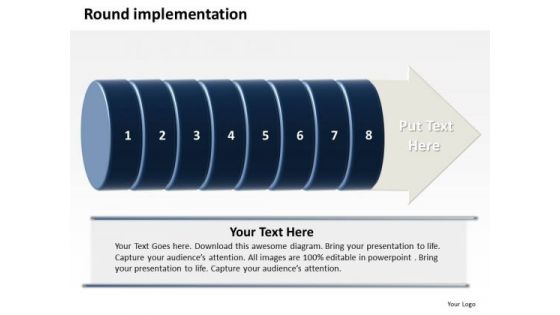
Ppt Round Images 2007 Implementation Of 8 Steps Involved Procedure PowerPoint Templates
PPT round images 2007 implementation of 8 steps involved procedure PowerPoint Templates-This PowerPoint Diagram shows the Round Implementation of steps which are involved in manufacturing Process. It includes eight Steps. You can change color, size and orientation of any icon to your liking.-PPT round images 2007 implementation of 8 steps involved procedure PowerPoint Templates-Analysis, Art, Blank, Blue, Business, Categories, Chart, Chief, Circle, Clip, Clipart, Corporate, Design, Diagram, Directors, Element, Executive, Financial, Graph, Graphic, Green, Heading, Icon, Illustration, Implementation, Isolated, Managers, Media, Network, Officer, Perspective, Pie, President, Red, Relations, Role, Round, Sales, Segments, Set, Six, Staff, Strategic, Title, Vector, Vice, Wheel Increase efficiency with our Ppt Round Images 2007 Implementation Of 8 Steps Involved Procedure PowerPoint Templates. Download without worries with our money back guaranteee.
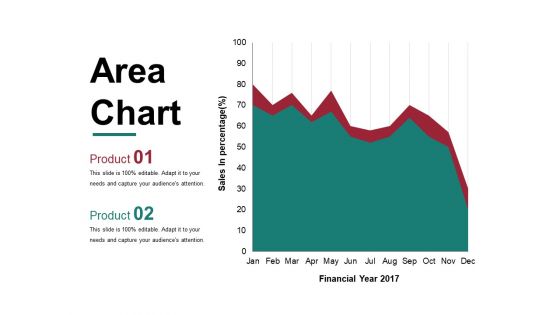
Area Chart Ppt PowerPoint Presentation Layouts Maker
This is a area chart ppt powerpoint presentation layouts maker. This is a two stage process. The stages in this process are financial year, sales in percentage, graph, business, marketing.
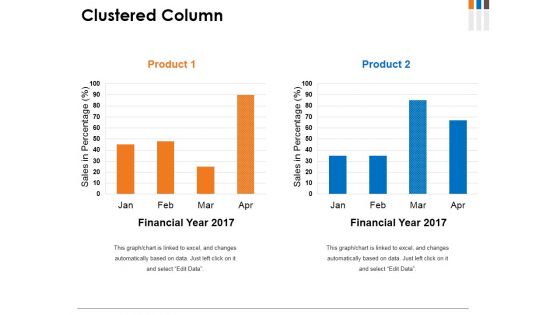
Clustered Column Ppt PowerPoint Presentation File Graphics
This is a clustered column ppt powerpoint presentation file graphics. This is a two stage process. The stages in this process are product, financial year, sales in percentage, graph, growth.
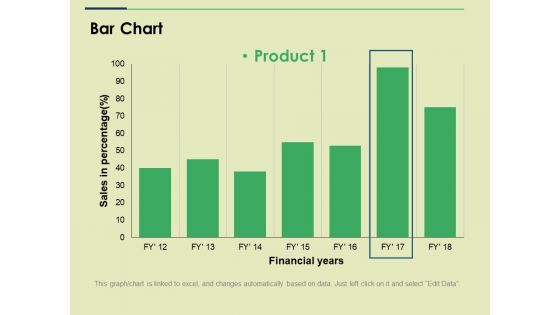
Bar Chart Ppt PowerPoint Presentation File Slide
This is a bar chart ppt powerpoint presentation file slide. This is a one stage process. The stages in this process are sales in percentage financial years, business, marketing, strategy, graph.
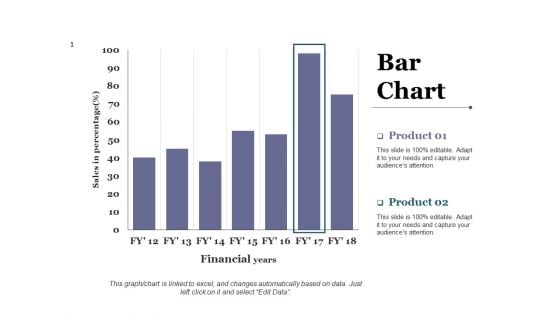
Bar Chart Ppt PowerPoint Presentation Diagram Lists
This is a bar chart ppt powerpoint presentation diagram lists. This is a two stage process. The stages in this process are business, marketing, financial years, sales in percentage, graph.
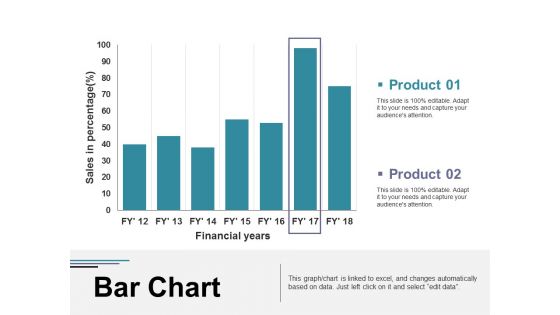
Bar Chart Ppt PowerPoint Presentation Visual Aids Diagrams
This is a bar chart ppt powerpoint presentation visual aids diagrams. This is a two stage process. The stages in this process are business, marketing, financial years, sales in percentage, graph.
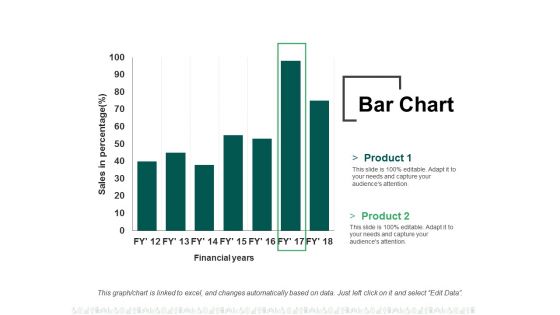
Bar Chart Ppt PowerPoint Presentation Summary File Formats
This is a bar chart ppt powerpoint presentation summary file formats. This is a two stage process. The stages in this process are business, finance, financial years, sales in percentage, graph.
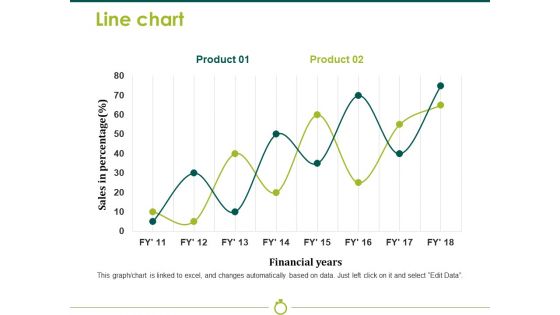
Line Chart Template 2 Ppt PowerPoint Presentation Model Background Image
This is a line chart template 2 ppt powerpoint presentation model background image. This is a two stage process. The stages in this process are sales in percentage, financial years, business, marketing, strategy, graph.
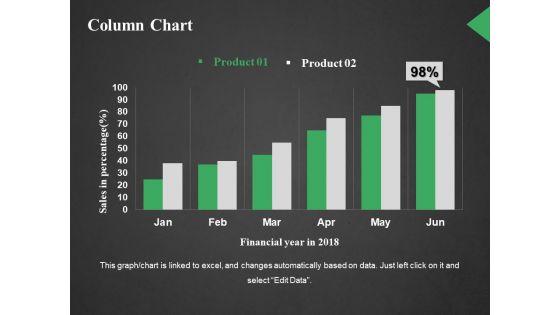
Column Chart Ppt PowerPoint Presentation Outline Styles
This is a column chart ppt powerpoint presentation outline styles. This is a two stage process. The stages in this process are sales in percentage, financial year in, business, marketing, graph.
Company Financials Performance Tracking Dashboard Brochure PDF
This slide illustrates KPI dashboard that can be used by organizations to track their financial performance on company basis. Kpis covered in the slide are contract status, revenue, cost of goods, overdue and task status. Showcasing this set of slides titled Company Financials Performance Tracking Dashboard Brochure PDF. The topics addressed in these templates are Report Shortcut, Revenue Cost, Overdue Task. All the content presented in this PPT design is completely editable. Download it and make adjustments in color, background, font etc. as per your unique business setting.
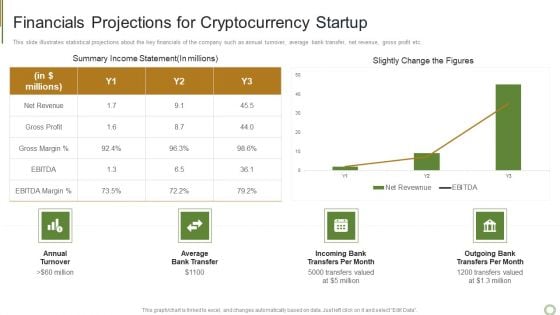
Financials Projections For Cryptocurrency Startup Formats PDF
This slide illustrates statistical projections about the key financials of the company such as annual turnover, average bank transfer, net revenue, gross profit etc.Deliver and pitch your topic in the best possible manner with this Financials Projections For Cryptocurrency Startup Formats PDF Use them to share invaluable insights on Financials Projections For Cryptocurrency Startup and impress your audience. This template can be altered and modified as per your expectations. So, grab it now.
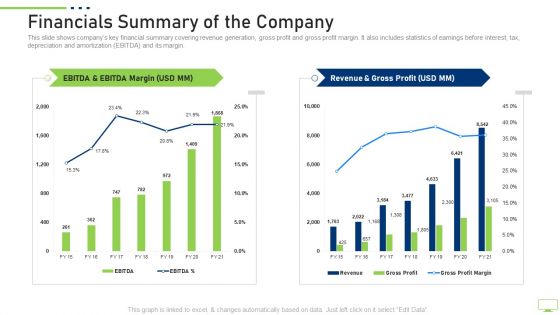
Financials Summary Of The Company Elements PDF
Deliver an awe inspiring pitch with this creative financials summary of the company elements pdf bundle. Topics like financials summary of the company can be discussed with this completely editable template. It is available for immediate download depending on the needs and requirements of the user.
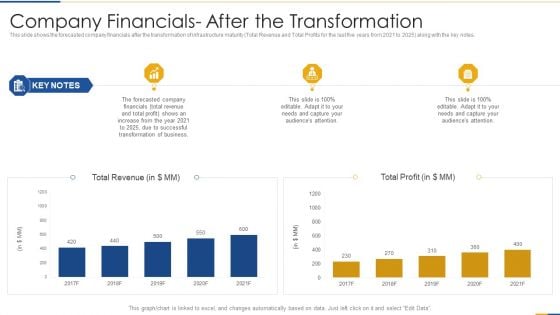
Company Financials After The Transformation Structure PDF
Deliver an awe inspiring pitch with this creative company financials after the transformation structure pdf bundle. Topics like company financials after the transformation can be discussed with this completely editable template. It is available for immediate download depending on the needs and requirements of the user.
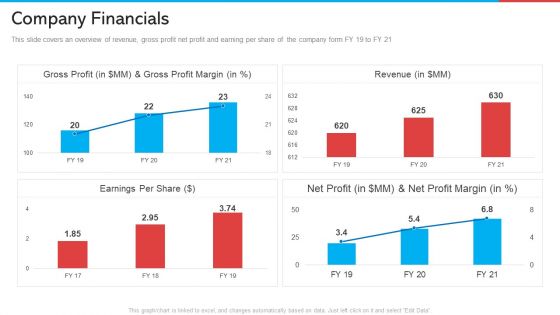
Company Financials Retail Marketing Summary PDF
This slide covers an overview of revenue, gross profit net profit and earning per share of the company form FY 19 to FY 21 Deliver an awe inspiring pitch with this creative company financials retail marketing summary pdf bundle. Topics like profit margin, revenue, gross profit can be discussed with this completely editable template. It is available for immediate download depending on the needs and requirements of the user.
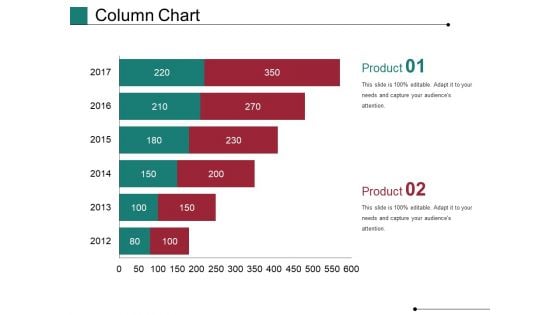
Column Chart Ppt PowerPoint Presentation Show Master Slide
This is a column chart ppt powerpoint presentation show master slide. This is a six stage process. The stages in this process are financial, years, business, marketing, finance, graph.
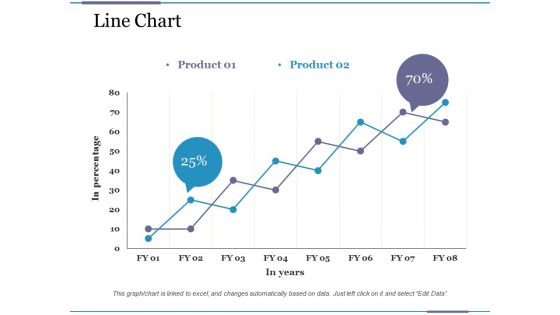
Line Chart Ppt PowerPoint Presentation Pictures File Formats
This is a line chart ppt powerpoint presentation pictures file formats. This is a two stage process. The stages in this process are business, financial, in percentage, in years, graph.
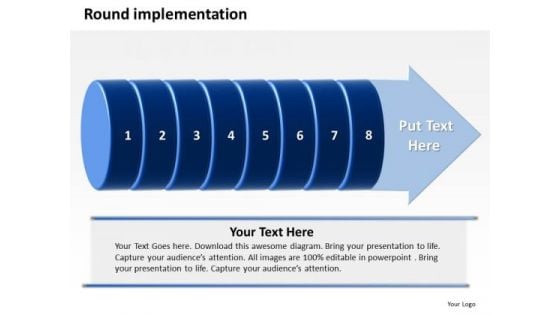
Ppt Round Implementation Of 8 Steps Involved Procedure PowerPoint Templates
PPT round implementation of 8 steps involved procedure PowerPoint Templates-This PowerPoint Diagram shows the Round Implementation of steps which are involved in manufacturing Process. It includes eight Steps. You can change color, size and orientation of any icon to your liking.-PPT round implementation of 8 steps involved procedure PowerPoint Templates-Analysis, Art, Blank, Blue, Business, Categories, Chart, Chief, Circle, Clip, Clipart, Corporate, Design, Diagram, Directors, Element, Executive, Financial, Graph, Graphic, Green, Heading, Icon, Illustration, Implementation, Isolated, Managers, Media, Network, Officer, Perspective, Pie, President, Red, Relations, Role, Round, Sales, Segments, Set, Six, Staff, Strategic, Title, Vector, Vice, Wheel Experience fantasy with our Ppt Round Implementation Of 8 Steps Involved Procedure PowerPoint Templates. Energise the creativity of your audience.

Colored Arrows Business Growth PowerPoint Templates And PowerPoint Themes 1012
Colored Arrows Business Growth PowerPoint Templates And PowerPoint Themes 1012-The above template displays a diagram of 3d colorful arrows on abstract world map background. This image represents the concept of business growth and success. Use this template for business and corporate purposes. It imitates competition, communication, financial, graph, growth, progress, sales, success and target. This image has been conceived to enable you to emphatically communicate your ideas in your Leadership and Marketing PPT presentations. Create captivating presentations to deliver comparative and weighted arguments.-Colored Arrows Business Growth PowerPoint Templates And PowerPoint Themes 1012-This PowerPoint template can be used for presentations relating to-Colored arrows vector, business, success, competition, leadership, finance Dont ignore the perils of a boring presentation. Liven it up with our Colored Arrows Business Growth PowerPoint Templates And PowerPoint Themes 1012. Make sure your presentation gets the attention it deserves.
Key Financials Template Ppt PowerPoint Presentation Icon
This is a key financials template ppt powerpoint presentation icon. This is a three stage process. The stages in this process are business, finance, marketing, strategy, success, analysis.
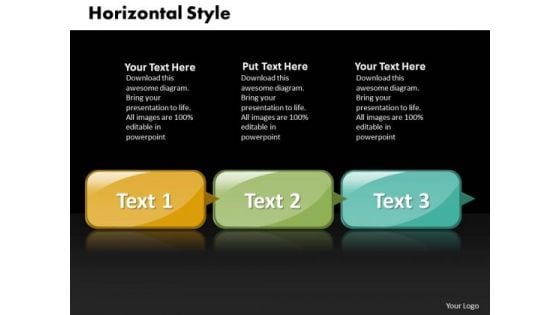
Ppt Horizontal Picture Style PowerPoint 2010 3 State Diagram Templates
PPT horizontal picture style powerpoint 2010 3 state diagram Templates-This diagram is an amazing tool to ensure that strategic planning sessions contribute to teambuilding.-PPT horizontal picture style powerpoint 2010 3 state diagram Templates-Banner, Box, Business, Button, Chrome, Collection, Control, Design, Direction, Element, Empty, Financial, Flow, Graph, Green, Header, Horizontal, Style, Illustration, Image, Information, Process, Red, Retail, Round, Sale, Set, Shapes Be at the forefront with our Ppt Horizontal Picture Style PowerPoint 2010 3 State Diagram Templates. Your thoughts will acquire a cutting edge.
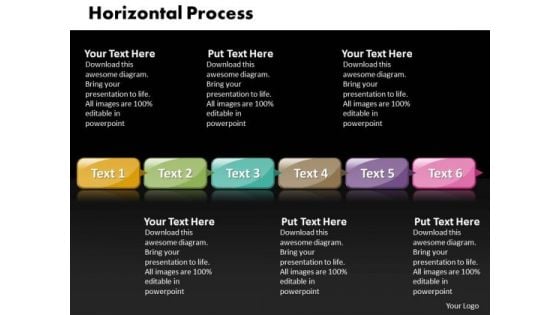
Ppt Horizontal Polished Style PowerPoint 2007 6 Stage Templates
PPT horizontal polished style powerpoint 2007 6 stage Templates-This PowerPoint diagram slide shows 6 stages in different colors. You can add text to this slide as per your need.-PPT horizontal polished style powerpoint 2007 6 stage Templates-Banner, Box, Business, Button, Chrome, Collection, Control, Design, Direction, Element, Empty, Financial, Flow, Graph, Green, Header, Horizontal, Illustration, Image, Information, Process, Red, Retail, Round, Sale, Set, Shapes Blow their minds with our Ppt Horizontal Polished Style PowerPoint 2007 6 Stage Templates. Just download, type and present.
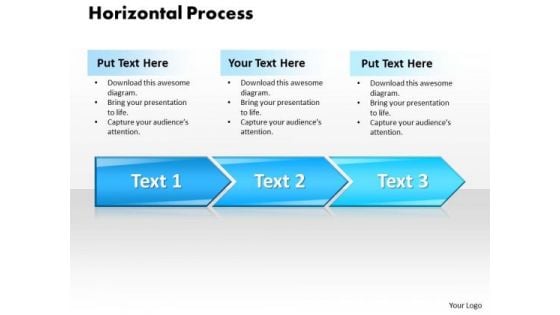
Ppt Horizontal Style 3 Stages 1 PowerPoint Templates
PPT horizontal style 3 stages 1 PowerPoint Templates-This diagram provides an overview of the interactions of different factors in a company.-PPT horizontal style 3 stages 1 PowerPoint Templates-Banner, Arrows, Business, Button, Chrome, Collection, Control, Design, Direction, Element, Empty, Financial, Flow, Graph, Green, Header, Horizontal, Illustration, Image, Information, Process, Red, Retail, Round, Sale, Set, Shapes Be on the ball with our Ppt Horizontal Style 3 Stages 1 PowerPoint Templates. Just download, type and present.
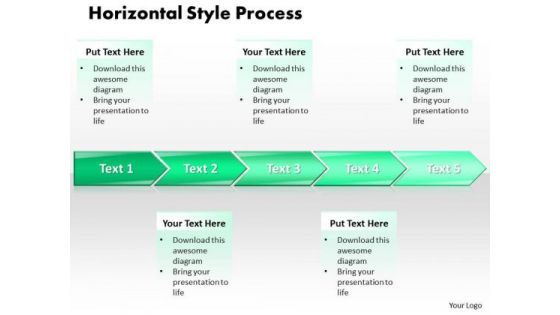
Ppt Horizontal Style 5 Stages 1 PowerPoint Templates
PPT horizontal style 5 stages 1 PowerPoint Templates-This PowerPoint diagram slide shows 5 steps in different colors. You can add text to this slide as per your need.-PPT horizontal style 5 stages 1 PowerPoint Templates-Banner, Arrows, Business, Button, Chrome, Collection, Control, Design, Direction, Element, Empty, Financial, Flow, Graph, Green, Header, Horizontal, Illustration, Image, Information, Process, Red, Retail, Round, Sale, Set, Shapes Experience a high with our Ppt Horizontal Style 5 Stages 1 PowerPoint Templates. Let your thoughts soar in the air.
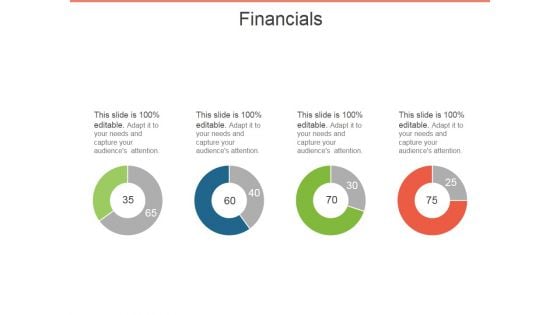
Financials Ppt PowerPoint Presentation Model Background
This is a financials ppt powerpoint presentation model background. This is a four stage process. The stages in this process are financials, business, process, marketing, success.
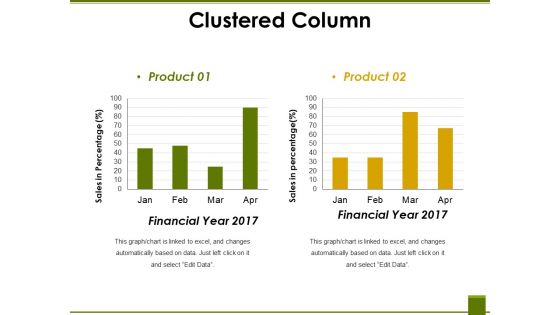
Clustered Column Ppt PowerPoint Presentation Ideas Graphic Tips
This is a clustered column ppt powerpoint presentation ideas graphic tips. This is a two stage process. The stages in this process are financial year, sales in percentage, product, graph, business.
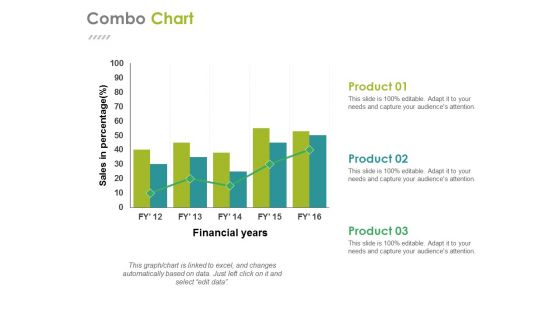
Combo Chart Ppt PowerPoint Presentation Gallery Design Ideas
This is a combo chart ppt powerpoint presentation gallery design ideas. This is a three stage process. The stages in this process are business, financial years, sales in percentage, finance, graph.
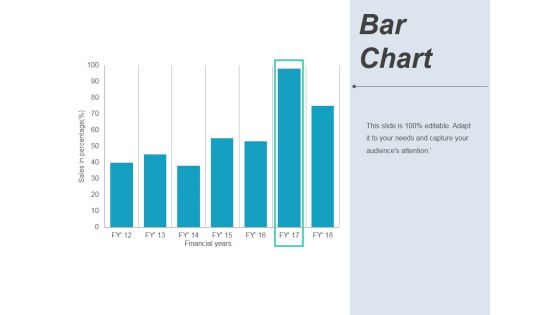
Bar Chart Ppt PowerPoint Presentation Pictures Background Image
This is a bar chart ppt powerpoint presentation pictures background image. This is a seven stage process. The stages in this process are financial years, sales in percentage, graph, business.
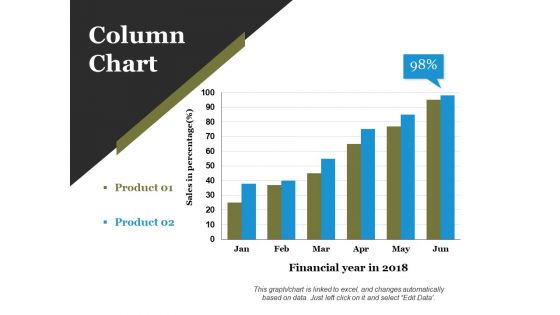
Column Chart Ppt PowerPoint Presentation Infographics Layout Ideas
This is a column chart ppt powerpoint presentation infographics layout ideas. This is a two stage process. The stages in this process are financial year in, business, marketing, growth, graph.
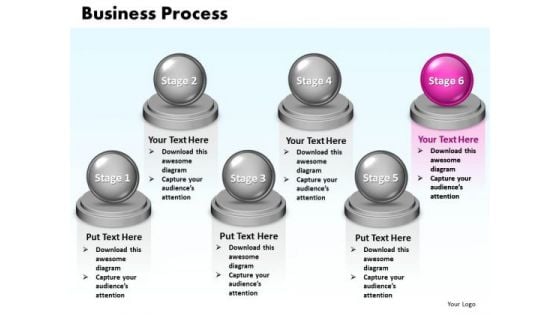
Ppt Steps Of Business Process Six Stages Marketing Presentation PowerPoint 0812 Templates
PPT steps of business process six stages marketing presentation powerpoint 0812 Templates-You have what it takes to grow. Take your team along by explaining your plans with this attractive PPT slide. Go ahead and add charm and personality to your presentations-PPT steps of business process six stages marketing presentation powerpoint 0812 Templates-achievement, aspirations, blank, blue, business, chart, competition, consultant, control, copy, diagram, drawing, expertise, finance, financial, future, graph, growth, hand, improvement, increase, investment, isolated, leadership, line, manager, market, progress, selling, shares, space, stock, success Intensify growth with our Ppt Steps Of Business Process Six Stages Marketing Presentation PowerPoint 0812 Templates. Download without worries with our money back guaranteee.
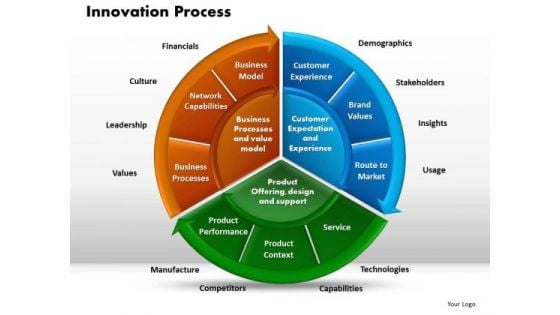
Business Circle Chart PowerPoint Templates Editable Innovation Process Ppt Slides
Business Circle Chart PowerPoint Templates Editable Innovation Process PPT Slides-Use this circle chart to make your team understand complex processes.-Business Circle Chart PowerPoint Templates Editable Innovation Process PPT Slides-This template can be used for presentations relating to Aluminum, Analyze, Business, Chart, Colors, Column, Company, Computer, Corporate, Create, Data, Design, Drawing, Figures, Financial, Flowchart, Graph, Idea, Innovate, Keyboard, Layout, Notepad, Notes, Numbers, Organizational, Pie, Plan, Planning, Process Exude assurance with our Business Circle Chart PowerPoint Templates Editable Innovation Process Ppt Slides. Deliver your words with extreme confidence.


 Continue with Email

 Home
Home


