Financial Graphs
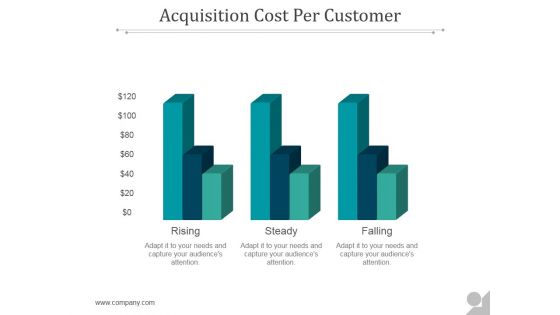
Acquisition Cost Per Customer Ppt PowerPoint Presentation Example 2015
This is a acquisition cost per customer ppt powerpoint presentation example 2015. This is a three stage process. The stages in this process are rising, steady, falling.
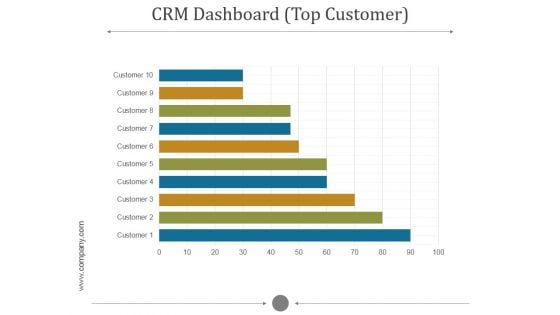
Crm Dashboard Top Customer Ppt PowerPoint Presentation Ideas
This is a crm dashboard top customer ppt powerpoint presentation ideas. This is a five stage process. The stages in this process are customer.
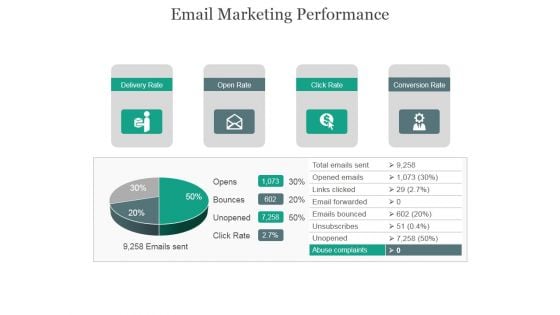
Email Marketing Performance Ppt PowerPoint Presentation Layouts
This is a email marketing performance ppt powerpoint presentation layouts. This is a four stage process. The stages in this process are delivery rate, open rate, click rate, conversion rate.
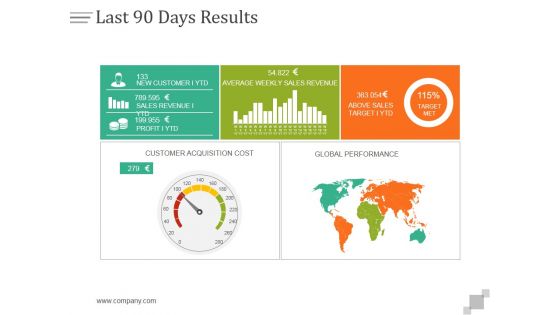
Last 90 Days Results Ppt PowerPoint Presentation Layouts
This is a last 90 days results ppt powerpoint presentation layouts. This is a five stage process. The stages in this process are business, finance, marketing, strategy, analysis, success.
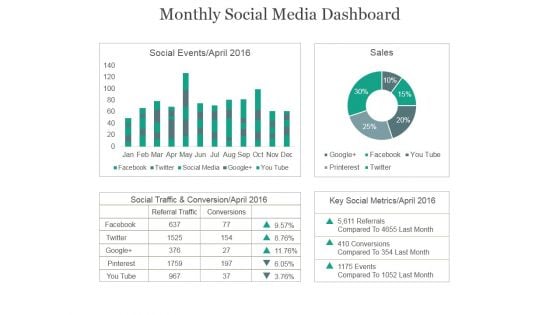
Monthly Social Media Dashboard Ppt PowerPoint Presentation Example 2015
This is a monthly social media dashboard ppt powerpoint presentation example 2015. This is a four stage process. The stages in this process are social events, sales, social traffic, conservation, key social metrics.
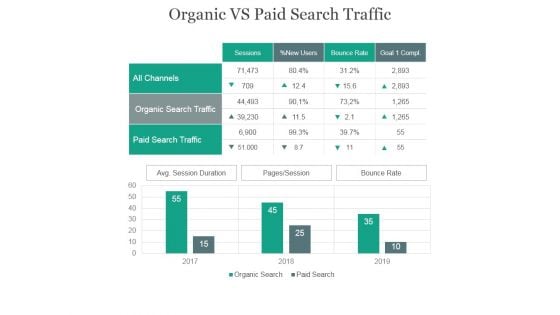
Organic Vs Paid Search Traffic Ppt PowerPoint Presentation Show
This is a organic vs paid search traffic ppt powerpoint presentation show. This is a four stage process. The stages in this process are all channels, organic search traffic, paid search traffic, sessions.
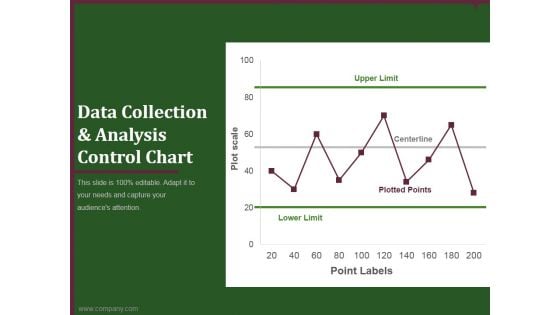
data collection and analysis control chart ppt powerpoint presentation styles
This is a data collection and analysis control chart ppt powerpoint presentation styles. This is a one stage process. The stages in this process are upper limit, centerline, plotted points, lower limit, point labels.
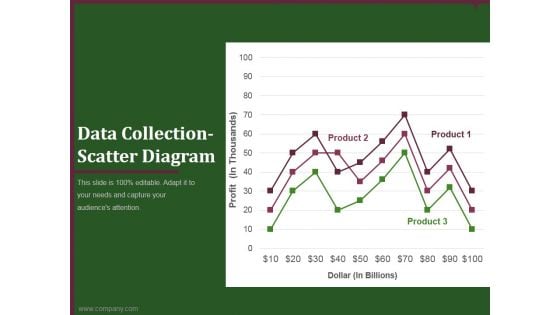
data collection scatter diagram ppt powerpoint presentation inspiration
This is a data collection scatter diagram ppt powerpoint presentation inspiration. This is a three stage process. The stages in this process are business, planning, marketing, scatter diagram, finance.
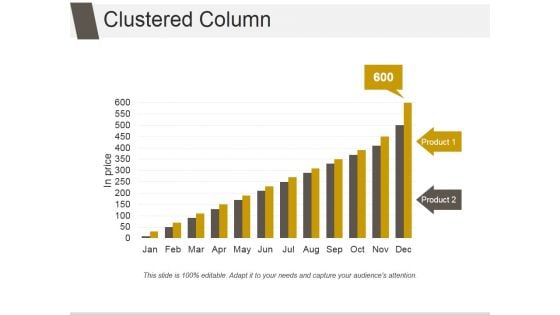
Clustered Column Ppt PowerPoint Presentation Images
This is a clustered column ppt powerpoint presentation images. This is a twelve stage process. The stages in this process are business, marketing, finance, growth, timeline.
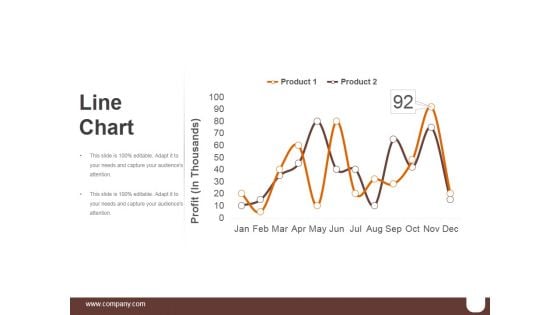
Line Chart Ppt PowerPoint Presentation Layout
This is a line chart ppt powerpoint presentation layout. This is a two stage process. The stages in this process are business, marketing, line chart, finance, management.
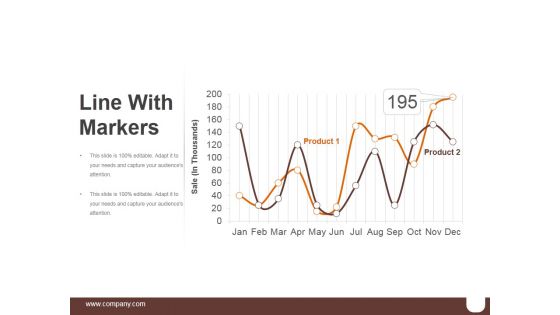
Line With Markers Ppt PowerPoint Presentation Microsoft
This is a line with markers ppt powerpoint presentation microsoft. This is a two stage process. The stages in this process are business, marketing, line chart, finance, management.
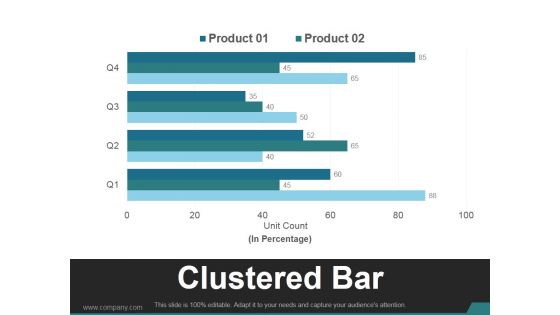
Clustered Bar Ppt PowerPoint Presentation Gallery
This is a clustered bar ppt powerpoint presentation gallery. This is a four stage process. The stages in this process are business, marketing, clustered bar, product, finance.
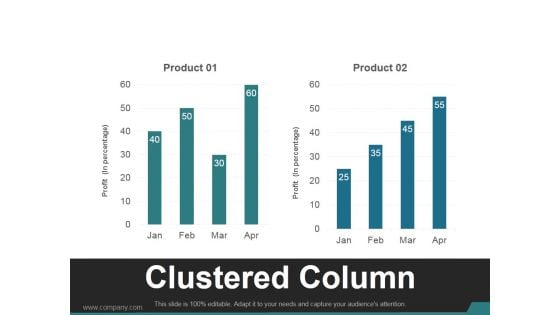
Clustered Column Ppt PowerPoint Presentation Deck
This is a clustered column ppt powerpoint presentation deck. This is a two stage process. The stages in this process are business, marketing, clustered column, product, finance.

Combo Chart Template 1 Ppt PowerPoint Presentation Inspiration
This is a combo chart template 1 ppt powerpoint presentation inspiration. This is a four stage process. The stages in this process are business, marketing, growth, product, finance.
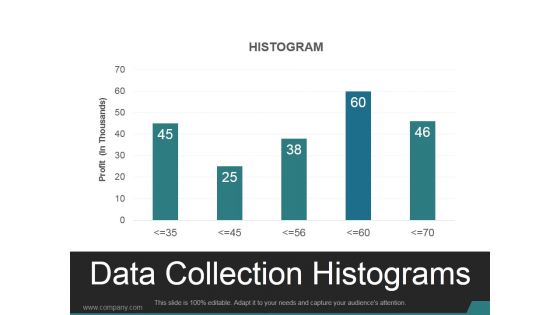
Data Collection Histograms Ppt PowerPoint Presentation Design Templates
This is a data collection histograms ppt powerpoint presentation design templates. This is a five stage process. The stages in this process are histogram, business, marketing, analysis, chart.
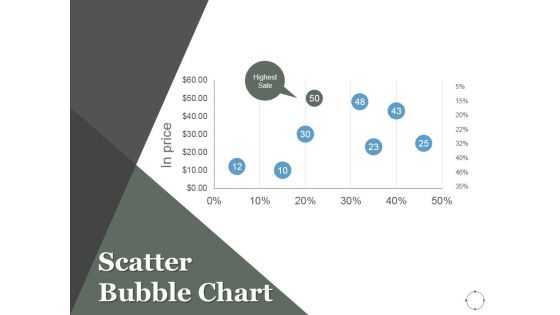
Scatter Bubble Chart Ppt PowerPoint Presentation Background Designs
This is a scatter bubble chart ppt powerpoint presentation background designs. This is a eight stage process. The stages in this process are projects, marketing, scatter chart, finance, management.
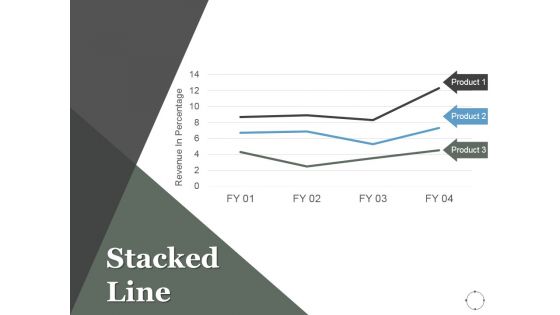
Stacked Line Ppt PowerPoint Presentation Outline
This is a stacked line ppt powerpoint presentation outline. This is a three stage process. The stages in this process are projects, marketing, stacked line, finance, product.
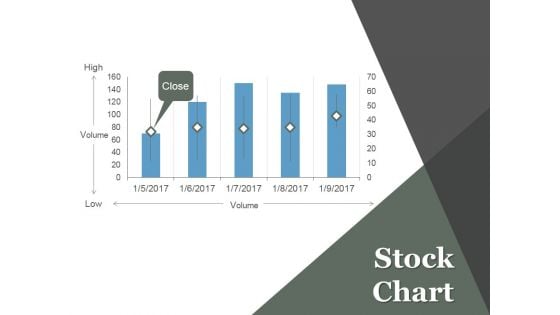
Stock Chart Ppt PowerPoint Presentation Information
This is a stock chart ppt powerpoint presentation information. This is a five stage process. The stages in this process are projects, marketing, high, volume, low.
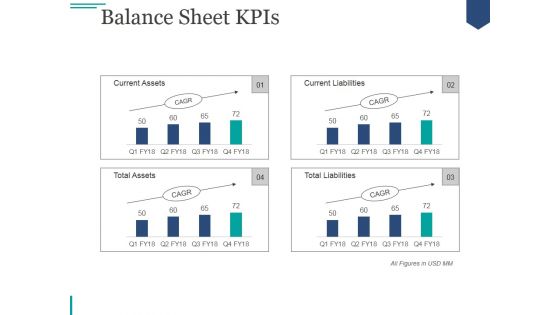
Balance Sheet Kpis Ppt PowerPoint Presentation Professional
This is a balance sheet kpis ppt powerpoint presentation professional. This is a four stage process. The stages in this process are current assets, current liabilities, total assets, total liabilities.
Scatter Bubble Chart Ppt PowerPoint Presentation Icon Templates
This is a scatter bubble chart ppt powerpoint presentation icon templates. This is a eight stage process. The stages in this process are business, finance, management, scatter chart, marketing.
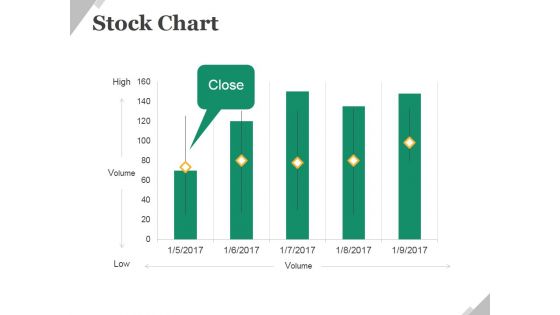
Stock Chart Ppt PowerPoint Presentation Slides Example File
This is a stock chart ppt powerpoint presentation slides example file. This is a five stage process. The stages in this process are business, finance, stock chart, management, planning.
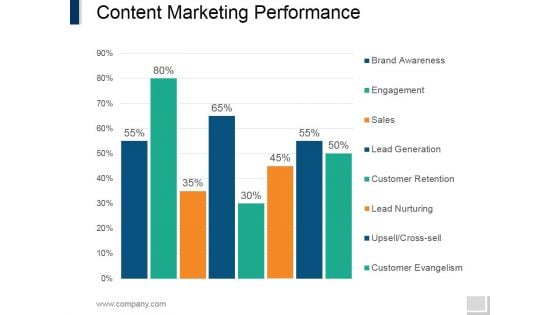
Content Marketing Performance Template 1 Ppt PowerPoint Presentation Infographics Graphics Example
This is a content marketing performance template 1 ppt powerpoint presentation infographics graphics example. This is a eight stage process. The stages in this process are brand awareness, engagement, sales, lead generation, customer retention lead nurturing, upsell.

Organic Visits And Backlinks Ppt PowerPoint Presentation File Outline
This is a organic visits and backlinks ppt powerpoint presentation file outline. This is a two stage process. The stages in this process are rank, domain authority, backlinks, yahoo.
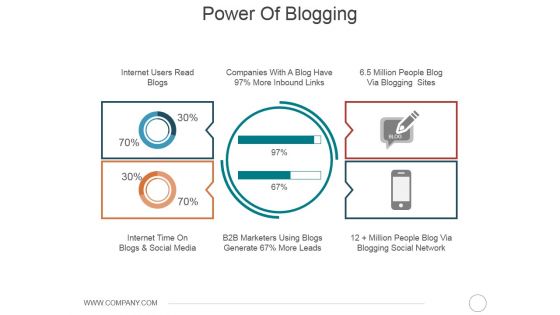
Power Of Blogging Ppt PowerPoint Presentation Model Example Introduction
This is a power of blogging ppt powerpoint presentation model example introduction. This is a five stage process. The stages in this process are finance, business, marketing, analysis, planning.
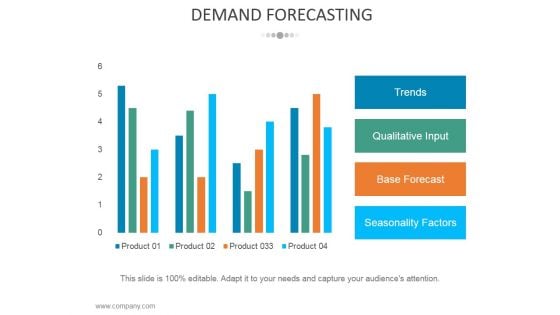
Demand Forecasting Template 1 Ppt PowerPoint Presentation Styles Gridlines
This is a demand forecasting template 1 ppt powerpoint presentation styles gridlines. This is a four stage process. The stages in this process are trends, qualitative input, base forecast, seasonality factors.
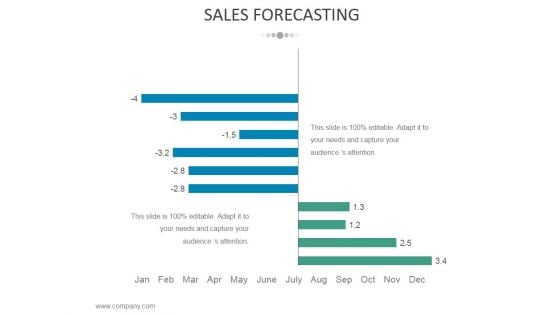
Sales Forecasting Template 1 Ppt PowerPoint Presentation Infographic Template Maker
This is a sales forecasting template 1 ppt powerpoint presentation infographic template maker. This is a two stage process. The stages in this process are business, strategy, marketing, analysis, finance.
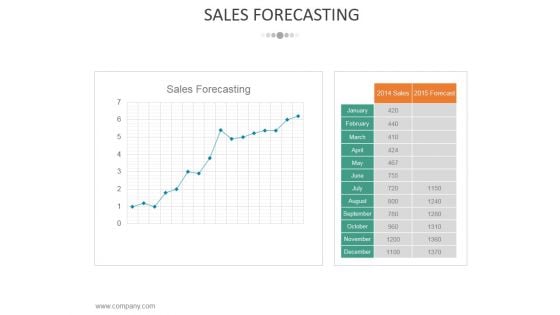
Sales Forecasting Template 2 Ppt PowerPoint Presentation Infographic Template Themes
This is a sales forecasting template 2 ppt powerpoint presentation infographic template themes. This is a two stage process. The stages in this process are business, strategy, marketing, analysis, finance.
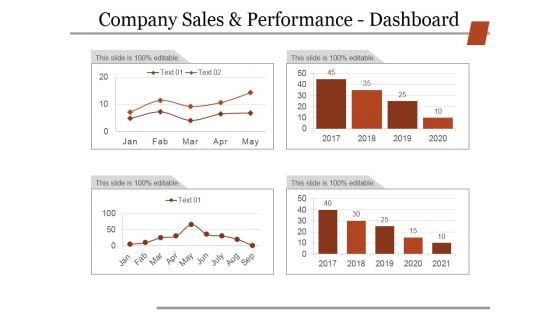
Company Sales And Performance Dashboard Ppt PowerPoint Presentation Slides Grid
This is a company sales and performance dashboard ppt powerpoint presentation slides grid. This is a four stage process. The stages in this process are business, strategy, marketing, finance, analysis.
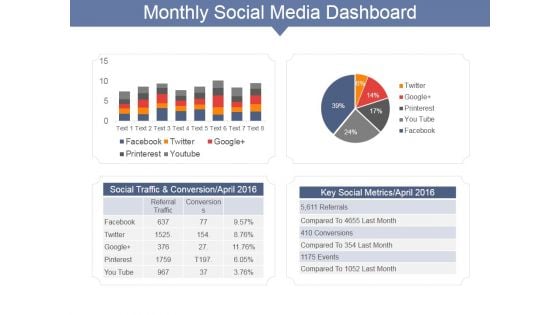
Monthly Social Media Dashboard Ppt PowerPoint Presentation Gallery Show
This is a monthly social media dashboard ppt powerpoint presentation gallery show. This is a two stage process. The stages in this process are social traffic and conversion april, key social metrics april, facebook, twitter.

Monthly Traffic Source Overview Ppt PowerPoint Presentation Portfolio Format Ideas
This is a monthly traffic source overview ppt powerpoint presentation portfolio format ideas. This is a three stage process. The stages in this process are direct traffic, referring sites, search engines, sources, keywords.
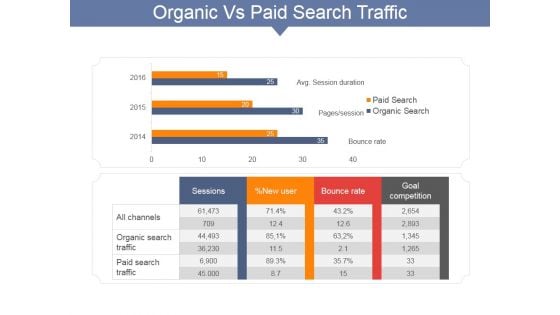
Organic Vs Paid Search Traffic Ppt PowerPoint Presentation Portfolio Master Slide
This is a organic vs paid search traffic ppt powerpoint presentation portfolio master slide. This is a two stage process. The stages in this process are sessions, all channels, organic search traffic, paid search traffic, bounce rate.
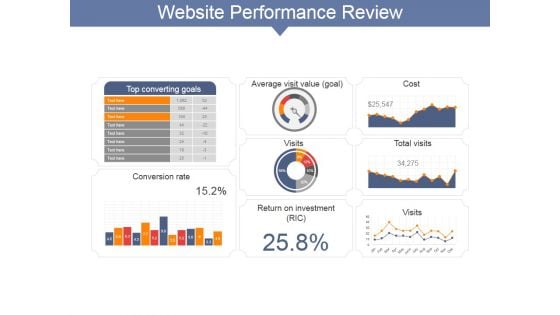
Website Performance Review Template Ppt PowerPoint Presentation Information
This is a website performance review template ppt powerpoint presentation information. This is a six stage process. The stages in this process are site consumption time, online transaction, top keywords non branded visits, average visit time.
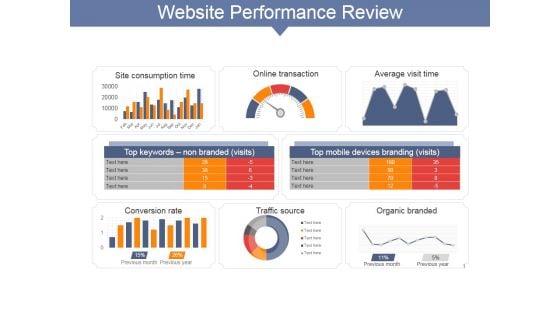
Website Performance Review Ppt PowerPoint Presentation File Visuals
This is a website performance review ppt powerpoint presentation file visuals. This is a eight stage process. The stages in this process are top converting goals, average visit value goal, cost, conversion rate, return on investment, visits .
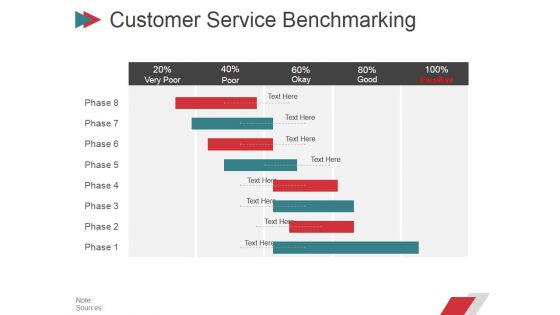
Customer Service Benchmarking Template Ppt PowerPoint Presentation Layouts Graphics Template
This is a customer service benchmarking template ppt powerpoint presentation layouts graphics template. This is a four stage process. The stages in this process are business, strategy, marketing, planning, finance.
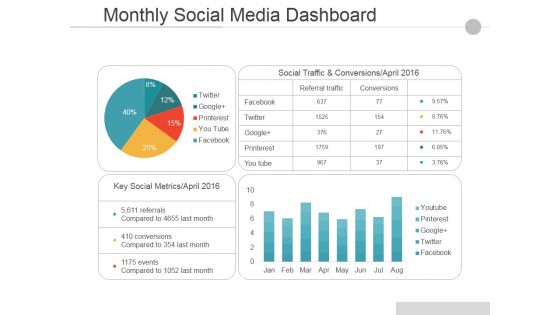
Monthly Social Media Dashboard Ppt PowerPoint Presentation Pictures Guide
This is a monthly social media dashboard ppt powerpoint presentation pictures guide. This is a two stage process. The stages in this process are social traffic and conversions april, key social metrics april, facebook, twitter, google.
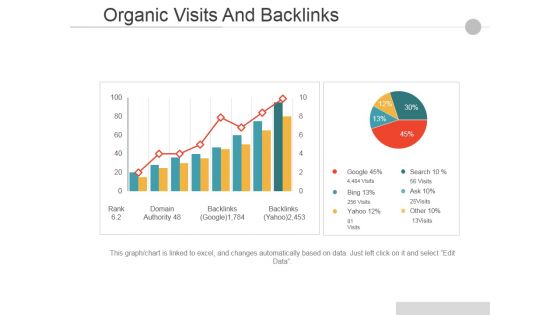
Organic Visits And Backlinks Ppt PowerPoint Presentation Inspiration Example Introduction
This is a Organic Visits And Backlinks Ppt PowerPoint Presentation Inspiration Example Introduction. This is a two stage process. The stages in this process are Business, Marketing, Finance, Success, Growth.
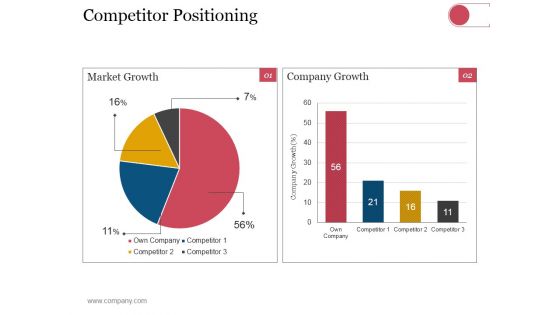
Competitor Positioning Ppt PowerPoint Presentation Pictures File Formats
This is a competitor positioning ppt powerpoint presentation pictures file formats. This is a two stage process. The stages in this process are business, strategy, analysis, planning, market growth, company growth.
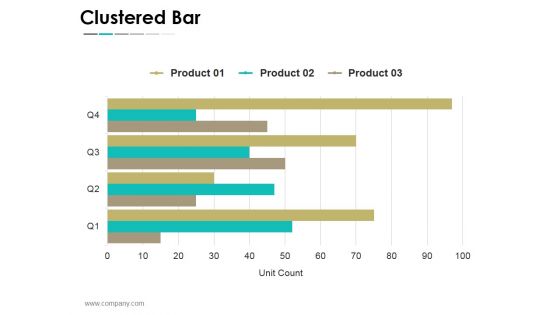
Clustered Bar Ppt PowerPoint Presentation Portfolio Clipart
This is a clustered bar ppt powerpoint presentation portfolio clipart. This is a four stage process. The stages in this process are business, strategy, analysis, planning, unit count.
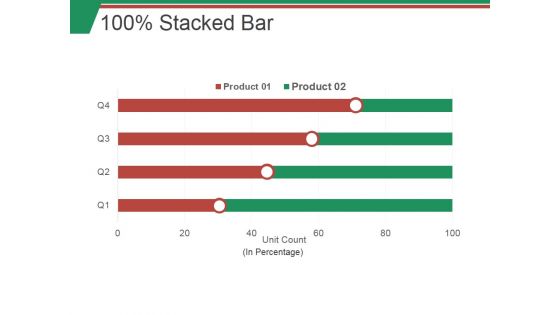
100 Stacked Bar Ppt PowerPoint Presentation Slides Skills
This is a 100 stacked bar ppt powerpoint presentation slides skills. This is a four stage process. The stages in this process are business, marketing, bar, finance, strategy.
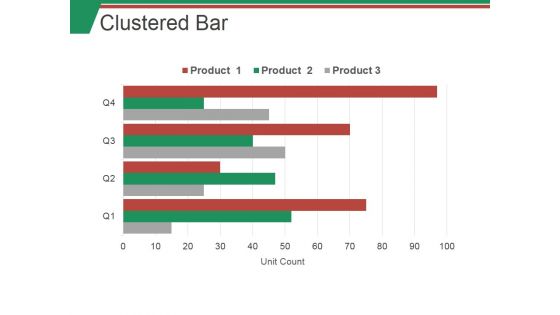
Clustered Bar Ppt PowerPoint Presentation Infographic Template Guidelines
This is a clustered bar ppt powerpoint presentation infographic template guidelines. This is a four stage process. The stages in this process are business, marketing, bar, finance, strategy.
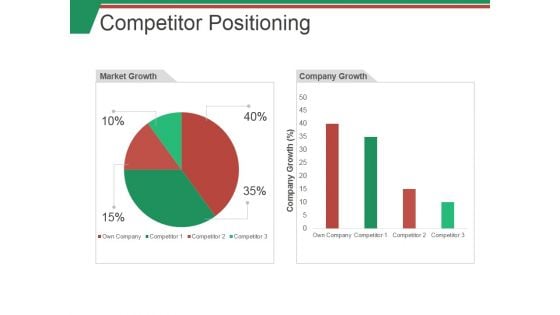
Competitor Positioning Ppt PowerPoint Presentation Show Example Introduction
This is a competitor positioning ppt powerpoint presentation show example introduction. This is a two stage process. The stages in this process are market growth, company growth, business, finance, percentage.
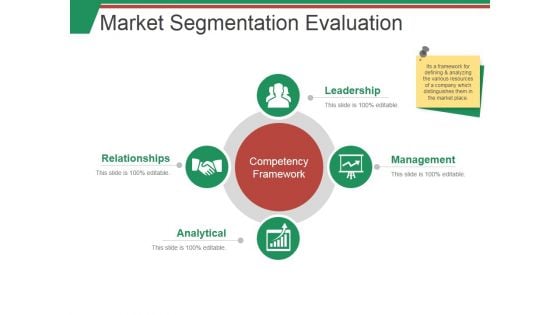
Market Segmentation Evaluation Template 1 Ppt PowerPoint Presentation Summary Smartart
This is a market segmentation evaluation template 1 ppt powerpoint presentation summary smartart. This is a two stage process. The stages in this process are market sales, net profit, beverages, milk product, nutrition.
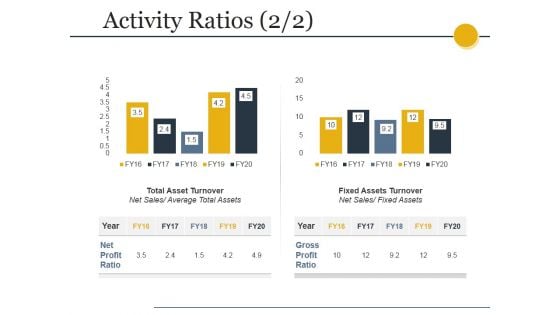
Activity Ratios Template 3 Ppt PowerPoint Presentation Professional Example
This is a activity ratios template 3 ppt powerpoint presentation professional example. This is a two stage process. The stages in this process are total asset turnover, net sales, fixed assets turnover, fixed assets.
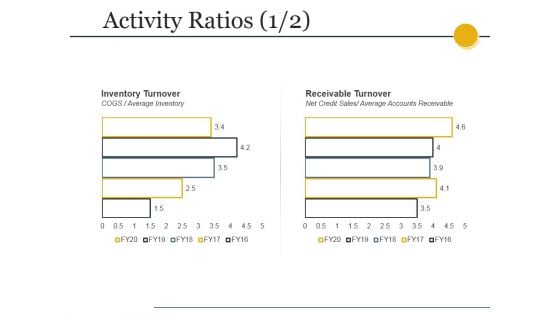
Activity Ratios Template Ppt PowerPoint Presentation Summary Slides
This is a activity ratios template ppt powerpoint presentation summary slides. This is a two stage process. The stages in this process are total asset turnover, net sales, fixed assets turnover, fixed assets.
Activity Ratios Ppt PowerPoint Presentation Icon Themes
This is a activity ratios ppt powerpoint presentation icon themes. This is a two stage process. The stages in this process are inventory turnover, cogs, average inventory, receivable turnover, net credit sales, average accounts receivable .
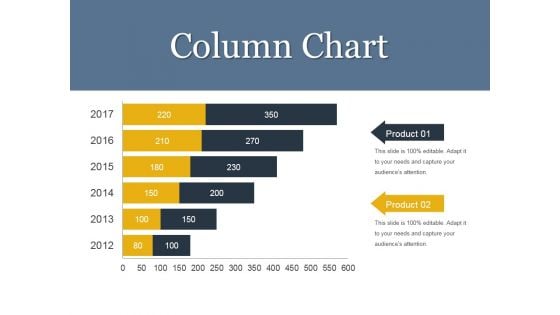
Column Chart Ppt PowerPoint Presentation Show Pictures
This is a column chart ppt powerpoint presentation show pictures. This is a six stage process. The stages in this process are business, finance, planning, years, marketing.
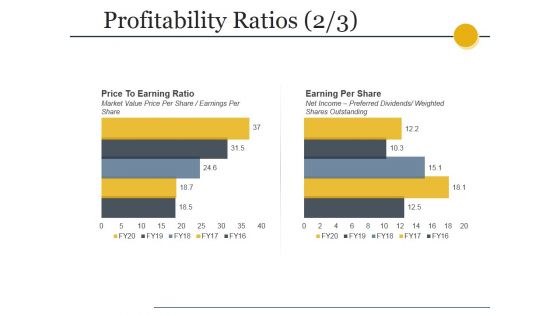
Profitability Ratios Template 2 Ppt PowerPoint Presentation Gallery Designs
This is a profitability ratios template 2 ppt powerpoint presentation gallery designs. This is a two stage process. The stages in this process are price to earning ratio, market value price per share earnings per share, earning per share, net income preferred dividends, weighted shares outstanding.
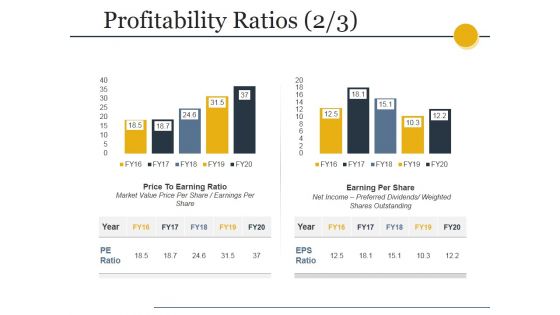
Profitability Ratios Template 4 Ppt PowerPoint Presentation Professional Deck
This is a profitability ratios template 4 ppt powerpoint presentation professional deck. This is a two stage process. The stages in this process are price to earning ratio, market value price per share earnings per share, earning per share, net income preferred dividends, weighted shares outstanding.
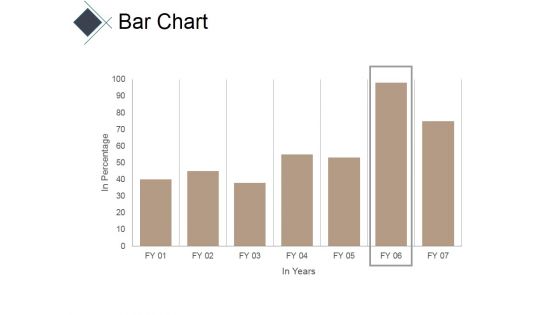
Bar Chart Ppt PowerPoint Presentation Model Good
This is a bar chart ppt powerpoint presentation model good. This is a seven stage process. The stages in this process are business, marketing, bar, success, finance.
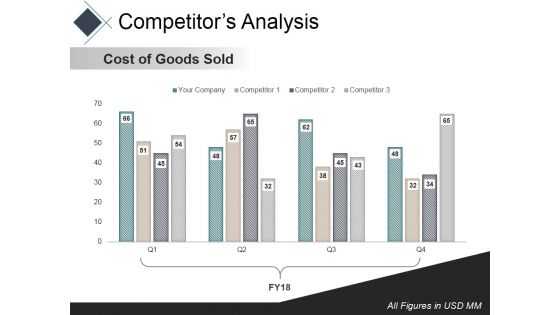
Competitors Analysis Template Ppt PowerPoint Presentation Infographic Template Rules
This is a competitors analysis template ppt powerpoint presentation infographic template rules. This is a four stage process. The stages in this process are net profit margin, finance, marketing, bar, success.
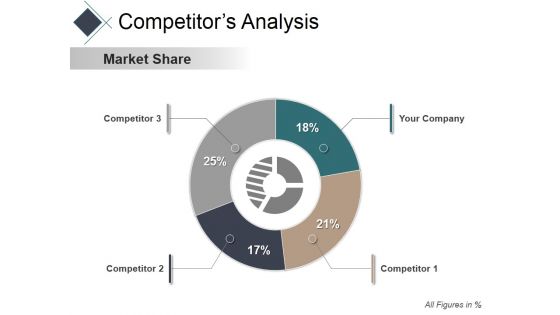
Competitors Analysis Ppt PowerPoint Presentation Inspiration Layout Ideas
This is a competitors analysis ppt powerpoint presentation inspiration layout ideas. This is a four stage process. The stages in this process are cost of goods sold, bar, finance, business, marketing, success.
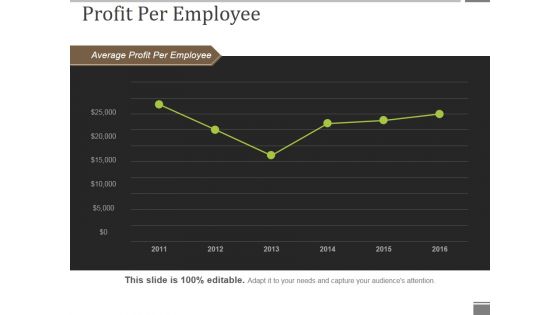
Profit Per Employee Ppt PowerPoint Presentation Show Portfolio
This is a profit per employee ppt powerpoint presentation show portfolio. This is a six stage process. The stages in this process are average profit per employee, line chart, business, marketing, success.
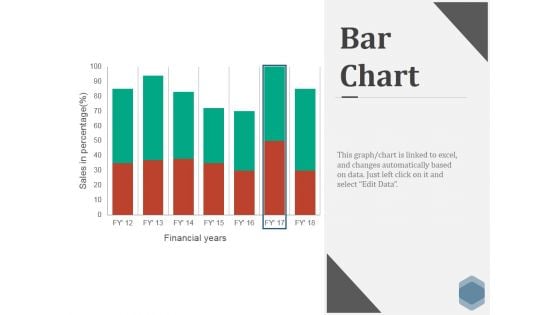
Bar Chart Ppt PowerPoint Presentation Infographics Skills
This is a bar chart ppt powerpoint presentation infographics skills. This is a seven stage process. The stages in this process are business, marketing, strategy, finance, bar.
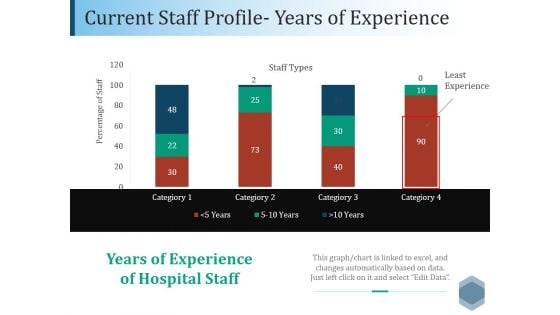
Current Staff Profile Years Of Experience Ppt PowerPoint Presentation File Graphics Tutorials
This is a current staff profile years of experience ppt powerpoint presentation file graphics tutorials. This is a four stage process. The stages in this process are business, marketing, strategy, finance, bar.
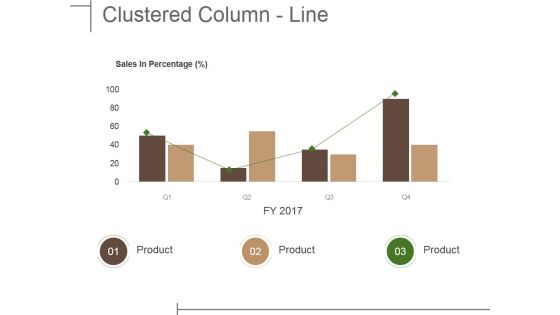
Clustered Column Line Ppt PowerPoint Presentation File Shapes
This is a clustered column line ppt powerpoint presentation file shapes. This is a four stage process. The stages in this process are business, marketing, strategy, bar, success.
Quarter Track Record Ppt PowerPoint Presentation Icon Show
This is a quarter track record ppt powerpoint presentation icon show. This is a two stage process. The stages in this process are business, finance, strategy, marketing, analysis.
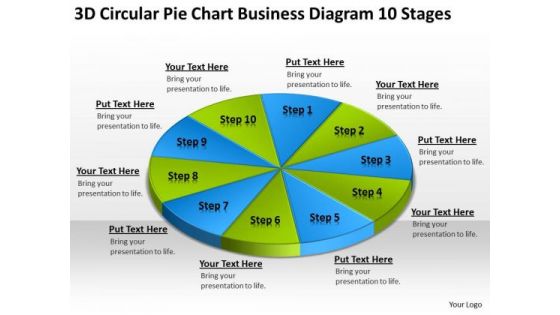
3d Circular Pie Chart Business Diagram 10 Stages Ppt Plan Layouts PowerPoint Slides
We present our 3d circular pie chart business diagram 10 stages ppt plan layouts PowerPoint Slides.Present our Circle Charts PowerPoint Templates because Our PowerPoint Templates and Slides help you meet the demand of the Market. Just browse and pick the slides that appeal to your intuitive senses. Download and present our Business PowerPoint Templates because It will Strengthen your hand with your thoughts. They have all the aces you need to win the day. Download and present our Marketing PowerPoint Templates because Our PowerPoint Templates and Slides are designed to help you succeed. They have all the ingredients you need. Download and present our Process and Flows PowerPoint Templates because You can Channelise the thoughts of your team with our PowerPoint Templates and Slides. Urge them to focus on the goals you have set. Use our Shapes PowerPoint Templates because Our PowerPoint Templates and Slides are effectively colour coded to prioritise your plans They automatically highlight the sequence of events you desire.Use these PowerPoint slides for presentations relating to Pie, chart, vector, stock, market, isolated, slice, isometric, perspective, green, business, blank, concept, sign, presentation, symbol, diagram, circle, ring, graphic, finance, element, report, black, abstract, graph, illustration, icon, blue, organization, background, financial. The prominent colors used in the PowerPoint template are Green, Blue, Black. Earn the esteem of your colleagues with our 3d Circular Pie Chart Business Diagram 10 Stages Ppt Plan Layouts PowerPoint Slides. Give your thoughts that something special.
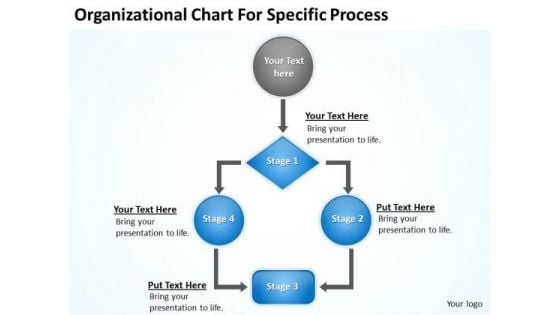
Organizational Chart For Specific Procee Ppt Business Plan Form PowerPoint Slides
We present our organizational chart for specific procee ppt business plan form PowerPoint Slides.Download our Process and Flows PowerPoint Templates because You are an avid believer in ethical practices. Highlight the benefits that accrue with our PowerPoint Templates and Slides. Use our Business PowerPoint Templates because Our PowerPoint Templates and Slides provide you with a vast range of viable options. Select the appropriate ones and just fill in your text. Present our Success PowerPoint Templates because you can Add colour to your speech with our PowerPoint Templates and Slides. Your presentation will leave your audience speechless. Download our Flow Charts PowerPoint Templates because It can be used to Set your controls for the heart of the sun. Our PowerPoint Templates and Slides will be the propellant to get you there. Download our Shapes PowerPoint Templates because You canTake a leap off the starting blocks with our PowerPoint Templates and Slides. They will put you ahead of the competition in quick time.Use these PowerPoint slides for presentations relating to Process, flow, business, chart, grow, financials, corporate, profitability, income, contracts, success, presentation, management, graph, prices, organizational, share, reports, professional, company, organization. The prominent colors used in the PowerPoint template are Gray, Blue, White. Expect great things with our Organizational Chart For Specific Procee Ppt Business Plan Form PowerPoint Slides. You will come out on top.
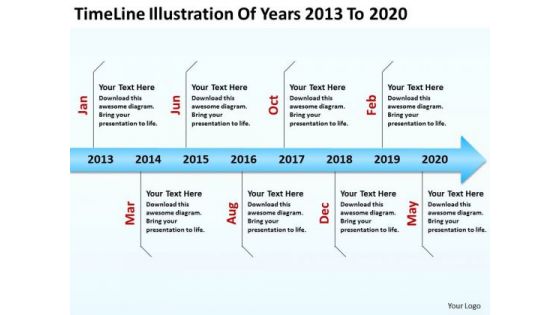
Diagram Business Process Of Years 2013 To 2020 PowerPoint Templates Ppt Backgrounds For Slides
We present our diagram business process of years 2013 to 2020 PowerPoint templates PPT backgrounds for slides.Present our Finance PowerPoint Templates because You can Inspire your team with our PowerPoint Templates and Slides. Let the force of your ideas flow into their minds. Present our Marketing PowerPoint Templates because It can Bubble and burst with your ideas. Download our Arrows PowerPoint Templates because You can Create a matrix with our PowerPoint Templates and Slides. Feel the strength of your ideas click into place. Download and present our Success PowerPoint Templates because You can Double your output with our PowerPoint Templates and Slides. They make beating deadlines a piece of cake. Use our Business PowerPoint Templates because You have the co-ordinates for your destination of success. Let our PowerPoint Templates and Slides map out your journey.Use these PowerPoint slides for presentations relating to Achieve, Arrow, Abstract, Arrow, Arrow Sign, Banking, Better, Business, Climb, Climbing, Diagram, Direction, Economy, Get, Goal, Economic, Economy, Efficiency, Finance, Financial, Flow, Forecast, Gain, Gold, Graph, Green, Growing, Growth, Illustration, Improve, Improvement, Increase, Investment, Isolated, Leader, Market, Marketing, Plan, Profit, Progress, Prosperity, Report, Rise, Statistics, Success, Symbol, Initiation, New, Progress, Start, Success, Year. The prominent colors used in the PowerPoint template are Blue, Red, Black. You are due to debut on the dais. Ensure an auspicious entry into this environment with our Diagram Business Process Of Years 2013 To 2020 PowerPoint Templates Ppt Backgrounds For Slides
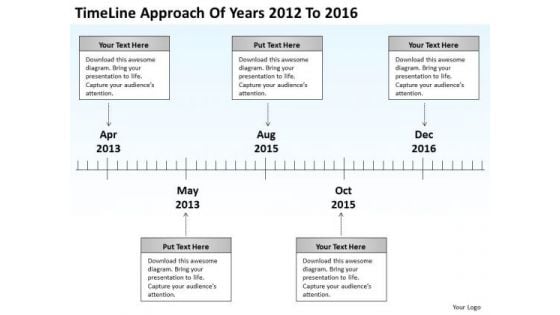
Diagram Business Process Of Years 2012 To 2016 PowerPoint Templates Ppt Backgrounds For Slides
We present our diagram business process of years 2012 to 2016 PowerPoint templates PPT backgrounds for slides.Download and present our Finance PowerPoint Templates because Our PowerPoint Templates and Slides will let you Clearly mark the path for others to follow. Use our Marketing PowerPoint Templates because Our PowerPoint Templates and Slides are topically designed to provide an attractive backdrop to any subject. Download and present our Arrows PowerPoint Templates because Our PowerPoint Templates and Slides will effectively help you save your valuable time. They are readymade to fit into any presentation structure. Download and present our Success PowerPoint Templates because Our PowerPoint Templates and Slides will help you be quick off the draw. Just enter your specific text and see your points hit home. Download and present our Business PowerPoint Templates because Our PowerPoint Templates and Slides will bullet point your ideas. See them fall into place one by one.Use these PowerPoint slides for presentations relating to Achieve, Banking, Better, Business, Climb, Climbing, Diagram, Direction, Economy, Get, Goal, Economic, Economy, Efficiency, Finance, Financial, Flow, Forecast, Gain, Gold, Graph, Green, Growing, Growth, Illustration, Improve, Improvement, Increase, Investment, Isolated, Leader, Market, Marketing, Plan, Profit, Progress, Prosperity, Report, Rise, Statistics, Success, Symbol, Initiation, New, Progress, Start, Success, Year. The prominent colors used in the PowerPoint template are White, Gray, Black. Our Diagram Business Process Of Years 2012 To 2016 PowerPoint Templates Ppt Backgrounds For Slides are never far from you. They will come to your assistance in a click.


 Continue with Email

 Home
Home


