Financial Growth
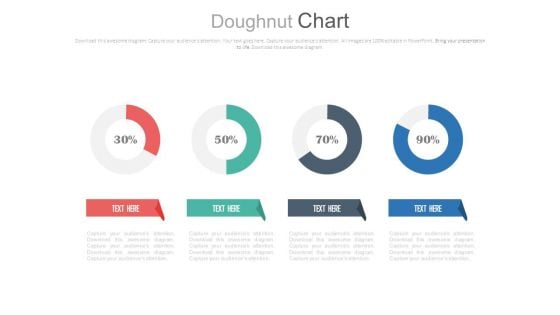
Four Circle Chart With Percentage Ratios Powerpoint Slides
This PowerPoint template has been designed with graphics of four circles and percentage ratios. You may use this dashboard slide design for topics like profit growth and financial planning. This PPT slide is powerful tool to describe your ideas.
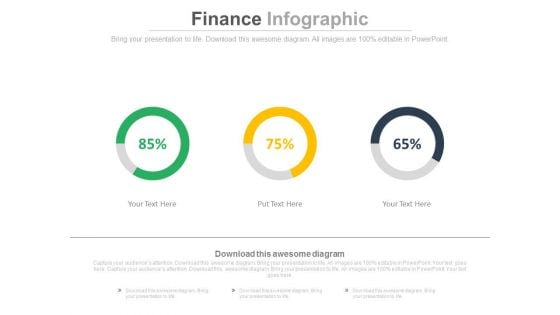
Linear Circles Percentage Analysis Charts Powerpoint Slides
This PowerPoint template has been designed with graphics of three circles and percentage ratios. You may use this dashboard slide design for topics like profit growth and financial planning. This PPT slide is powerful tool to describe your ideas.
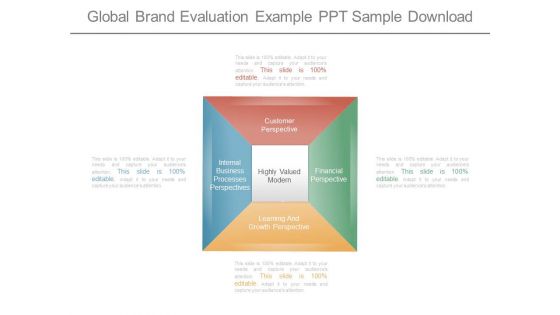
Global Brand Evaluation Example Ppt Sample Download
This is a global brand evaluation example ppt sample download. This is a four stage process. The stages in this process are customer perspective, internal business processes perspectives, highly valued modern, financial perspective, learning and growth perspective.
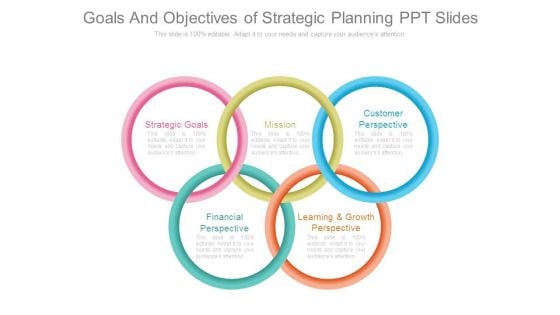
Goals And Objectives Of Strategic Planning Ppt Slides
This is a goals and objectives of strategic planning ppt slides. This is a five stage process. The stages in this process are strategic goals, mission, customer perspective, learning and growth perspective, financial perspective.
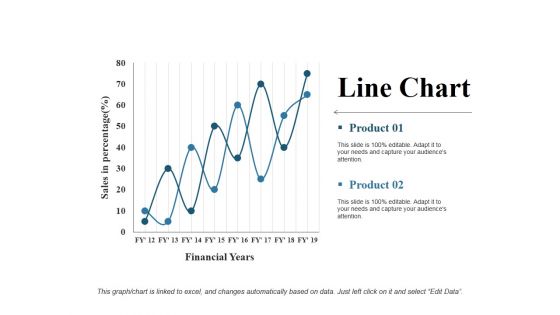
Line Chart Ppt PowerPoint Presentation Gallery Rules
This is a line chart ppt powerpoint presentation gallery rules. This is a two stage process. The stages in this process are financial years, product, sales in percentage, line chart, growth.
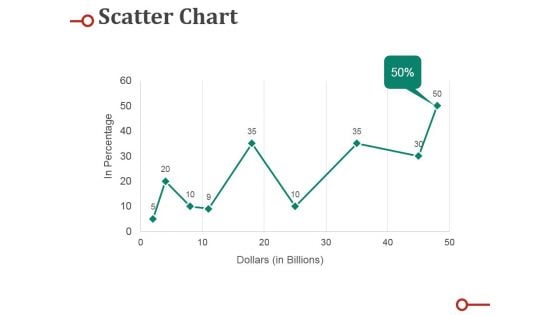
Scatter Chart Ppt PowerPoint Presentation Professional Deck
This is a scatter chart ppt powerpoint presentation professional deck. This is a nine stage process. The stages in this process are percentage, business, marketing, graph, line.
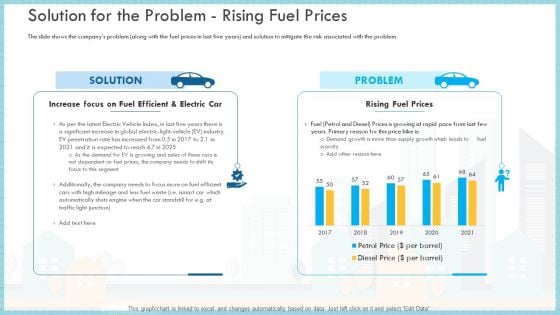
Loss Of Income And Financials Decline In An Automobile Organization Case Study Solution For The Problem Rising Fuel Prices Themes PDF
The slide shows the companys problem along with the fuel prices in last five years and solution to mitigate the risk associated with the problem.Deliver an awe-inspiring pitch with this creative loss of income and financials decline in an automobile organization case study solution for the problem rising fuel prices themes pdf bundle. Topics like increase focus on fuel efficient and electric car, rising fuel prices, demand growth is more than supply growth which leads to fuel scarcity can be discussed with this completely editable template. It is available for immediate download depending on the needs and requirements of the user.
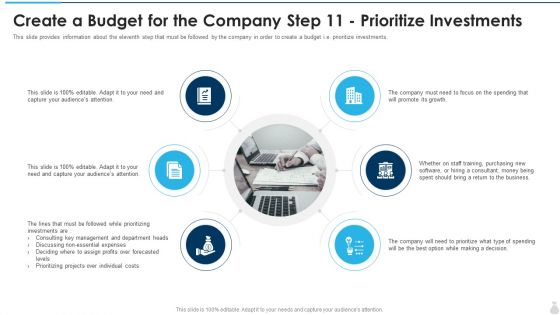
Create A Budget For The Company Step 11 Prioritize Investments Slides PDF
This slide provides information about the second step that must be followed by the company in order to create a budget i.e. revenue projections. This is a create a budget for the company step 11 prioritize investments slides pdf template with various stages. Focus and dispense information on three stages using this creative set, that comes with editable features. It contains large content boxes to add your information on topics like revenue projections, financial, growth, organizational goals. You can also showcase facts, figures, and other relevant content using this PPT layout. Grab it now.
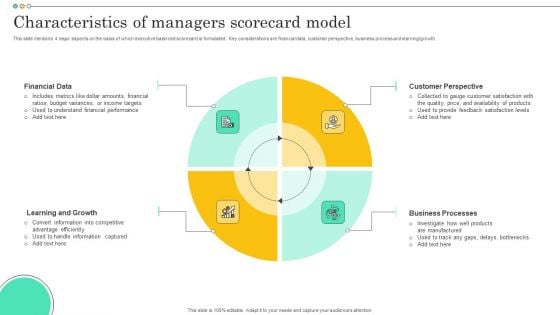
Characteristics Of Managers Scorecard Model Formats PDF

Investment Strategies For Stock Portfolio Management Ppt PowerPoint Presentation Complete Deck With Slides
This is a investment strategies for stock portfolio management ppt powerpoint presentation complete deck with slides. This is a one stage process. The stages in this process are portfolio, management, business, growth, strategy.
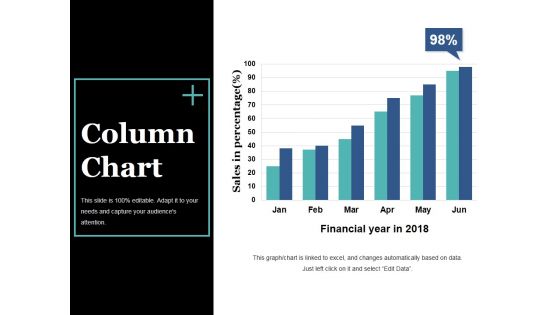
Column Chart Ppt PowerPoint Presentation Slides Visual Aids
This is a column chart ppt powerpoint presentation slides visual aids. This is a six stage process. The stages in this process are bar graph, growth, success, sales in percentage, financial year.
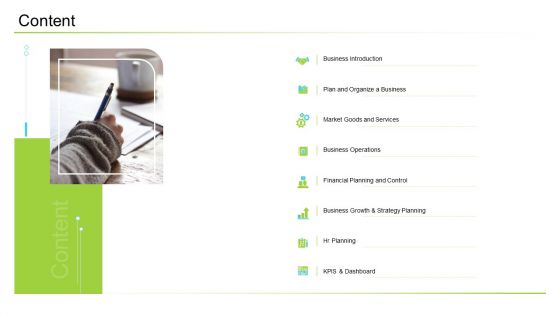
Business Management Content Ppt Gallery Display PDF
Presenting business management content ppt gallery display pdf to provide visual cues and insights. Share and navigate important information on eight stages that need your due attention. This template can be used to pitch topics like business introduction, organize, services, financial planning, growth. In addtion, this PPT design contains high resolution images, graphics, etc, that are easily editable and available for immediate download.
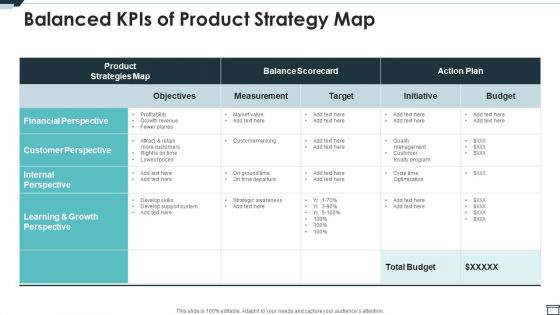
Balanced Kpis Of Product Strategy Map Ppt PowerPoint Presentation File Show PDF
Pitch your topic with ease and precision using this balanced kpis of product strategy map ppt powerpoint presentation file show pdf. This layout presents information on customer perspective, financial perspective, growth. It is also available for immediate download and adjustment. So, changes can be made in the color, design, graphics or any other component to create a unique layout.
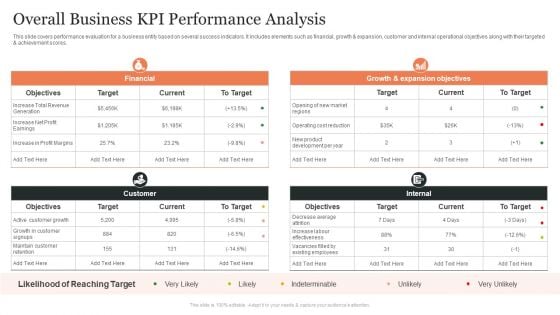
Overall Business KPI Performance Analysis Ppt Show Professional PDF
This slide covers performance evaluation for a business entity based on several success indicators. It includes elements such as financial, growth and expansion, customer and internal operational objectives along with their targeted and achievement scores. Pitch your topic with ease and precision using this Overall Business KPI Performance Analysis Ppt Show Professional PDF. This layout presents information on Internal, Customer, Financial. It is also available for immediate download and adjustment. So, changes can be made in the color, design, graphics or any other component to create a unique layout.

Bar Graph Business PowerPoint Templates And PowerPoint Themes 1012
Bar Graph Business PowerPoint Templates And PowerPoint Themes 1012-This PowerPoint Template shows the Bar Graph with increasing percentage which signifies the Financial Growth. The Template signifies the concept of business growth. The structure of our templates allows you to effectively highlight the key issues concerning the growth of your business. Our PPT images are so ideally designed that it reveals the very basis of our PPT template are an effective tool to make your clients understand.-Bar Graph Business PowerPoint Templates And PowerPoint Themes 1012-This PowerPoint template can be used for presentations relating to-Financial bar graph chart, technology, money, business, finance, marketing Handle a delicate situation with our Bar Graph Business PowerPoint Templates And PowerPoint Themes 1012. Just download, type and present.
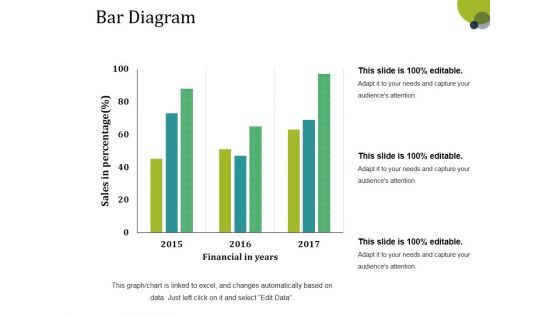
Bar Diagram Ppt PowerPoint Presentation Gallery Structure
This is a bar diagram ppt powerpoint presentation gallery structure. This is a three stage process. The stages in this process are financial in years, sales in percentage, bar graph, growth, success.
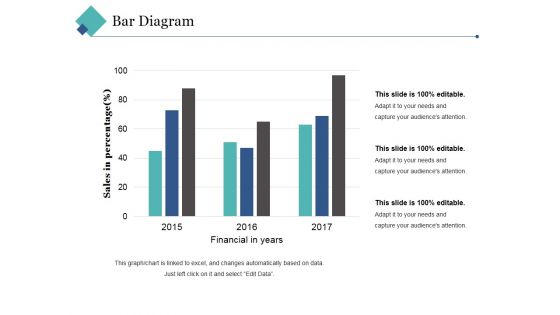
Bar Diagram Ppt PowerPoint Presentation Pictures Background Image
This is a bar diagram ppt powerpoint presentation pictures background image. This is a three stage process. The stages in this process are financial in years, sales in percentage, bar graph, growth, success.
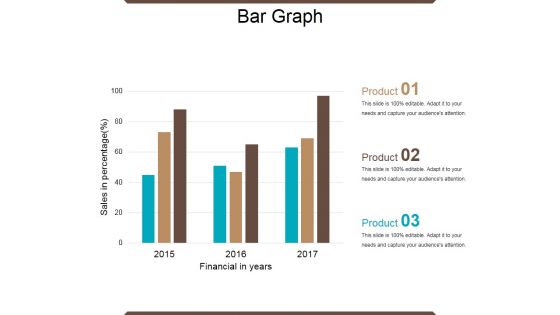
Bar Graph Ppt PowerPoint Presentation Ideas Graphic Tips
This is a bar graph ppt powerpoint presentation ideas graphic tips. This is a three stage process. The stages in this process are financial year, sales in percentage, product, bar graph, growth.
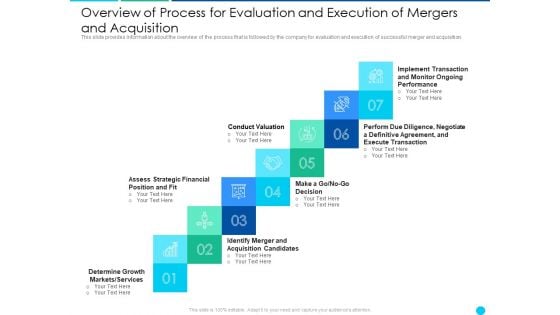
Overview Of Process For Evaluation And Execution Of Mergers And Acquisition Download PDF
Presenting overview of process for evaluation and execution of mergers and acquisition download pdf to provide visual cues and insights. Share and navigate important information on seven stages that need your due attention. This template can be used to pitch topics like conduct valuation, assess strategic financial position and fit, determine growth markets services. In addtion, this PPT design contains high resolution images, graphics, etc, that are easily editable and available for immediate download.
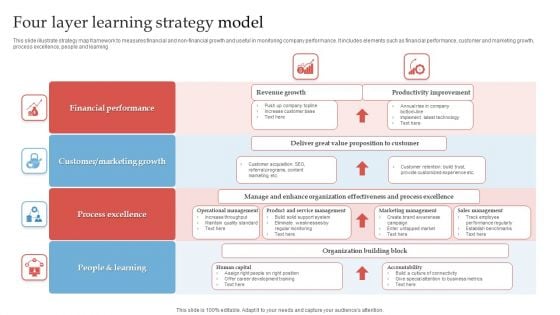
Four Layer Learning Strategy Model Ppt Show Slides PDF
This slide illustrate strategy map framework to measures financial and non-financial growth and useful in monitoring company performance. It includes elements such as financial performance, customer and marketing growth, process excellence, people and learning. Pitch your topic with ease and precision using this Four Layer Learning Strategy Model Ppt Show Slides PDF. This layout presents information on Revenue Growth, Productivity Improvement, Human Capital. It is also available for immediate download and adjustment. So, changes can be made in the color, design, graphics or any other component to create a unique layout.
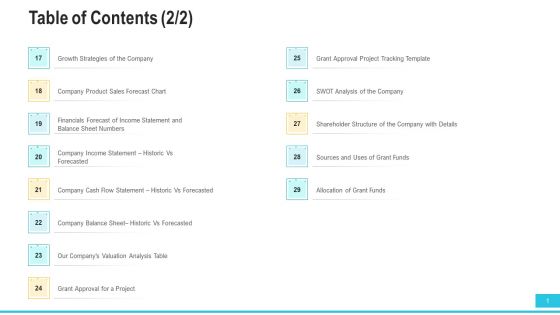
Funding Deck To Procure Funds From Public Enterprises Table Of Contents Income Sample PDF
Deliver an awe inspiring pitch with this creative funding deck to procure funds from public enterprises table of contents income sample pdf bundle. Topics like product sales, income, financials, analysis, growth strategies can be discussed with this completely editable template. It is available for immediate download depending on the needs and requirements of the user.
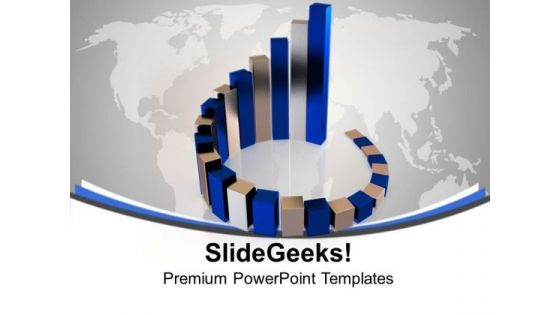
Blue And Gray Bars Business PowerPoint Templates And PowerPoint Themes 1012
This template with an image of bar graph showing success helps you chart the course of your presentation. Adjust the above image in your PPT presentations to visually support your content in your Business PPT slideshows financial reports, growth rates, global business etc. Deliver amazing presentations to mesmerize your audience. Get on the list of audience favourites. Experience adulation with our Blue And Gray Bars Business PowerPoint Templates And PowerPoint Themes 1012.
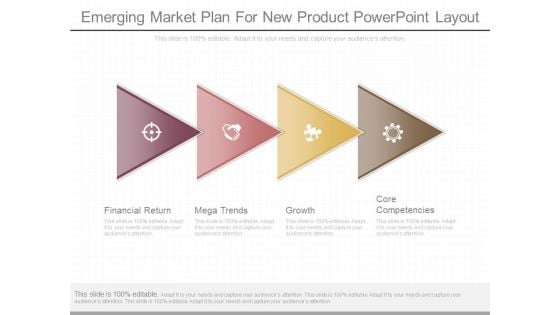
Emerging Market Plan For New Product Powerpoint Layout
This is a emerging market plan for new product powerpoint layout. This is a four stage process. The stages in this process are financial return, mega trends, growth, core competencies.

Business Strategy Scorecard Review Ppt Sample
This is a business strategy scorecard review ppt sample. This is a five stage process. The stages in this process are customer, internal business, vision and strategy, financial success, learning and growth.
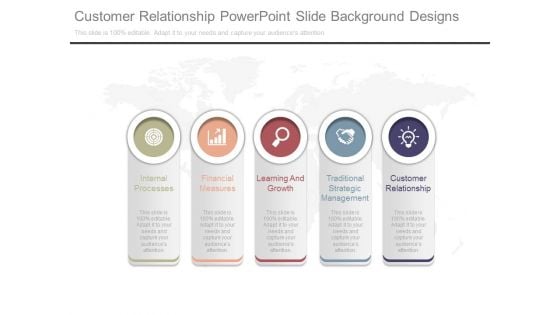
Customer Relationship Powerpoint Slide Background Designs
This is a customer relationship powerpoint slide background designs. This is a five stage process. The stages in this process are internal processes, financial measures, learning and growth, traditional strategic management, customer relationship.
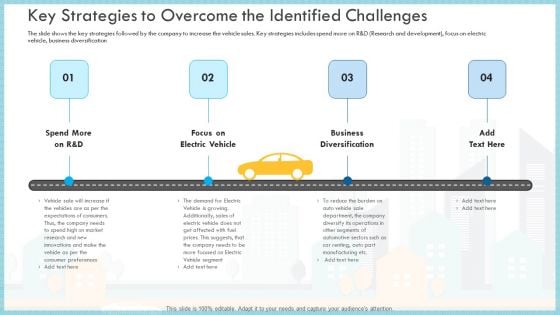
Loss Of Income And Financials Decline In An Automobile Organization Case Study Key Strategies To Overcome The Identified Challenges Rules PDF
The slide shows the key strategies followed by the company to increase the vehicle sales. Key strategies includes spend more on R and D Research and development, focus on electric vehicle, business diversification This is a loss of income and financials decline in an automobile organization case study key strategies to overcome the identified challenges rules pdf template with various stages. Focus and dispense information on four stages using this creative set, that comes with editable features. It contains large content boxes to add your information on topics like focus on electric vehicle, business diversification, spend more on r and d. You can also showcase facts, figures, and other relevant content using this PPT layout. Grab it now.
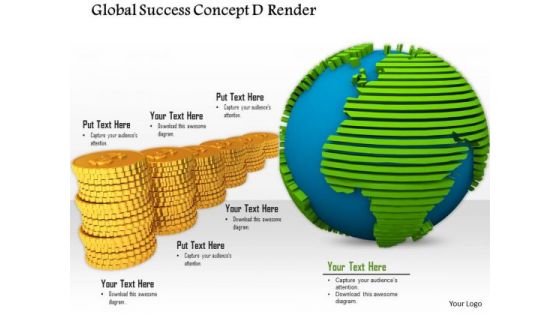
Stock Photo Globe With Gold Coins For Global Success PowerPoint Slide
This image slide displays globe with gold coins. This image slide depicts financial and economic growth and success. Use this image slide, in your presentation to express social and business views related to world. This image slide will enhance the quality of your presentations.
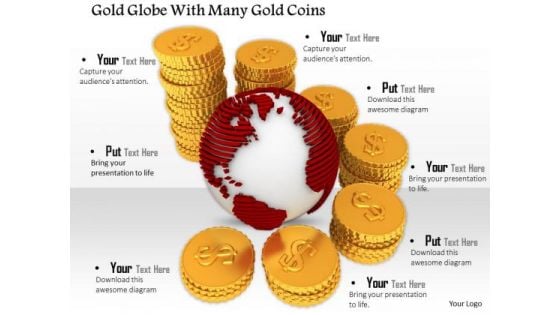
Stock Photo Globe With Red Textured Map Gold Coins PowerPoint Slide
This image slide displays red textured globe with gold coins. This image slide depicts financial and economic growth and success. Use this image slide, in your presentation to express social and business views related to world. This image slide will enhance the quality of your presentations.
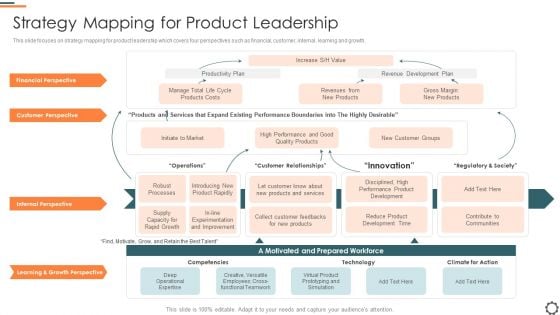
Agile Group For Product Development Strategy Mapping For Product Leadership Formats PDF
This slide focuses on strategy mapping for product leadership which covers four perspectives such as financial, customer, internal, learning and growth. Deliver an awe inspiring pitch with this creative agile group for product development strategy mapping for product leadership formats pdf bundle. Topics like financial perspective, customer perspective, learning and growth perspective can be discussed with this completely editable template. It is available for immediate download depending on the needs and requirements of the user.
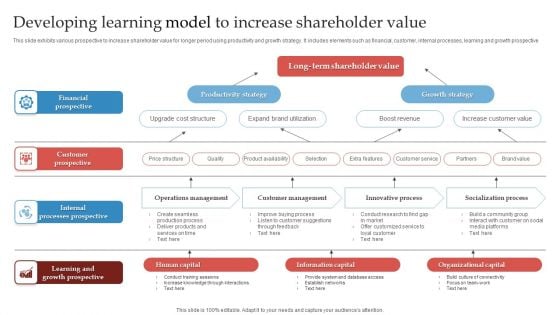
Developing Learning Model To Increase Shareholder Value Ppt Gallery Images PDF
This slide exhibits various prospective to increase shareholder value for longer period using productivity and growth strategy. It includes elements such as financial, customer, internal processes, learning and growth prospective. Showcasing this set of slides titled Developing Learning Model To Increase Shareholder Value Ppt Gallery Images PDF. The topics addressed in these templates are Productivity Strategy, Growth Strategy, Financial Prospective. All the content presented in this PPT design is completely editable. Download it and make adjustments in color, background, font etc. as per your unique business setting.
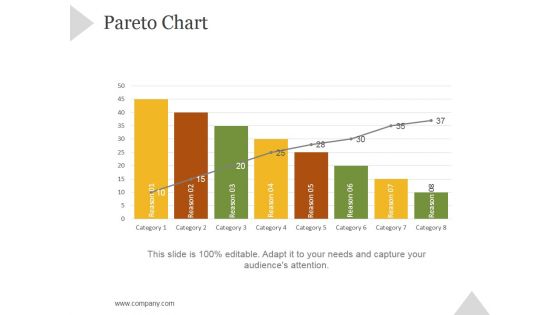
Pareto Chart Ppt PowerPoint Presentation Shapes
This is a pareto chart ppt powerpoint presentation shapes. This is a eight stage process. The stages in this process are business, strategy, marketing, success, growth strategy.
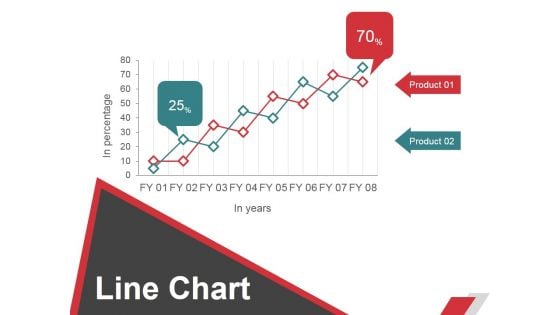
Line Chart Ppt PowerPoint Presentation File Graphic Images
This is a line chart ppt powerpoint presentation file graphic images. This is a two stage process. The stages in this process are business, strategy, marketing, planning, growth strategy, finance.

3d Arrows Over Dollar Bills Finance PowerPoint Templates And PowerPoint Themes 1012
3d Arrows Over Dollar Bills Finance PowerPoint Templates And PowerPoint Themes 1012-Use this template containing 3D arrows over multiple Dollar Bills to highlight the key issues of your presentation. This Template Portrays the concept of Financial Growth. This template can be used to express the issues related to Finance growth and employment of United States of America. Your quicksilver ideas are the arrows in your quiver. They are logical accurate and to the point. Use our appropriate template to get them across to your target audience.-3d Arrows Over Dollar Bills Finance PowerPoint Templates And PowerPoint Themes 1012-This PowerPoint template can be used for presentations relating to-Three 3d arrows over several, arrows, business, finance, money, success, signs Feast your eyes on our 3d Arrows Over Dollar Bills Finance PowerPoint Templates And PowerPoint Themes 1012. Get drawn in by their colorful display.

Colorful Puzzle Pieces PowerPoint Templates And PowerPoint Themes 1012
Colorful Puzzle Pieces PowerPoint Templates And PowerPoint Themes 1012-This is a High resolution 3d Business PowerPoint Template showing the Scattered pieces of Puzzles. This template represents the concept of business, dice, discount, earn, fall, finance, financial, growth, interest, investment, loss, luck, market, mathematical and money. Create captivating presentations to deliver comparative and weighted arguments.-Colorful Puzzle Pieces PowerPoint Templates And PowerPoint Themes 1012-This PowerPoint template can be used for presentations relating to-Colorful puzzle pieces, puzzles or jigsaws, teamwork, business, shapes, marketing Create an absorbing atmosphere with our Colorful Puzzle Pieces PowerPoint Templates And PowerPoint Themes 1012. Ensure your audience remains attentive.
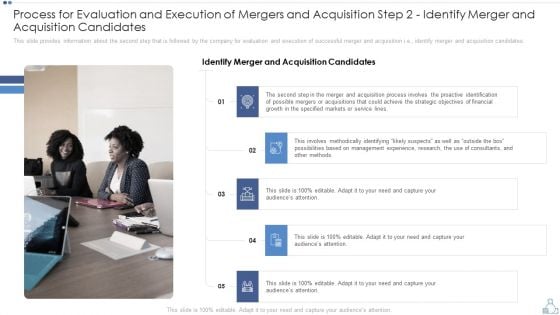
Process For Evaluation And Execution Of Mergers And Acquisition Step 2 Identify Merger And Acquisition Candidates Ideas PDF
This slide provides information about the second step that is followed by the company for evaluation and execution of successful merger and acquisition i.e., identify merger and acquisition candidates. This is a process for evaluation and execution of mergers and acquisition step 2 identify merger and acquisition candidates ideas pdf template with various stages. Focus and dispense information on five stages using this creative set, that comes with editable features. It contains large content boxes to add your information on topics like strategic, process, management, financial, growth, service. You can also showcase facts, figures, and other relevant content using this PPT layout. Grab it now.
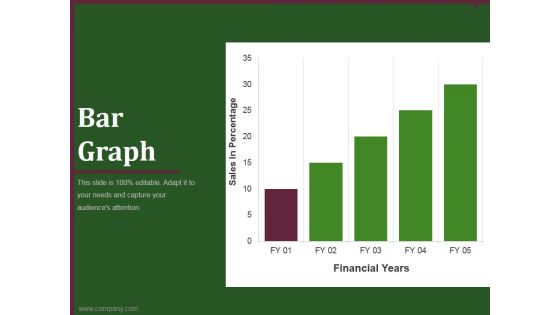
bar graph template 1 ppt powerpoint presentation infographics
This is a bar graph template 1 ppt powerpoint presentation infographics. This is a five stage process. The stages in this process are business, marketing, graph, analysis, growth.
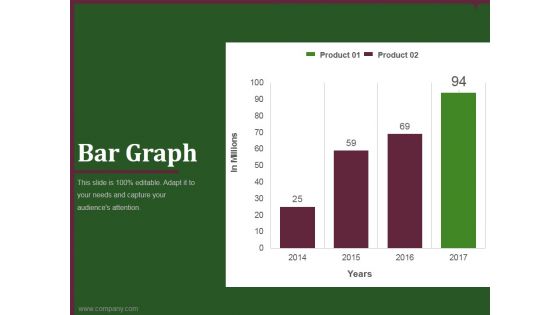
bar graph template 2 ppt powerpoint presentation gallery
This is a bar graph template 2 ppt powerpoint presentation gallery. This is a four stage process. The stages in this process are business, marketing, product, analysis, growth.
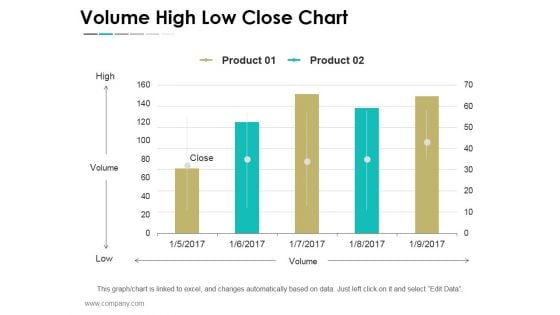
Volume High Low Close Chart Ppt PowerPoint Presentation Show Outfit
This is a volume high low close chart ppt powerpoint presentation show outfit. This is a five stage process. The stages in this process are business, strategy, marketing, success, finance, growth.
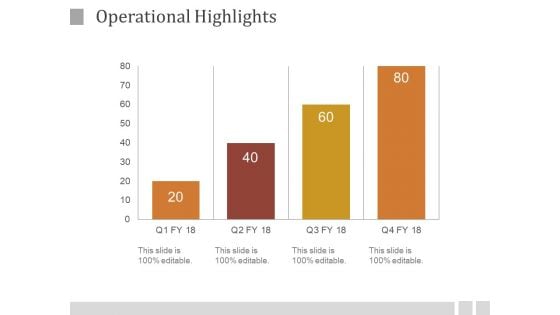
Operational Highlights Ppt PowerPoint Presentation Diagrams
This is a operational highlights ppt powerpoint presentation diagrams. This is a four stage process. The stages in this process are business, process, growth, analysis, strategy, success.
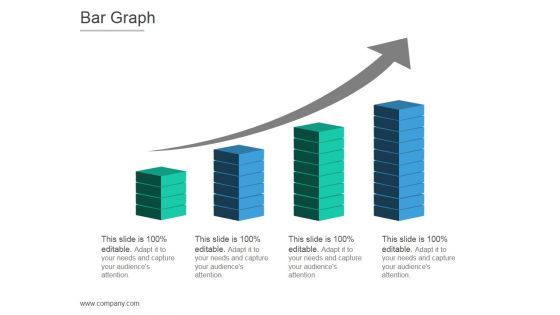
Bar Graph Ppt PowerPoint Presentation Templates
This is a bar graph ppt powerpoint presentation templates. This is a four stage process. The stages in this process are arrows, business, marketing, strategy, growth, graphic.
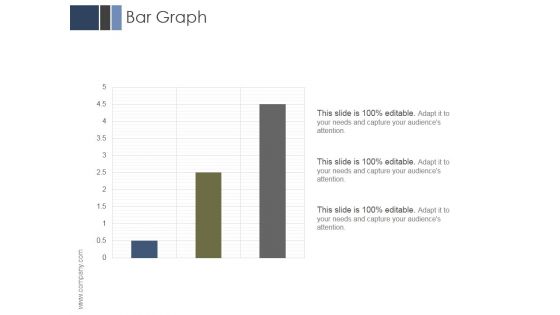
Bar Graph Ppt PowerPoint Presentation Layout
This is a bar graph ppt powerpoint presentation layout. This is a three stage process. The stages in this process are business, marketing, management, analysis, growth.
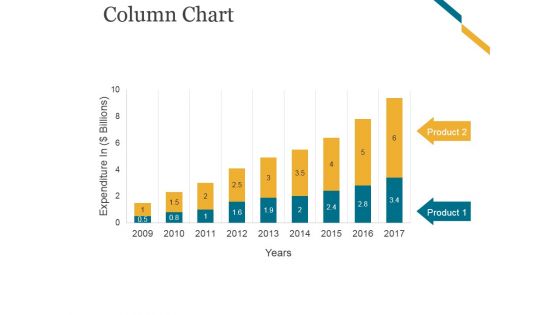
Column Chart Ppt PowerPoint Presentation Graphics
This is a column chart ppt powerpoint presentation graphics. This is a nine stage process. The stages in this process are business, marketing, growth, timeline, planning.
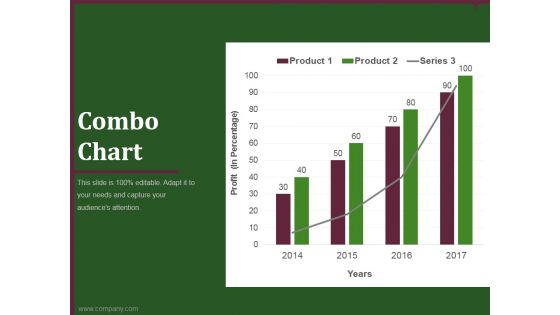
combo chart template 1 ppt powerpoint presentation show
This is a combo chart template 1 ppt powerpoint presentation show. This is a four stage process. The stages in this process are business, marketing, finance, analysis, growth.
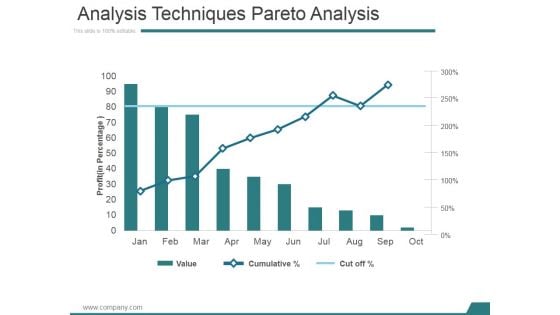
Analysis Techniques Pareto Analysis Ppt PowerPoint Presentation Designs
This is a analysis techniques pareto analysis ppt powerpoint presentation designs. This is a ten stage process. The stages in this process are business, marketing, growth, finance, techniques.
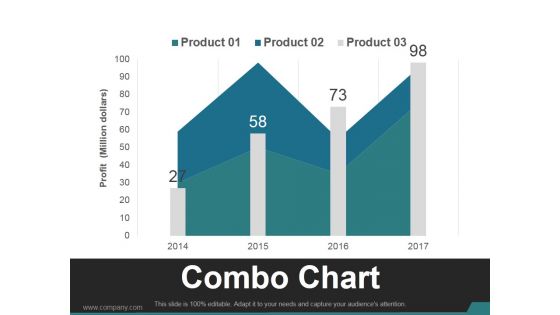
Combo Chart Template 2 Ppt PowerPoint Presentation Guidelines
This is a combo chart template 2 ppt powerpoint presentation guidelines. This is a four stage process. The stages in this process are business, marketing, growth, product, timeline.
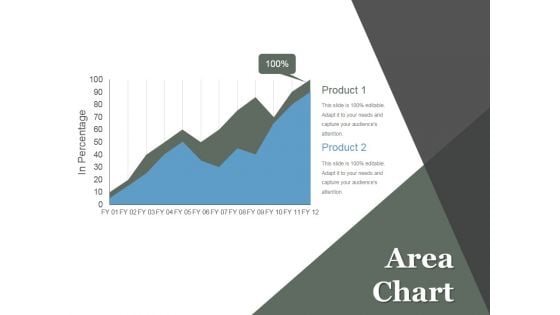
Area Chart Ppt PowerPoint Presentation Example File
This is a area chart ppt powerpoint presentation example file. This is a two stage process. The stages in this process are business, marketing, growth, planning, management.
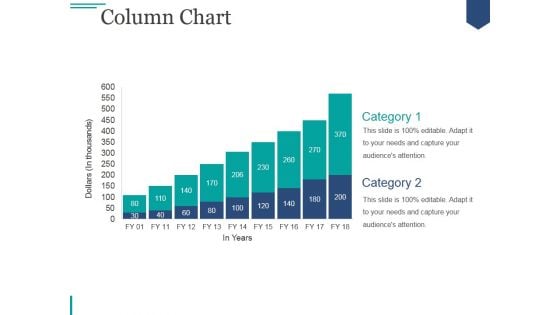
Column Chart Ppt PowerPoint Presentation Visuals
This is a column chart ppt powerpoint presentation visuals. This is a two stage process. The stages in this process are business, marketing, growth, strategy, planning.
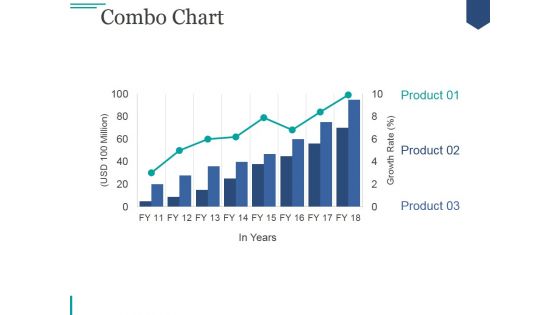
Combo Chart Ppt PowerPoint Presentation Microsoft
This is a combo chart ppt powerpoint presentation microsoft. This is a three stage process. The stages in this process are business, marketing, growth, product, chart.
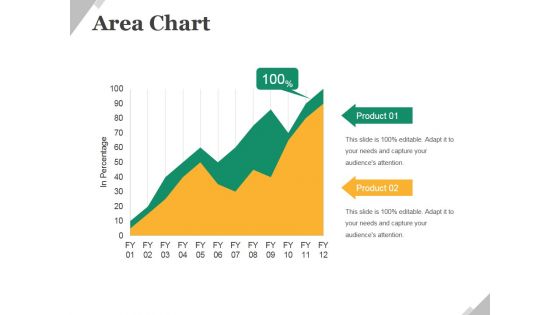
Area Chart Ppt PowerPoint Presentation Show Portfolio
This is a area chart ppt powerpoint presentation show portfolio. This is a two stage process. The stages in this process are business, product, finance, growth, management.
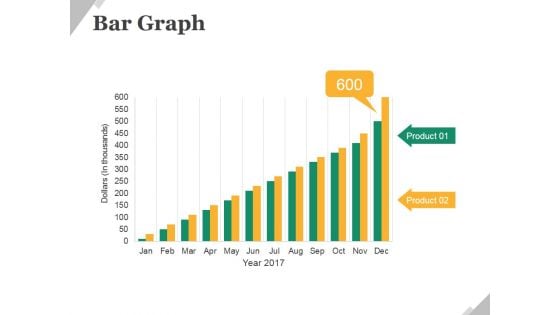
Bar Graph Ppt PowerPoint Presentation Model Layouts
This is a bar graph ppt powerpoint presentation model layouts. This is a two stage process. The stages in this process are business, product, bar graph, growth, management.
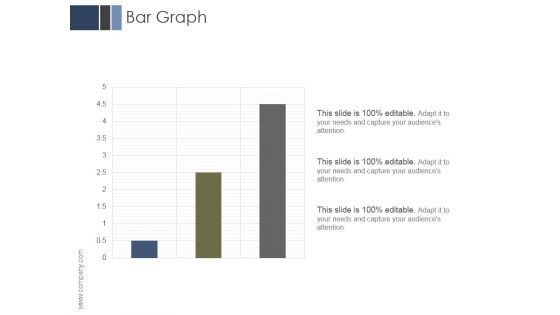
Bar Graph Ppt PowerPoint Presentation Outline Slides
This is a bar graph ppt powerpoint presentation outline slides. This is a three stage process. The stages in this process are business, marketing, management, analysis, growth.
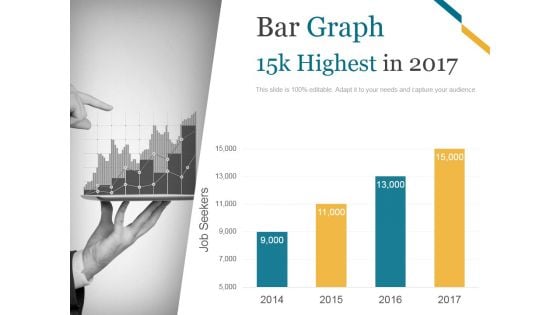
Bar Graph Ppt PowerPoint Presentation Outline Slide Download
This is a bar graph ppt powerpoint presentation outline slide download. This is a four stage process. The stages in this process are business, marketing, finance, timeline, growth.
Combo Chart Ppt PowerPoint Presentation Icon Format Ideas
This is a combo chart ppt powerpoint presentation icon format ideas. This is a three stage process. The stages in this process are bar, marketing, strategy, planning, growth.
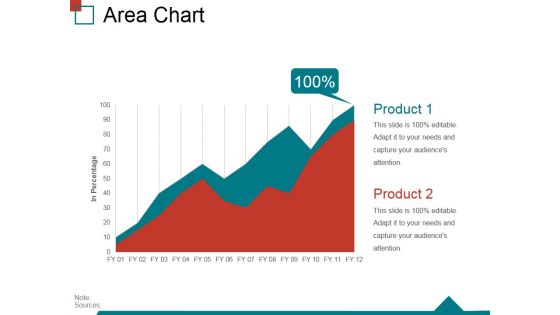
Area Chart Ppt PowerPoint Presentation Inspiration Display
This is a area chart ppt powerpoint presentation inspiration display. This is a two stage process. The stages in this process are area chart, finance, growth, success, strategy, business.
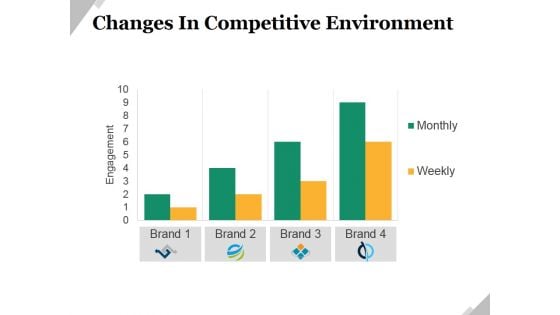
Changes In Competitive Environment Template 1 Ppt PowerPoint Presentation Infographic Template Slide Portrait
This is a changes in competitive environment template 1 ppt powerpoint presentation infographic template slide portrait. This is a four stage process. The stages in this process are competitive, business, marketing, engagement, growth.
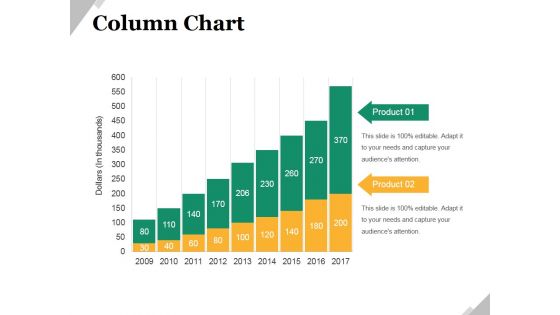
Column Chart Ppt PowerPoint Presentation Infographic Template Graphic Images
This is a column chart ppt powerpoint presentation infographic template graphic images. This is a nine stage process. The stages in this process are business, marketing, growth, product, management.
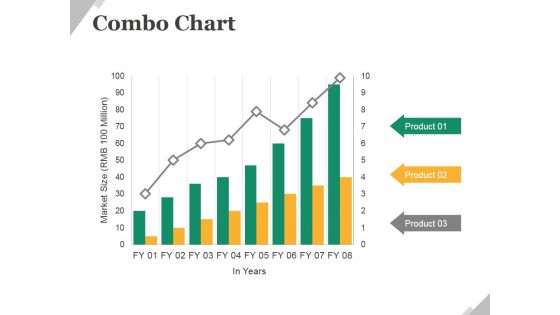
Combo Chart Ppt PowerPoint Presentation Infographics Example Topics
This is a combo chart ppt powerpoint presentation infographics example topics. This is a eight stage process. The stages in this process are business, marketing, growth, combo chart, management.
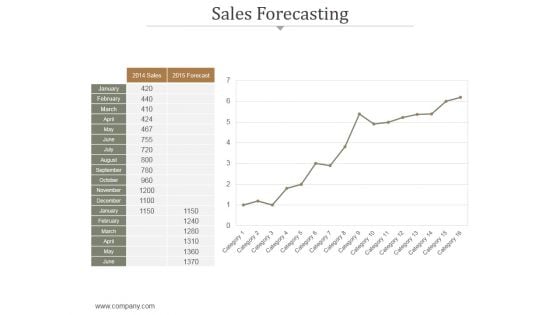
Sales Forecasting Ppt PowerPoint Presentation Example File
This is a sales forecasting ppt powerpoint presentation example file. This is a one stage process. The stages in this process are business, marketing, strategy, management, success, analysis.

Change Curve Ppt PowerPoint Presentation Background Designs
This is a change curve ppt powerpoint presentation background designs. This is a five stage process. The stages in this process are satisfaction, denial, exploration, hope, commitment.
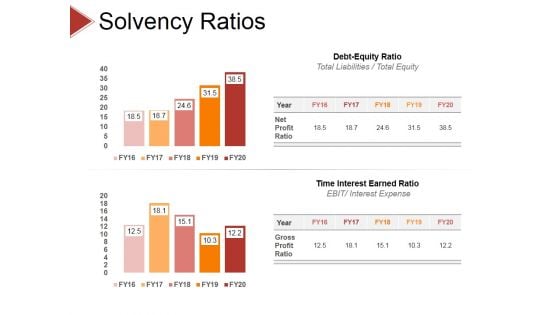
Solvency Ratios Ppt PowerPoint Presentation Model Show
This is a solvency ratios ppt powerpoint presentation model show. This is a two stage process. The stages in this process are debt equity ratio, time interest earned ratio.


 Continue with Email

 Home
Home


