Financial Growth
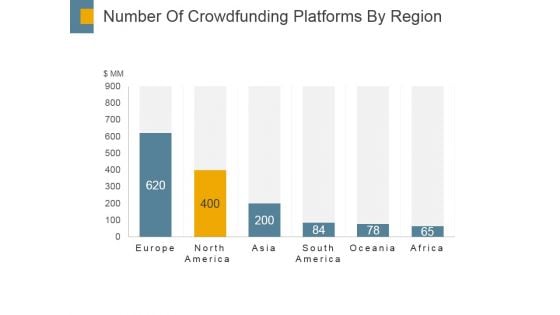
Number Of Crowdfunding Platforms By Region Ppt PowerPoint Presentation Ideas Format Ideas
This is a number of crowdfunding platforms by region ppt powerpoint presentation ideas format ideas. This is a six stage process. The stages in this process are finance, success, strategy, business, marketing.
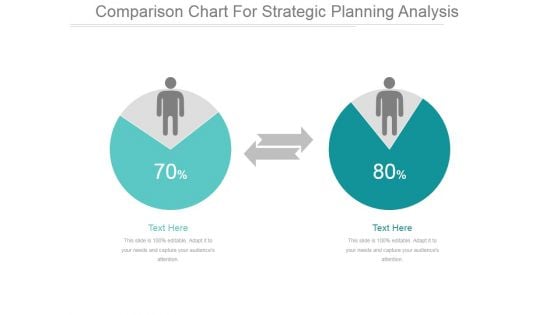
Comparison Chart For Strategic Planning Analysis Ppt PowerPoint Presentation Example
This is a comparison chart for strategic planning analysis ppt powerpoint presentation example. This is a two stage process. The stages in this process are business, finance, marketing, strategy, success.
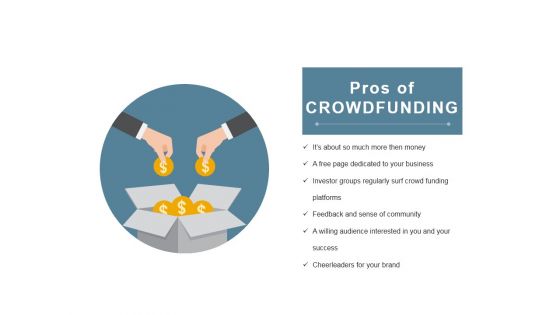
Pros Of Crowdfunding Ppt PowerPoint Presentation Infographic Template Inspiration
This is a pros of crowdfunding ppt powerpoint presentation infographic template inspiration. This is a two stage process. The stages in this process are pros of crowdfunding, business, marketing, strategy, success.
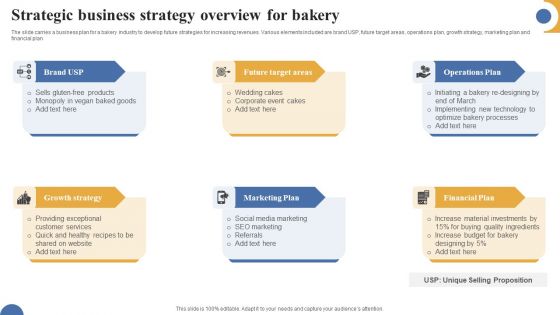
Strategic Business Strategy Overview For Bakery Structure PDF
The slide carries a business plan for a bakery industry to develop future strategies for increasing revenues. Various elements included are brand USP, future target areas, operations plan, growth strategy, marketing plan and financial plan Persuade your audience using this Strategic Business Strategy Overview For Bakery Structure PDF. This PPT design covers six stages, thus making it a great tool to use. It also caters to a variety of topics including Growth Strategy, Marketing Plan, Future Target Areas. Download this PPT design now to present a convincing pitch that not only emphasizes the topic but also showcases your presentation skills.
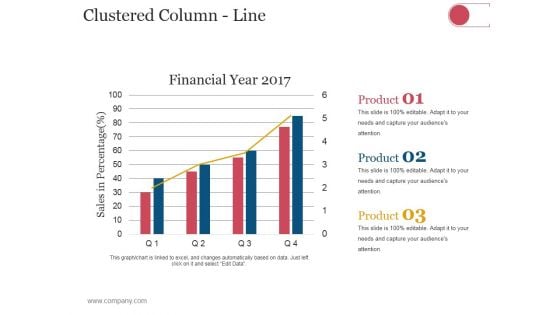
Clustered Column Line Ppt PowerPoint Presentation Infographic Template Deck
This is a clustered column line ppt powerpoint presentation infographic template deck. This is a three stage process. The stages in this process are business, strategy, analysis, planning, sales in percentage, financial year.
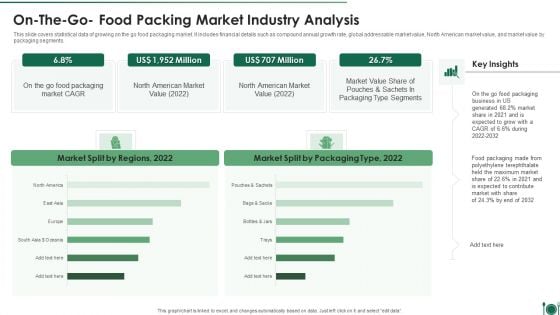
On The Go Food Packing Market Industry Analysis Designs PDF
This slide covers statistical data of growing on the go food packaging market. It includes financial details such as compound annual growth rate, global addressable market value, North American market value, and market value by packaging segments.Showcasing this set of slides titled On The Go Food Packing Market Industry Analysis Designs PDF. The topics addressed in these templates are On The Go Food Packing Market Industry Analysis. All the content presented in this PPT design is completely editable. Download it and make adjustments in color, background, font etc. as per your unique business setting.
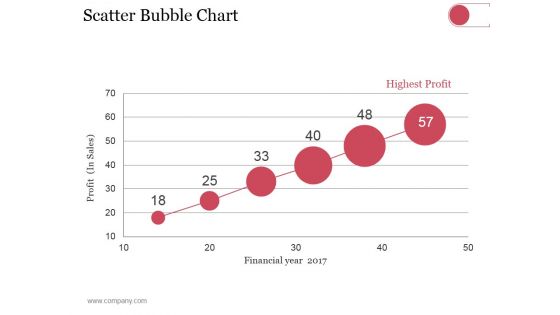
Scatter Bubble Chart Ppt PowerPoint Presentation Summary Pictures
This is a scatter bubble chart ppt powerpoint presentation summary pictures. This is a six stage process. The stages in this process are highest profit, financial year, profit in sales.
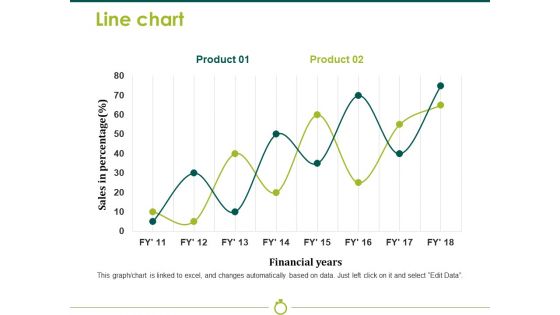
Line Chart Template 2 Ppt PowerPoint Presentation Model Background Image
This is a line chart template 2 ppt powerpoint presentation model background image. This is a two stage process. The stages in this process are sales in percentage, financial years, business, marketing, strategy, graph.
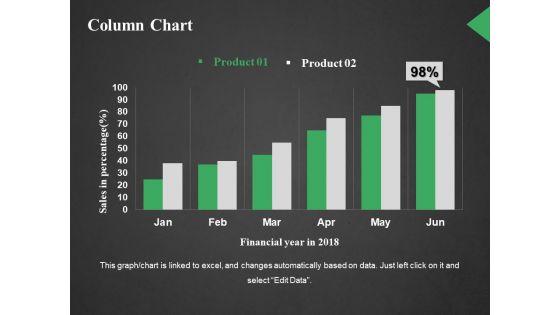
Column Chart Ppt PowerPoint Presentation Outline Styles
This is a column chart ppt powerpoint presentation outline styles. This is a two stage process. The stages in this process are sales in percentage, financial year in, business, marketing, graph.
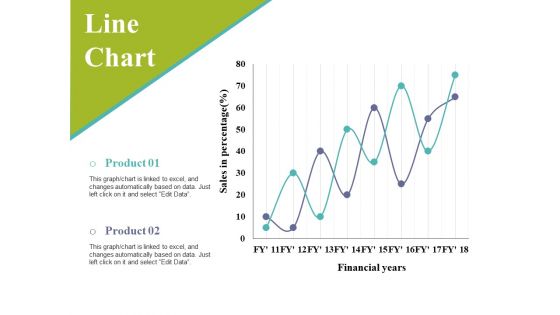
Line Chart Ppt PowerPoint Presentation Infographic Template Slides
This is a line chart ppt powerpoint presentation infographic template slides. This is a two stage process. The stages in this process are sales in percentage, financial years, business, marketing, graph.
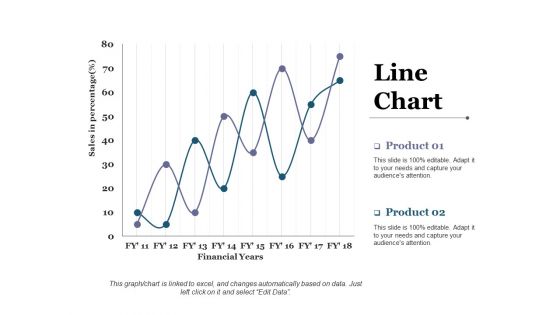
Line Chart Ppt PowerPoint Presentation Styles Themes
This is a line chart ppt powerpoint presentation styles themes. This is a two stage process. The stages in this process are business, marketing, financial years, sales in percentage.
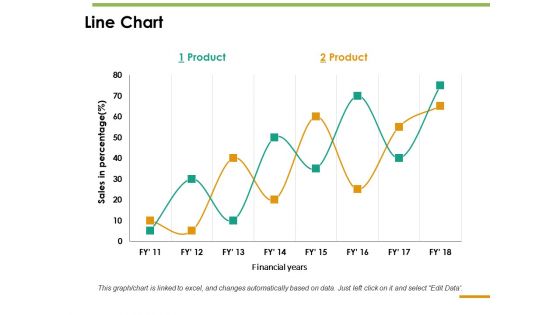
Line Chart Ppt PowerPoint Presentation Inspiration Guide
This is a line chart ppt powerpoint presentation inspiration guide. This is a two stage process. The stages in this process are line chart, sales in percentage, product, financial years.
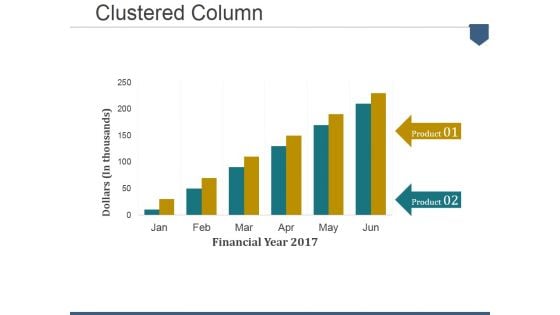
Clustered Column Ppt PowerPoint Presentation File Designs Download
This is a clustered column ppt powerpoint presentation file designs download. This is a six stage process. The stages in this process are dollars in thousands, financial year, product.
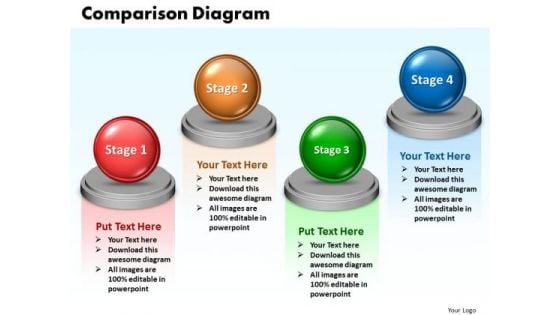
Ppt Comparison Network Diagram PowerPoint Template 4 Phase Templates
PPT comparison network diagram powerpoint template 4 phase Templates-This PowerPoint diagram slide shows four opposing views. You can use the This PowerPoint diagram slide to represent views from different functions on an issue.-PPT comparison network diagram powerpoint template 4 phase Templates-Abstract, Achievement, Business, Chart, Comparison, Concepts, Data, Descriptive, Design, Development, Diagram, Element, Figure, Finance, Financial, Graph, Graphic, Growth, Icon, Ideas, Improvement, Investment, Market, Money, Progress, Raise, Real, Report, Revenue, Sale, Shape, Sign, Silhouette, Stock, Success, Symbol, Technology Reveal the depth of your knowledge. Showcase your erudition on our Ppt Comparison Network Diagram PowerPoint Template 4 Phase Templates.
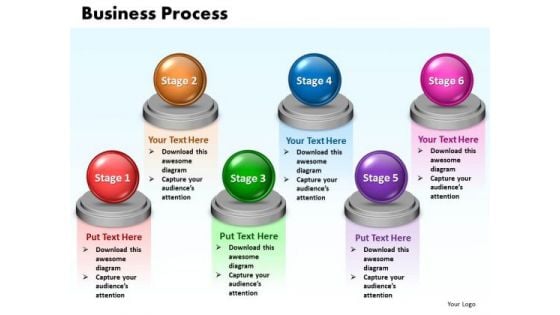
Ppt Steps Of Business Process 6 Stages Presentation PowerPoint Tips 0812 Templates
PPT steps of business process 6 stages presentation powerpoint tips 0812 Templates-Clear thinking is your strength; transmit your thoughts to your eager team. Deliver amazing presentations to mesmerize your audience.-PPT steps of business process 6 stages presentation powerpoint tips 0812 Templates-achievement, aspirations, blank, blue, business, chart, competition, consultant, control, copy, diagram, drawing, expertise, finance, financial, future, graph, growth, hand, improvement, increase, investment, isolated, leadership, line, manager, market, progress, selling, shares, space, stock, success Get endorsed by your boss with our Ppt Steps Of Business Process 6 Stages Presentation PowerPoint Tips 0812 Templates. Dont pass up this opportunity to shine.
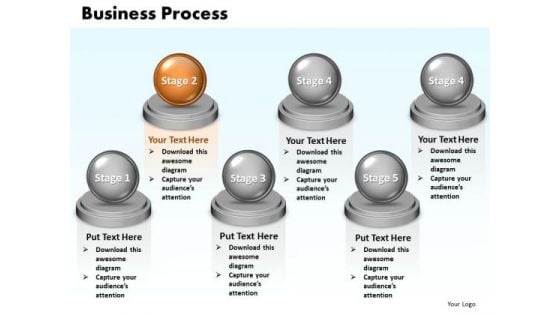
Ppt Steps Of Marketing Process 6 Stages Presentation PowerPoint Templates 0812
PPT steps of marketing process 6 stages presentation powerpoint templates 0812-This image has been professionally designed to emphasize on Marketing Process. Marketing process is a key strategy of many organizations. Transmit your thoughts via this slide and prod your team to action. -PPT steps of marketing process 6 stages presentation powerpoint templates 0812-achievement, aspirations, blank, blue, business, chart, competition, consultant, control, copy, diagram, drawing, expertise, finance, financial, future, graph, growth, hand, improvement, increase, investment, isolated, leadership, line, manager, market, progress, selling, shares, space, stock, success Allay any fears that may crop up. Apply the balm with our Ppt Steps Of Marketing Process 6 Stages Presentation PowerPoint Templates 0812.
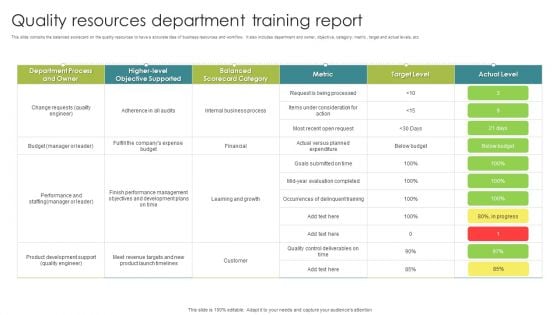
Quality Resources Department Training Report Ppt Summary Graphics PDF
This slide contains the balanced scorecard on the quality resources to have a accurate idea of business resources and workflow. It also includes department and owner, objective, category, metric , target and actual levels, etc. Showcasing this set of slides titled Quality Resources Department Training Report Ppt Summary Graphics PDF. The topics addressed in these templates are Internal Business Process, Financial, Learning And Growth. All the content presented in this PPT design is completely editable. Download it and make adjustments in color, background, font etc. as per your unique business setting.
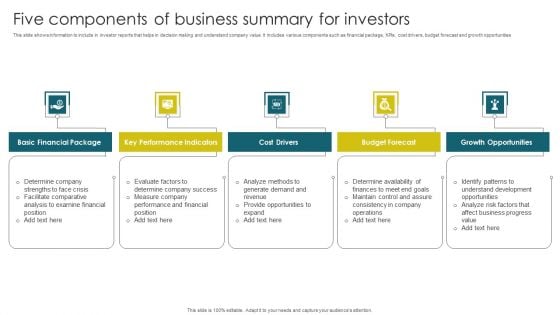
Five Components Of Business Summary For Investors Summary PDF
This slide shows information to include in investor reports that helps in decision making and understand company value. It includes various components such as financial package, KPIs, cost drivers, budget forecast and growth opportunities.Presenting Five Components Of Business Summary For Investors Summary PDF to dispense important information. This template comprises five stages. It also presents valuable insights into the topics including Financial Package, Performance Indicators, Budget Forecast. This is a completely customizable PowerPoint theme that can be put to use immediately. So, download it and address the topic impactfully.
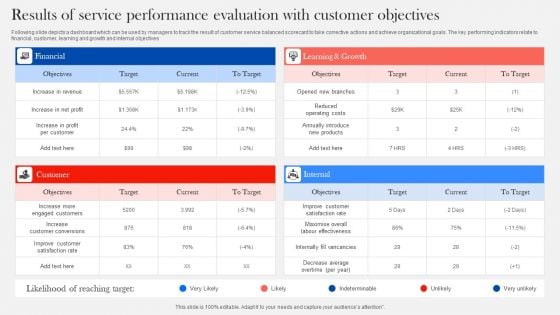
Results Of Service Performance Evaluation With Customer Objectives Diagrams PDF
Following slide depicts a dashboard which can be used by managers to track the result of customer service balanced scorecard to take corrective actions and achieve organizational goals. The key performing indicators relate to financial, customer, learning and growth and internal objectives. Showcasing this set of slides titled Results Of Service Performance Evaluation With Customer Objectives Diagrams PDF. The topics addressed in these templates are Financial, Customer, Internal. All the content presented in this PPT design is completely editable. Download it and make adjustments in color, background, font etc. as per your unique business setting.
Balanced Scorecard Implementation Ppt PowerPoint Presentation Icon Slide Download PDF
Presenting this set of slides with name balanced scorecard implementation ppt powerpoint presentation icon slide download pdf. This is a eight stage process. The stages in this process are specify goals, financial perspective, business strategy, customer perspective, internal perspective, learning and growth perspective, internal perspective, review target achievement. This is a completely editable PowerPoint presentation and is available for immediate download. Download now and impress your audience.
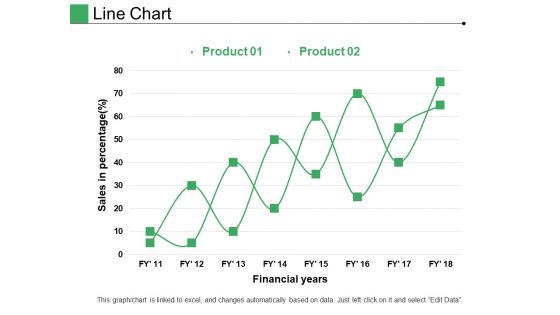
Line Chart Ppt PowerPoint Presentation Pictures Layout
This is a line chart ppt powerpoint presentation pictures layout. This is a two stage process. The stages in this process are product, financial years, sales in percentage.
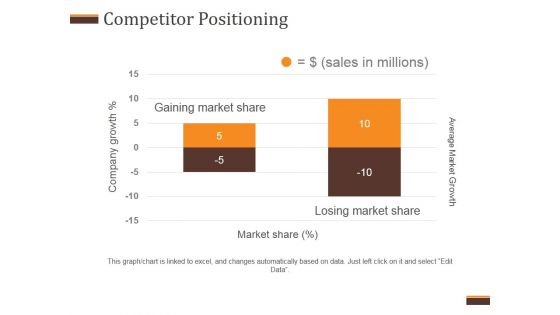
Competitor Positioning Ppt PowerPoint Presentation Summary
This is a competitor positioning ppt powerpoint presentation summary. This is a two stage process. The stages in this process are average market growth, gaining market share, losing market share, company growth.
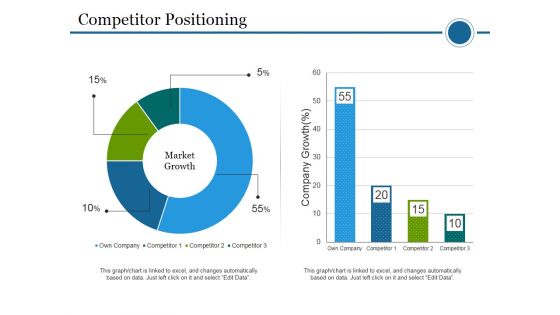
Competitor Positioning Ppt PowerPoint Presentation Infographics Gridlines
This is a competitor positioning ppt powerpoint presentation infographics gridlines. This is a two stage process. The stages in this process are competitor positioning, company, growth, market growth, business, marketing.
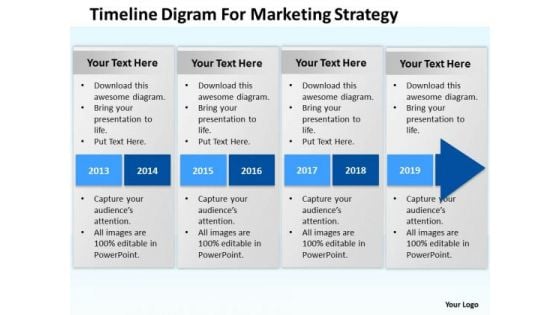
Timeline Digram For Marketing Strategy Ppt Develop Business Plan PowerPoint Slides
We present our timeline digram for marketing strategy ppt develop business plan PowerPoint Slides.Download and present our Advertising PowerPoint Templates because Our PowerPoint Templates and Slides offer you the needful to organise your thoughts. Use them to list out your views in a logical sequence. Download and present our Competition PowerPoint Templates because You are well armed with penetrative ideas. Our PowerPoint Templates and Slides will provide the gunpowder you need. Use our Arrows PowerPoint Templates because It can Leverage your style with our PowerPoint Templates and Slides. Charm your audience with your ability. Download our Process and Flows PowerPoint Templates because You should Ascend the ladder of success with ease. Our PowerPoint Templates and Slides will provide strong and sturdy steps. Download our Business PowerPoint Templates because It will let you Set new benchmarks with our PowerPoint Templates and Slides. They will keep your prospects well above par.Use these PowerPoint slides for presentations relating to Account, acquisition, advance, advantage, background, banking, bar, business, chart, data, diagram, earning, economic, economy, finance, financial, graph, graphic, green, grow, growth, illustration, increase, investment, line, market, marketing, money, number, orange, plan, price, profit, progress, rainbow, red, report, rise, sign, spectrum, statistic, stock, success, symbol, up. The prominent colors used in the PowerPoint template are Blue, Gray, Black. With our Timeline Digram For Marketing Strategy Ppt Develop Business Plan PowerPoint Slides there is no need to exaggerate. They are always brief and accurate.
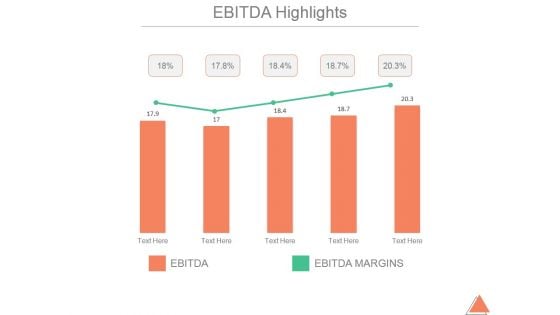
Ebitda Highlights Ppt PowerPoint Presentation Graphics
This is a ebitda highlights ppt powerpoint presentation graphics. This is a five stage process. The stages in this process are business, marketing, finance, management, growth.
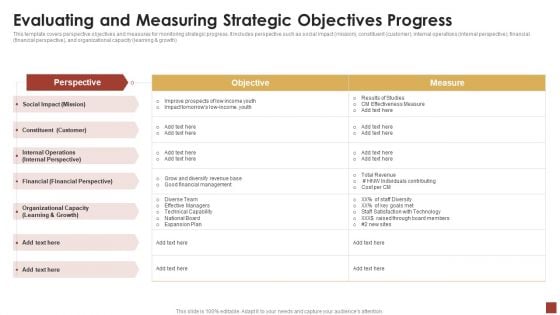
Strategical And Tactical Planning Evaluating And Measuring Strategic Objectives Progress Infographics PDF
This template covers perspective objectives and measures for monitoring strategic progress. It includes perspective such as social impact mission, constituent customer, internal operations internal perspective, financial financial perspective, and organizational capacity learning and growth. Deliver and pitch your topic in the best possible manner with this Strategical And Tactical Planning Evaluating And Measuring Strategic Objectives Progress Infographics PDF. Use them to share invaluable insights on Social Impact Mission, Constituent Customer, Financial Perspective and impress your audience. This template can be altered and modified as per your expectations. So, grab it now.
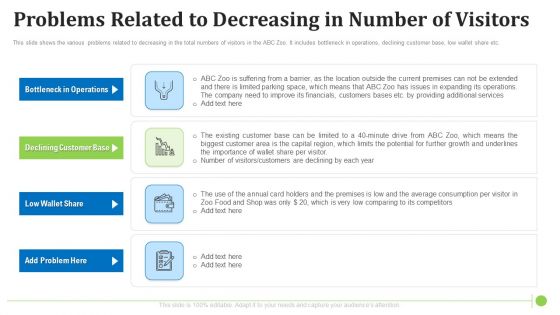
Problems Related To Decreasing In Number Of Visitors Graphics PDF
This slide shows the various problems related to decreasing in the total numbers of visitors in the ABC Zoo. It includes bottleneck in operations, declining customer base, low wallet share etc. Presenting problems related to decreasing in number of visitors graphics pdf to provide visual cues and insights. Share and navigate important information on four stages that need your due attention. This template can be used to pitch topics like customer, growth, financials, services, average. In addtion, this PPT design contains high resolution images, graphics, etc, that are easily editable and available for immediate download.
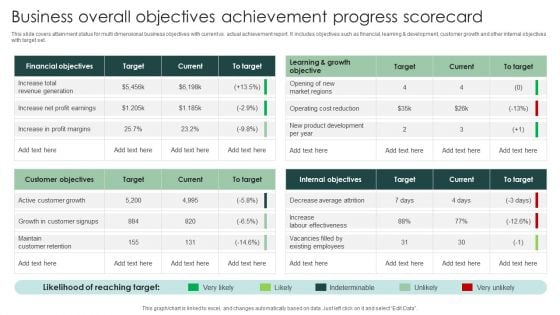
Business Overall Objectives Achievement Progress Scorecard Pictures PDF
This slide covers attainment status for multi dimensional business objectives with current vs. actual achievement report. It includes objectives such as financial, learning development, customer growth and other internal objectives with target set.Showcasing this set of slides titled Business Overall Objectives Achievement Progress Scorecard Pictures PDF. The topics addressed in these templates are Revenue Generation, Customer Retention, Existing Employees. All the content presented in this PPT design is completely editable. Download it and make adjustments in color, background, font etc. as per your unique business setting.
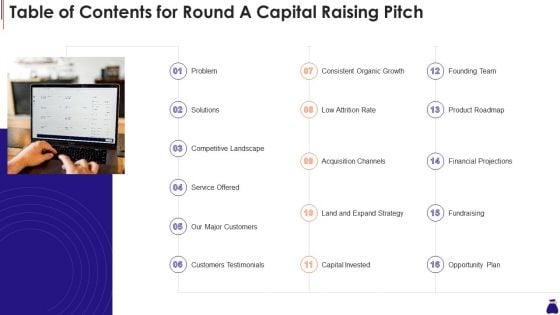
Table Of Contents For Round A Capital Raising Pitch Ppt Portfolio Styles PDF
This is a table of contents for round a capital raising pitch ppt portfolio styles pdf template with various stages. Focus and dispense information on one stages using this creative set, that comes with editable features. It contains large content boxes to add your information on topics like consistent organic growth, founding team, product roadmap, financial projections, opportunity plan. You can also showcase facts, figures, and other relevant content using this PPT layout. Grab it now.
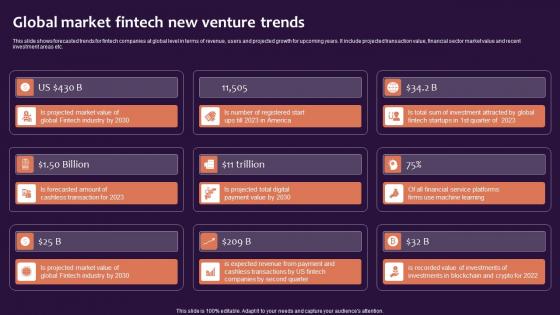
Global Market Fintech New Venture Trends Slides Pdf
This slide shows forecasted trends for fintech companies at global level in terms of revenue, users and projected growth for upcoming years. It include projected transaction value, financial sector market value and recent investment areas etc. Showcasing this set of slides titled Global Market Fintech New Venture Trends Slides Pdf. The topics addressed in these templates are Fintech, America, Investment. All the content presented in this PPT design is completely editable. Download it and make adjustments in color, background, font etc. as per your unique business setting. This slide shows forecasted trends for fintech companies at global level in terms of revenue, users and projected growth for upcoming years. It include projected transaction value, financial sector market value and recent investment areas etc.
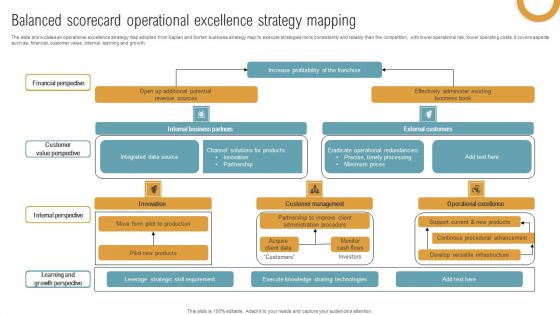
Balanced Scorecard Operational Excellence Strategy Mapping Information PDF
The slide showcases an operational excellence strategy map adopted from Kaplan and Norten business strategy map to execute strategies more consistently and reliably than the competition, with lower operational risk, lower operating costs. It covers aspects such as financial, customer value, internal, learning and growth. Showcasing this set of slides titled Balanced Scorecard Operational Excellence Strategy Mapping Information PDF. The topics addressed in these templates are Internal Perspective, Customer Value Perspective, Financial Perspective. All the content presented in this PPT design is completely editable. Download it and make adjustments in color, background, font etc. as per your unique business setting.
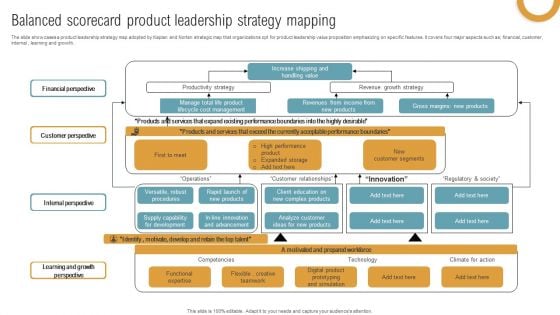
Balanced Scorecard Product Leadership Strategy Mapping Inspiration PDF
The slide showcases a product leadership strategy map adopted by Kaplan and Norten strategic map that organizations opt for product leadership value proposition emphasizing on specific features. It covers four major aspects such as financial, customer, internal , learning and growth. Pitch your topic with ease and precision using this Balanced Scorecard Product Leadership Strategy Mapping Inspiration PDF. This layout presents information on Customer Perspective, Financial Perspective, Internal Perspective. It is also available for immediate download and adjustment. So, changes can be made in the color, design, graphics or any other component to create a unique layout.
Equity Crowd Investing Agenda For Equity Crowd Investing Ppt Icon Background Image PDF
This is a equity crowd investing agenda for equity crowd investing ppt icon background image pdf template with various stages. Focus and dispense information on four stages using this creative set, that comes with editable features. It contains large content boxes to add your information on topics like agenda equity crowd investing, persuade potential investors, business growth expansion, products services financial, performance shareholding pattern valuation. You can also showcase facts, figures, and other relevant content using this PPT layout. Grab it now.
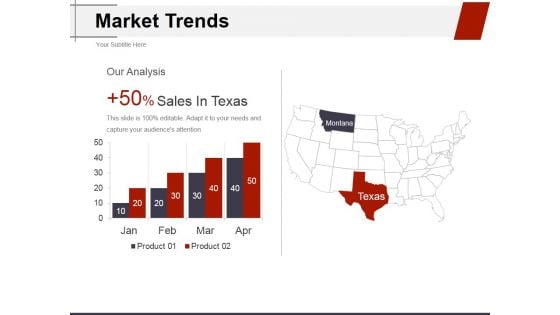
Market Trends Ppt PowerPoint Presentation Model Background Images
This is a market trends ppt powerpoint presentation model background images. This is a two stage process. The stages in this process are our analysis, montana, texas, sales in texas.
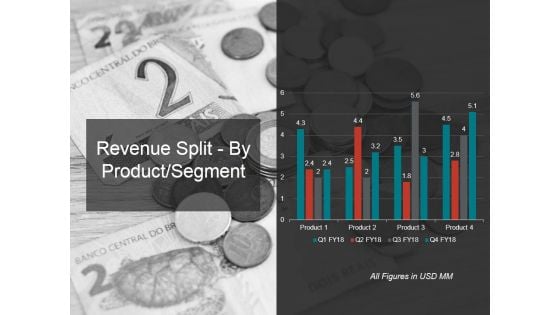
Revenue Split By Product Segment Template 1 Ppt PowerPoint Presentation Infographics Example
This is a revenue split by product segment template 1 ppt powerpoint presentation infographics example. This is a four stage process. The stages in this process are revenue, segment, business, marketing, success.
Market Segmentation Evaluation Ppt PowerPoint Presentation Icon Pictures
This is a market segmentation evaluation ppt powerpoint presentation icon pictures. This is a two stage process. The stages in this process are net profit, in usd millions, market sales, business, marketing.
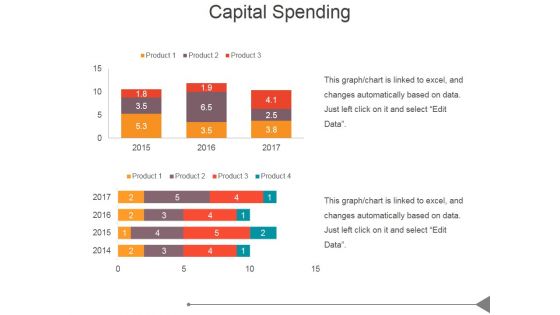
Capital Spending Ppt PowerPoint Presentation Graphics
This is a capital spending ppt powerpoint presentation graphics. This is a two stage process. The stages in this process are business, marketing, success, bar graph, management.
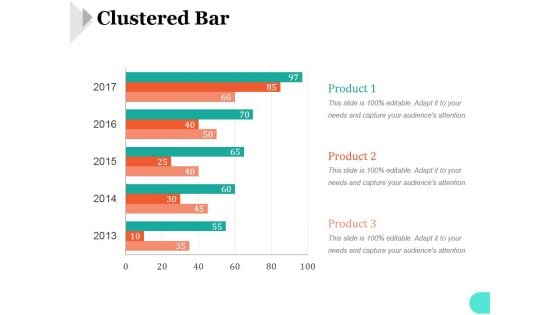
Clustered Bar Ppt PowerPoint Presentation Ideas
This is a clustered bar ppt powerpoint presentation ideas. This is a five stage process. The stages in this process are bar graph, marketing, strategy, analysis, business, success.
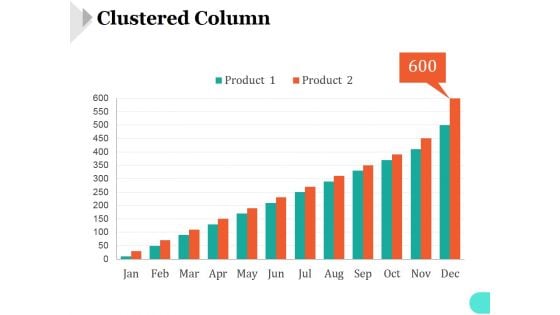
Clustered Column Template 1 Ppt PowerPoint Presentation Inspiration
This is a clustered column template 1 ppt powerpoint presentation inspiration. This is a twelve stage process. The stages in this process are bar graph, marketing, strategy, analysis, business, success.
Clustered Column Template 2 Ppt PowerPoint Presentation Icon
This is a clustered column template 2 ppt powerpoint presentation icon. This is a two stage process. The stages in this process are bar graph, marketing, strategy, analysis, business, success.
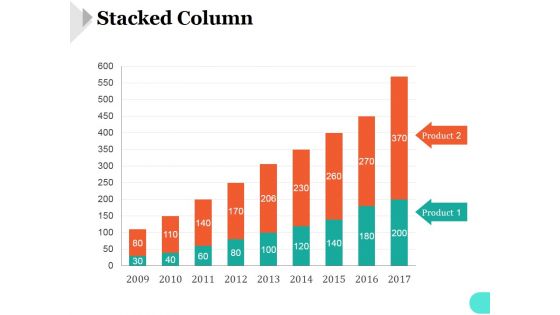
Stacked Column Ppt PowerPoint Presentation Files
This is a stacked column ppt powerpoint presentation files. This is a nine stage process. The stages in this process are bar graph, finance, marketing, analysis, business.
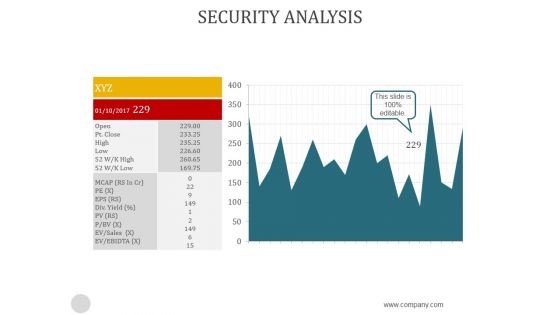
Security Analysis Ppt PowerPoint Presentation Background Image
This is a security analysis ppt powerpoint presentation background image. This is a two stage process. The stages in this process are business, analysis, strategic, finance, management.
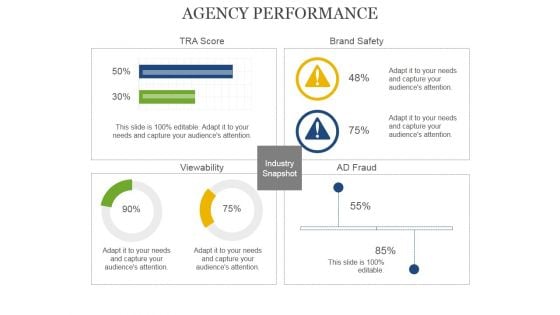
Agency Performance Template 2 Ppt PowerPoint Presentation Graphics
This is a agency performance template 2 ppt powerpoint presentation graphics. This is a four stage process. The stages in this process are view ability, ad fraud, industry snapshot, brand safety, tra score.
Target Market Ppt PowerPoint Presentation Backgrounds
This is a target market ppt powerpoint presentation backgrounds. This is a two stage process. The stages in this process are business, strategy, marketing, analysis, target market share, finance.
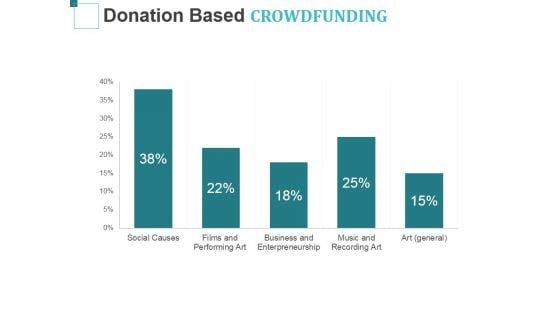
Donation Based Crowdfunding Ppt PowerPoint Presentation Layouts Deck
This is a donation based crowdfunding ppt powerpoint presentation layouts deck. This is a five stage process. The stages in this process are social causes, films and, performing art, business and enterpreneurship, music and recording art.

Key Performance Indicators Template 3 Ppt PowerPoint Presentation Samples
This is a key performance indicators template 3 ppt powerpoint presentation samples. This is a four stage process. The stages in this process are objective, measures, targets, invites.
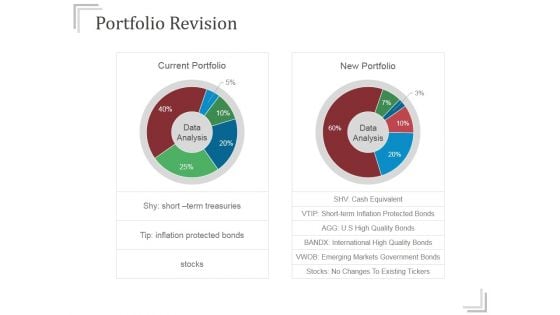
Portfolio Revision Ppt PowerPoint Presentation Slide
This is a portfolio revision ppt powerpoint presentation slide. This is a two stage process. The stages in this process are current portfolio, new portfolio, data analysis.
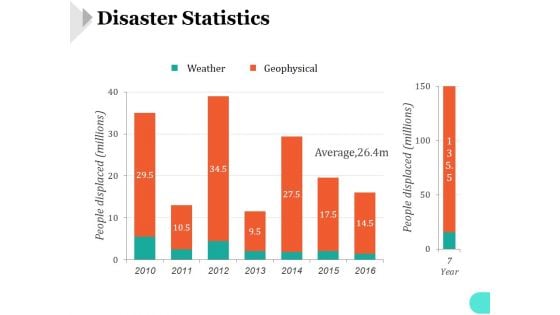
Disaster Statistics Ppt PowerPoint Presentation Portfolio
This is a disaster statistics ppt powerpoint presentation portfolio. This is a seven stage process. The stages in this process are weather, geophysical, average.
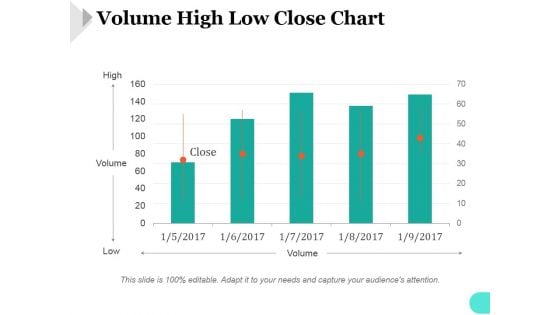
Volume High Low Close Chart Ppt PowerPoint Presentation Show
This is a volume high low close chart ppt powerpoint presentation show. This is a five stage process. The stages in this process are high, volume, low.
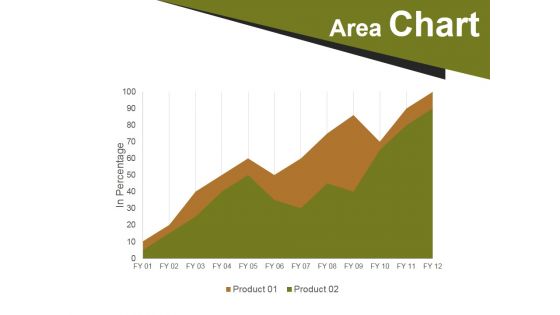
Area Chart Ppt PowerPoint Presentation Pictures Rules
This is a area chart ppt powerpoint presentation pictures rules. This is a two stage process. The stages in this process are area chart, business, marketing, strategy, success.
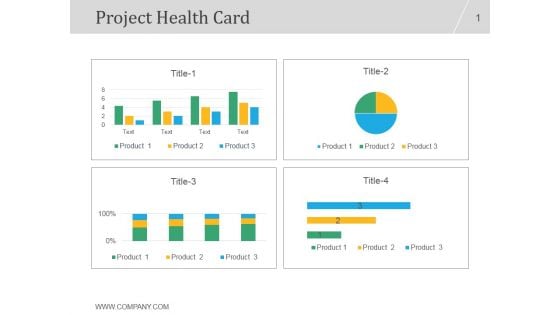
Project Health Card Ppt PowerPoint Presentation Samples
This is a project health card ppt powerpoint presentation samples. This is a four stage process. The stages in this process are product, business, marketing, management, success.
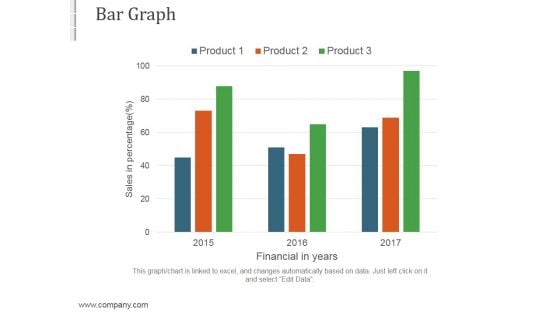
Bar Graph Ppt PowerPoint Presentation Themes
This is a bar graph ppt powerpoint presentation themes. This is a three stage process. The stages in this process are business, marketing, strategy, success, management.
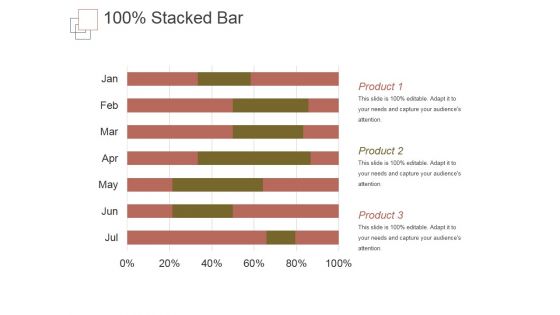
Stacked Bar Template 1 Ppt PowerPoint Presentation Themes
This is a stacked bar template 1 ppt powerpoint presentation themes. This is a six stage process. The stages in this process are product, business, marketing, success, management.
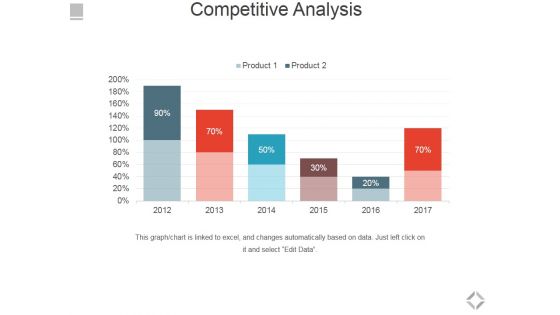
Competitive Analysis Ppt PowerPoint Presentation Slides Design Templates
This is a competitive analysis ppt powerpoint presentation slides design templates. This is a six stage process. The stages in this process are business, marketing, management, success, presentation.
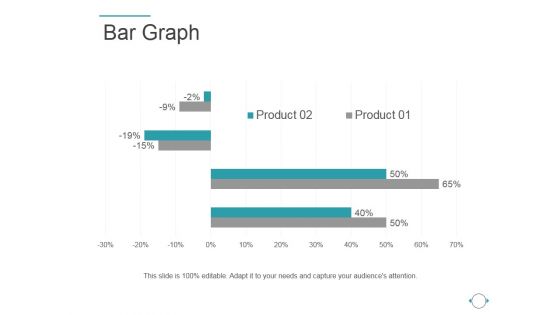
Bar Graph Ppt PowerPoint Presentation Layouts Good
This is a bar graph ppt powerpoint presentation layouts good. This is a two stage process. The stages in this process are bar graph, finance, success, strategy, management.
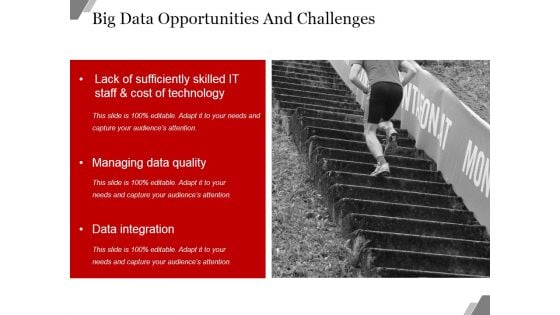
Big Data Opportunities And Challenges Template Ppt PowerPoint Presentation Design Ideas
This is a big data opportunities and challenges template ppt powerpoint presentation design ideas. This is a three stage process. The stages in this process are business, marketing, success, finance, analysis.
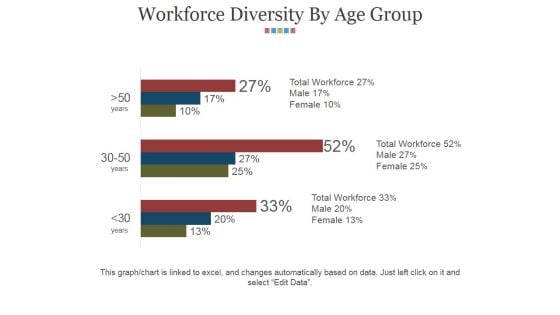
Workforce Diversity By Age Group Ppt PowerPoint Presentation Infographics Slides
This is a workforce diversity by age group ppt powerpoint presentation infographics slides. This is a three stage process. The stages in this process are finance, analysis, success, strategy, business, marketing.
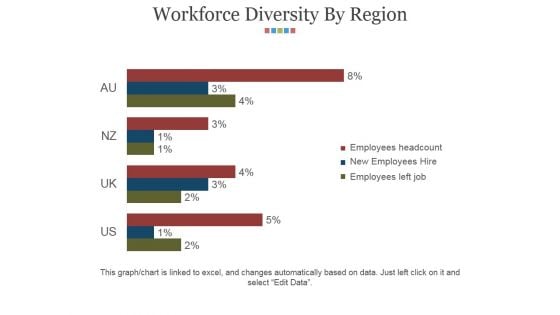
Workforce Diversity By Region Ppt PowerPoint Presentation Infographics Grid
This is a workforce diversity by region ppt powerpoint presentation infographics grid. This is a four stage process. The stages in this process are finance, analysis, success, strategy, business, marketing.
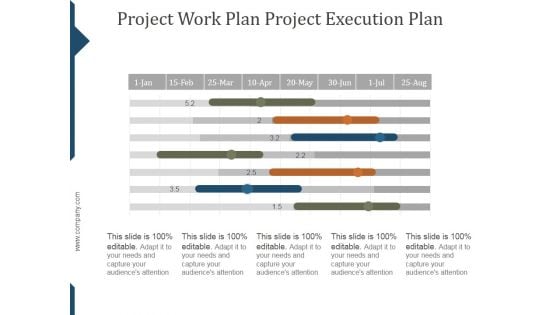
Project Work Plan Project Execution Plan Ppt PowerPoint Presentation Deck
This is a project work plan project execution plan ppt powerpoint presentation deck. This is a six stage process. The stages in this process are business, analysis, strategy, process, success.

Four Vertical Columns For Percentage Comparison Ppt PowerPoint Presentation Introduction
This is a four vertical columns for percentage comparison ppt powerpoint presentation introduction. This is a four stage process. The stages in this process are business, marketing, success, management, presentation.


 Continue with Email

 Home
Home


