Financial Icons
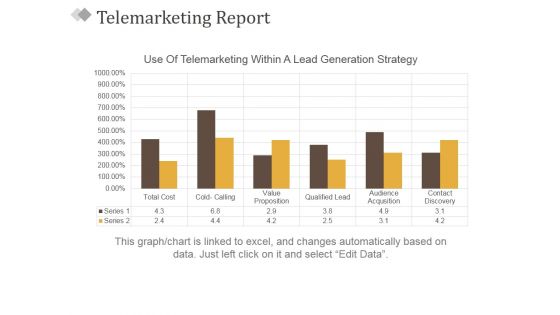
Telemarketing Report Template 2 Ppt PowerPoint Presentation Styles Model
This is a telemarketing report template 2 ppt powerpoint presentation styles model. This is a six stage process. The stages in this process are use of telemarketing within a lead generation strategy, business, bar graph, marketing, success.
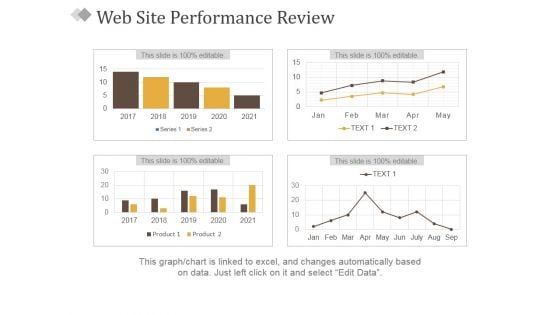
Web Site Performance Review Ppt PowerPoint Presentation Inspiration Designs Download
This is a web site performance review ppt powerpoint presentation inspiration designs download. This is a four stage process. The stages in this process are business, tables, marketing, success, planning.
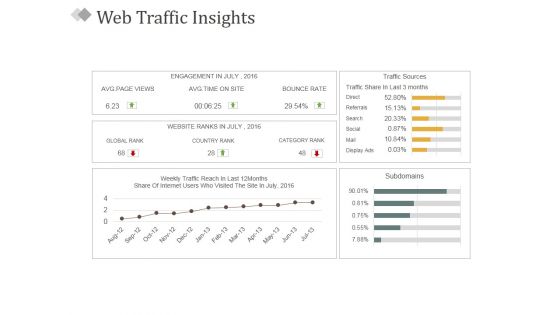
Web Traffic Insights Ppt PowerPoint Presentation Pictures Slides
This is a web traffic insights ppt powerpoint presentation pictures slides. This is a five stage process. The stages in this process are engagement in july, avg page views, global rank, country rank, category rank, bounce rate.
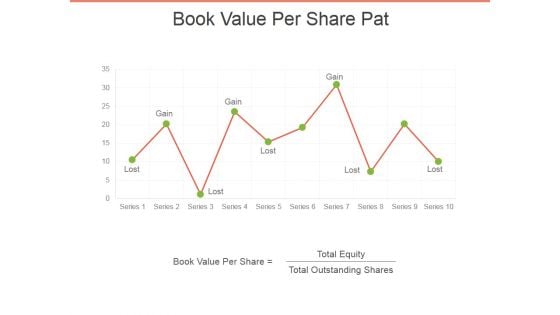
Book Value Per Share Pat Ppt PowerPoint Presentation Ideas Influencers
This is a book value per share pat ppt powerpoint presentation ideas influencers. This is a one stage process. The stages in this process are book value per share, total equity, total outstanding shares.
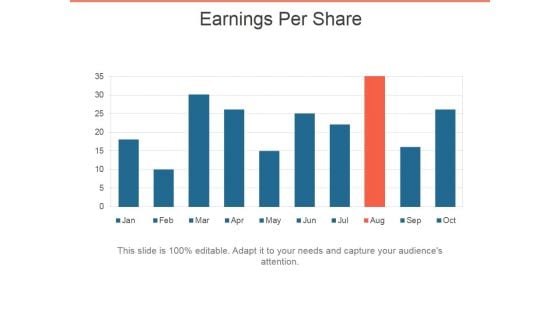
Earnings Per Share Ppt PowerPoint Presentation Layouts Ideas
This is a earnings per share ppt powerpoint presentation layouts ideas. This is a ten stage process. The stages in this process are business, years, planning, management, marketing.
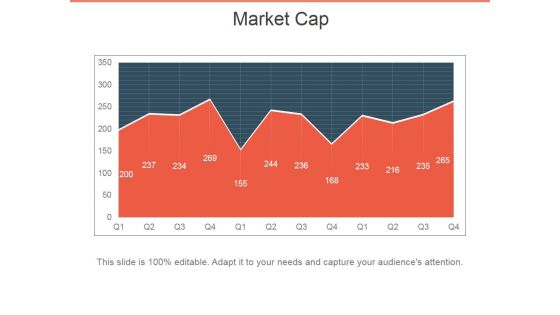
Market Cap Ppt PowerPoint Presentation File Display
This is a market cap ppt powerpoint presentation file display. This is a two stage process. The stages in this process are market cap, business, marketing, success, graph.
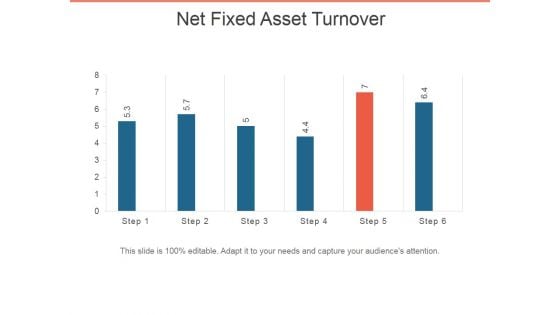
Net Fixed Asset Turnover Ppt PowerPoint Presentation Infographic Template Pictures
This is a net fixed asset turnover ppt powerpoint presentation infographic template pictures. This is a six stage process. The stages in this process are bar graph, business, marketing, presentation, success.
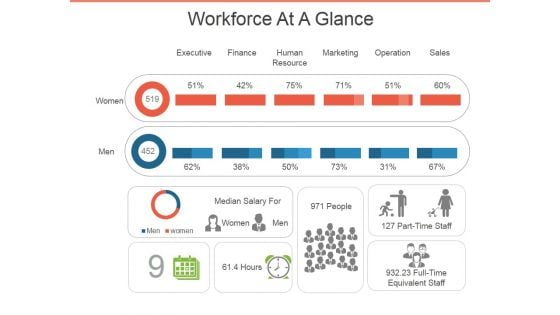
Workforce At A Glance Ppt PowerPoint Presentation Infographic Template Topics
This is a workforce at a glance ppt powerpoint presentation infographic template topics. This is a eight stage process. The stages in this process are executive, finance, human resource, marketing, operation, sales.
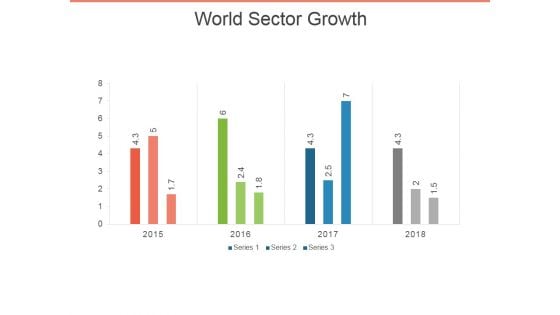
World Sector Growth Ppt PowerPoint Presentation Infographics Objects
This is a world sector growth ppt powerpoint presentation infographics objects. This is a four stage process. The stages in this process are bar graph, business, marketing, success, presentation.
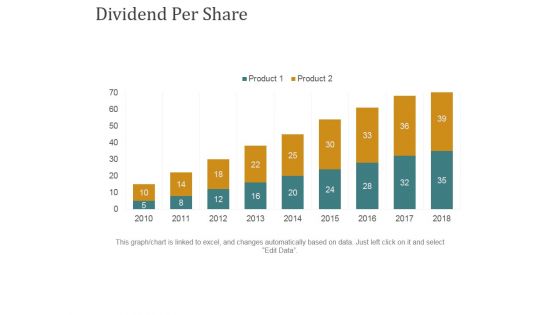
Dividend Per Share Ppt PowerPoint Presentation Summary Rules
This is a dividend per share ppt powerpoint presentation summary rules. This is a nine stage process. The stages in this process are business, bar graph, finance, marketing, strategy, growth.
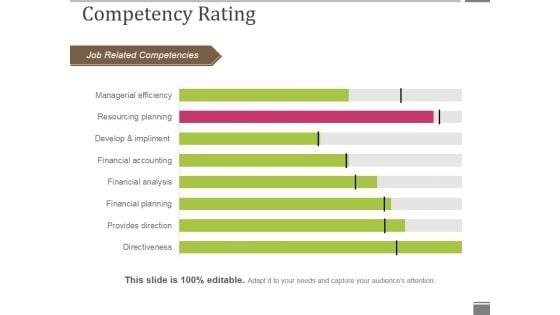
Competency Rating Template 1 Ppt PowerPoint Presentation Outline Smartart
This is a competency rating template 1 ppt powerpoint presentation outline smartart. This is a eight stage process. The stages in this process are job related competencies, competency rating, bar graph, business, marketing.
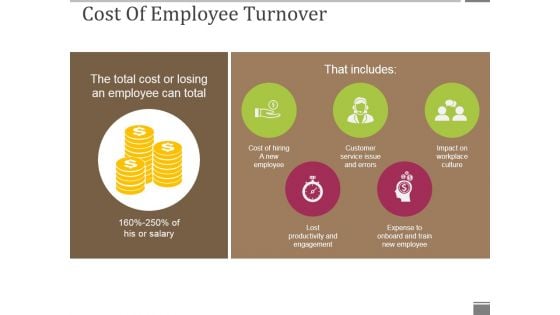
Cost Of Employee Turnover Ppt PowerPoint Presentation Infographic Template Example Introduction
This is a cost of employee turnover ppt powerpoint presentation infographic template example introduction. This is a two stage process. The stages in this process are cost of hiring a new employee, lost productivity and engagement, expense to onboard and train new employee, customer service issue and errors, impact on workplace culture.
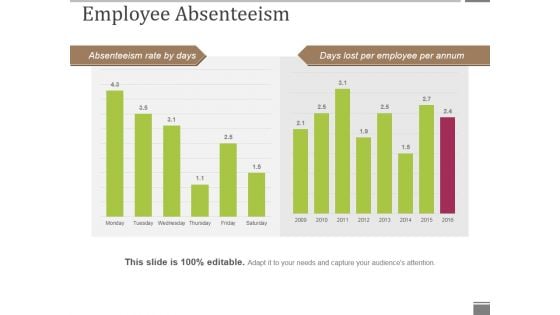
Employee Absenteeism Ppt PowerPoint Presentation Styles Show
This is a employee absenteeism ppt powerpoint presentation styles show. This is a two stage process. The stages in this process are absenteeism rate by days, days lost per employee per annum, business, planning, management.
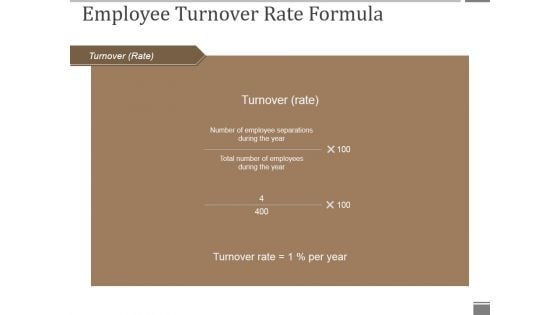
Employee Turnover Rate Formula Ppt PowerPoint Presentation Pictures Aids
This is a employee turnover rate formula ppt powerpoint presentation pictures aids. This is a five stage process. The stages in this process are employee turnover, rate of tune over, business, marketing, bar graph.
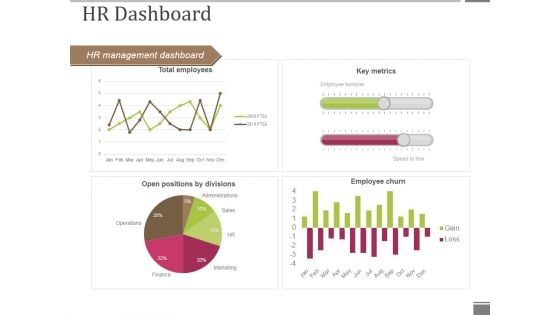
Hr Dashboard Template 1 Ppt PowerPoint Presentation Infographic Template Format Ideas
This is a hr dashboard template 1 ppt powerpoint presentation infographic template format ideas. This is a four stage process. The stages in this process are hr management dashboard, key metrics, employee churn, open positions by divisions, total employees.
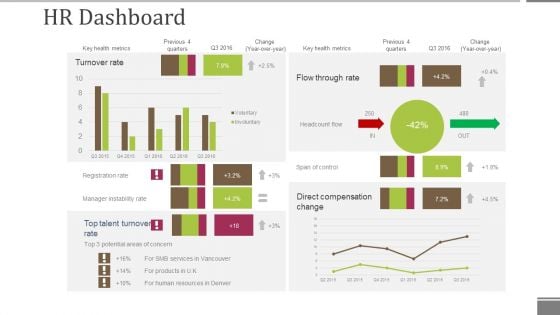
Hr Dashboard Template 2 Ppt PowerPoint Presentation File Grid
This is a hr dashboard template 2 ppt powerpoint presentation file grid. This is a four stage process. The stages in this process are turnover rate, direct compensation change, span of control, headcount flow, flow through rate.
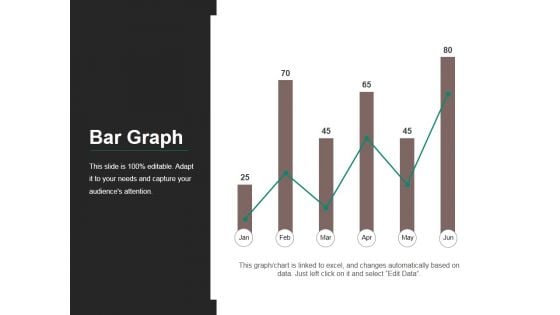
Bar Graph Ppt PowerPoint Presentation Slides Graphic Images
This is a bar graph ppt powerpoint presentation slides graphic images. This is a six stage process. The stages in this process are bar, finance, business, marketing, growth.
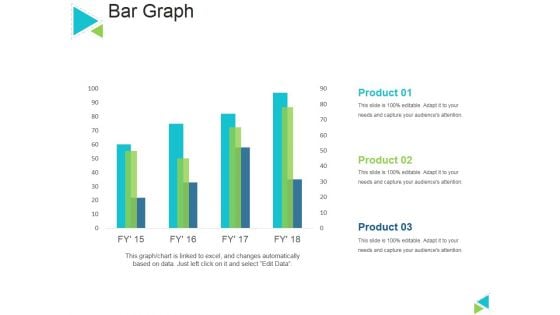
Bar Graph Ppt PowerPoint Presentation Outline Layout
This is a bar graph ppt powerpoint presentation outline layout. This is a four stage process. The stages in this process are sales in percentage, product, bar graph, business, marketing.
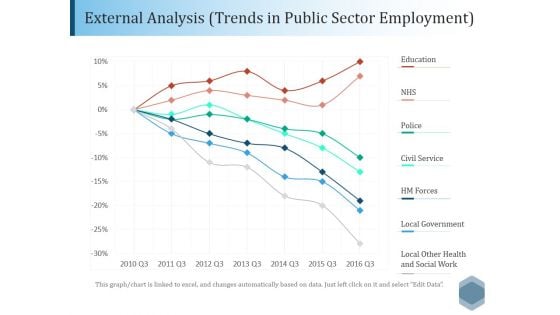
External Analysis Trends In Public Sector Employment Ppt PowerPoint Presentation File Outline
This is a external analysis trends in public sector employment ppt powerpoint presentation file outline. This is a seven stage process. The stages in this process are education, nhs, police, civil service, local government.
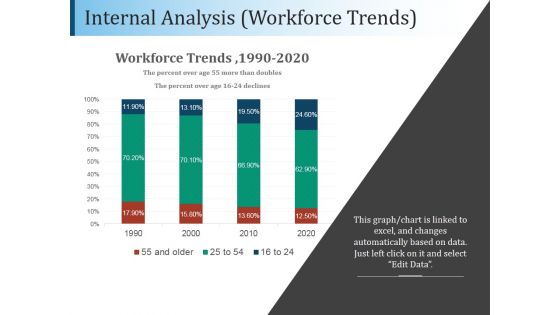
Internal Analysis Workforce Trends Ppt PowerPoint Presentation Example
This is a internal analysis workforce trends ppt powerpoint presentation example. This is a four stage process. The stages in this process are workforce trends, business, marketing, bar, finance.
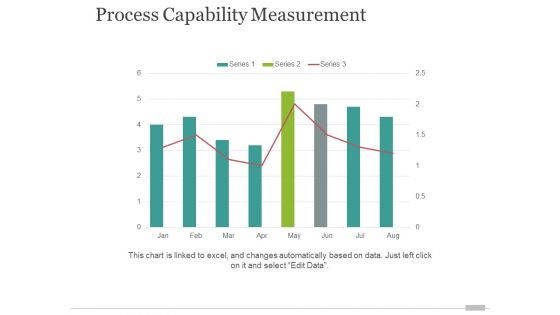
Process Capability Measurement Template 2 Ppt PowerPoint Presentation Gallery Graphics Example
This is a process capability measurement template 2 ppt powerpoint presentation gallery graphics example. This is a eight stage process. The stages in this process are finance, analysis, business, strategy, marketing.
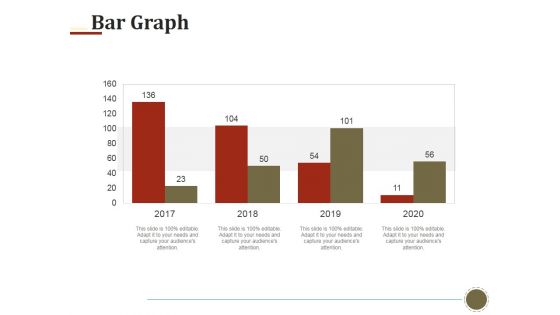
Bar Graph Ppt PowerPoint Presentation Styles Model
This is a bar graph ppt powerpoint presentation styles model. This is a four stage process. The stages in this process are bar graph, finance, marketing, analysis, investment, business.
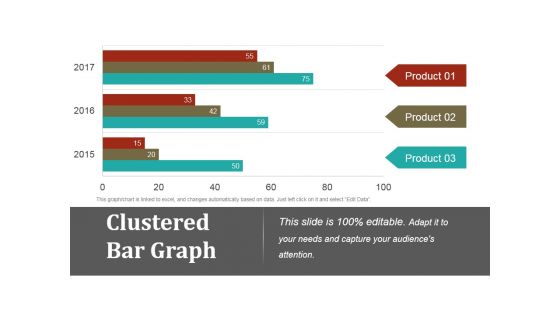
Clustered Bar Graph Ppt PowerPoint Presentation Gallery Graphics Example
This is a clustered bar graph ppt powerpoint presentation gallery graphics example. This is a three stage process. The stages in this process are clustered bar graph, finance, marketing, strategy, business.
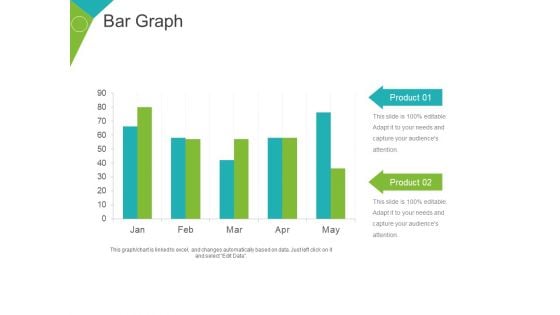
Bar Graph Ppt PowerPoint Presentation Layouts Professional
This is a bar graph ppt powerpoint presentation layouts professional. This is a five stage process. The stages in this process are product, business, marketing, finance, graph.
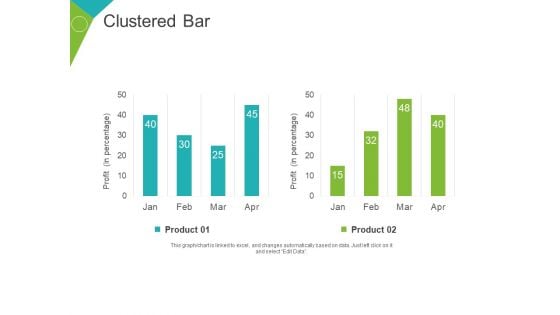
Clustered Bar Ppt PowerPoint Presentation Model Slides
This is a clustered bar ppt powerpoint presentation model slides. This is a two stage process. The stages in this process are product, profit, business, finance, percentage.
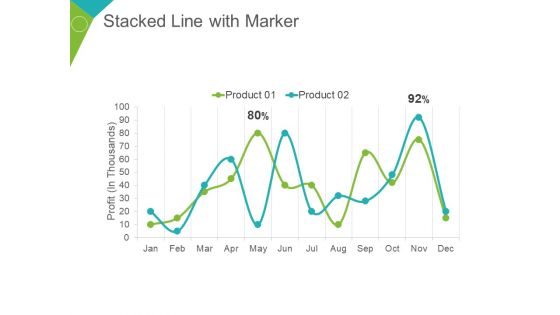
Stacked Line With Marker Ppt PowerPoint Presentation Summary Demonstration
This is a stacked line with marker ppt powerpoint presentation summary demonstration. This is a two stage process. The stages in this process are profit in thousands, product, percentage, finance, business.
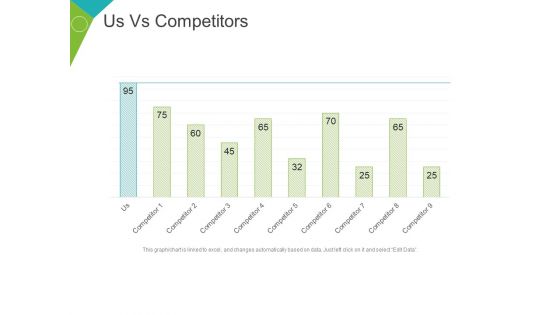
Us Vs Competitors Template 2 Ppt PowerPoint Presentation File Show
This is a us vs competitors template 2 ppt powerpoint presentation file show. This is a nine stage process. The stages in this process are competitor, graph, business, marketing, finance.
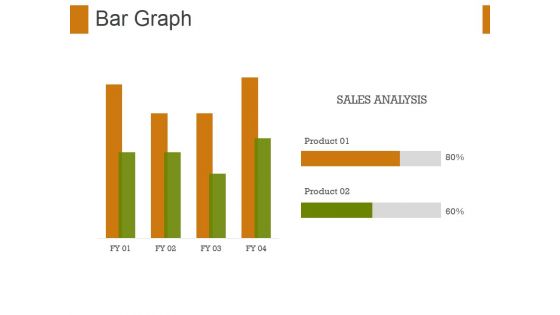
Bar Graph Ppt PowerPoint Presentation File Graphic Tips
This is a bar graph ppt powerpoint presentation file graphic tips. This is a two stage process. The stages in this process are bar graph, finance, marketing, strategy, sales, business.
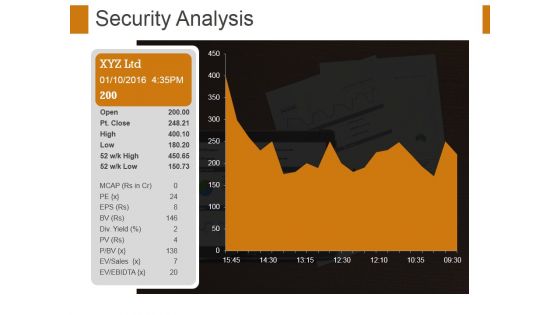
Security Analysis Ppt PowerPoint Presentation File Format Ideas
This is a security analysis ppt powerpoint presentation file format ideas. This is a one stage process. The stages in this process are security analysis, growth, strategy, management, business.
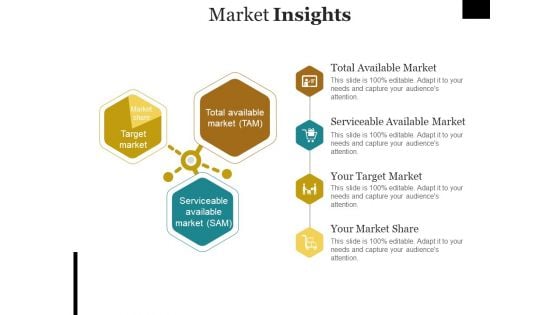
Market Insights Template Ppt PowerPoint Presentation Summary Example
This is a market insights template ppt powerpoint presentation summary example. This is a three stage process. The stages in this process are business, bar, market, growth, success.
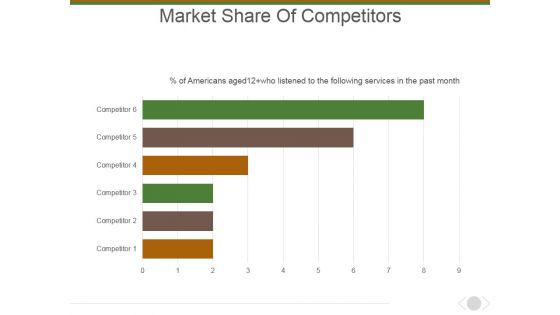
Market Share Of Competitors Ppt PowerPoint Presentation Layouts Picture
This is a market share of competitors ppt powerpoint presentation layouts picture. This is a six stage process. The stages in this process are marketing, business, management, bar graph, presentation.
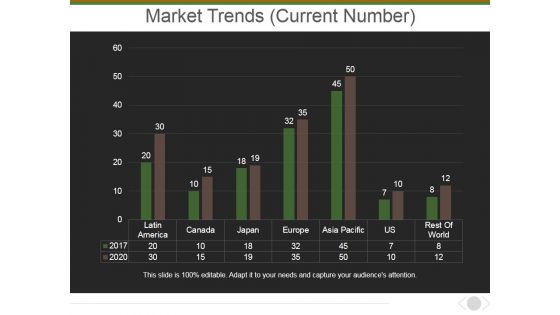
Market Trends Current Number Ppt PowerPoint Presentation Outline Rules
This is a market trends current number ppt powerpoint presentation outline rules. This is a seven stage process. The stages in this process are market, bar graph, business, country, planning.
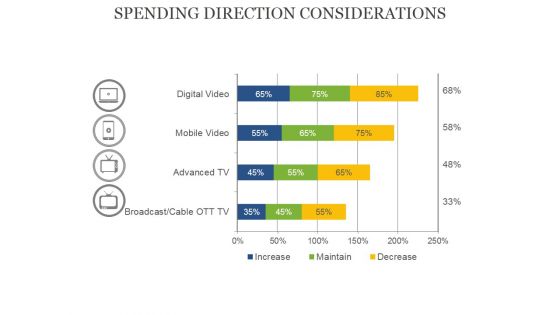
Spending Direction Considerations Ppt PowerPoint Presentation Portfolio Graphics Template
This is a spending direction considerations ppt powerpoint presentation portfolio graphics template. This is a four stage process. The stages in this process are bar graph, business, presentation, percentage, finance.
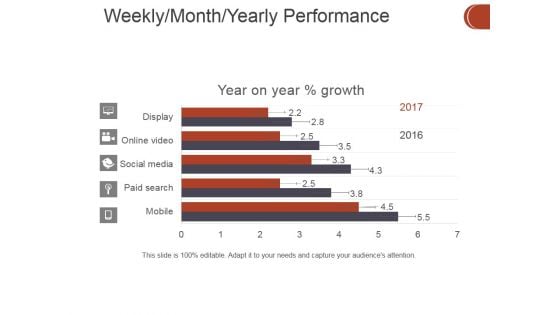
Weekly Month Yearly Performance Ppt PowerPoint Presentation Ideas Maker
This is a weekly month yearly performance ppt powerpoint presentation ideas maker. This is a five stage process. The stages in this process are business, finance, marketing, strategy, analysis, investment.
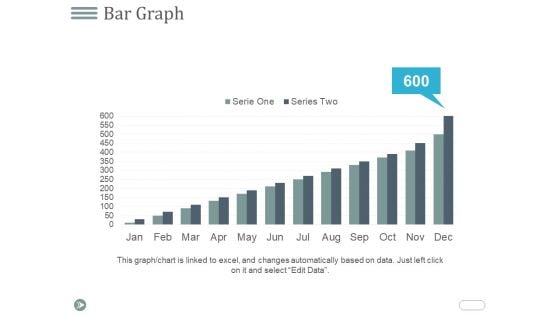
Bar Graph Ppt PowerPoint Presentation File Tips
This is a bar graph ppt powerpoint presentation file tips. This is a twelve stage process. The stages in this process are business, marketing, finance, graph, strategy.
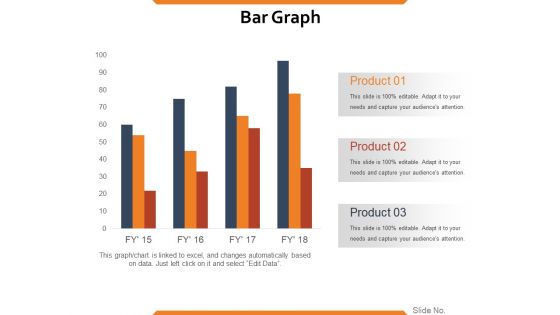
Bar Graph Ppt PowerPoint Presentation Show Guidelines
This is a bar graph ppt powerpoint presentation show guidelines. This is a four stage process. The stages in this process are product, growth, business, finance, bar graph.
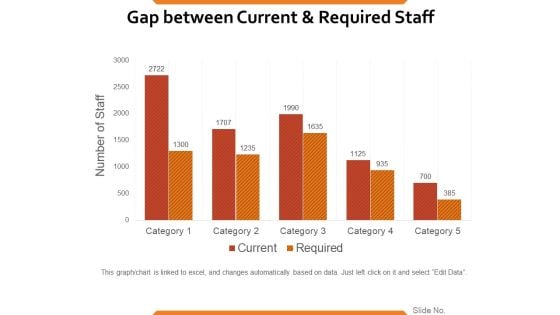
Gap Between Current And Required Staff Ppt PowerPoint Presentation Ideas Format Ideas
This is a gap between current and required staff ppt powerpoint presentation ideas format ideas. This is a five stage process. The stages in this process are number of staff, category, current, graph, finance.
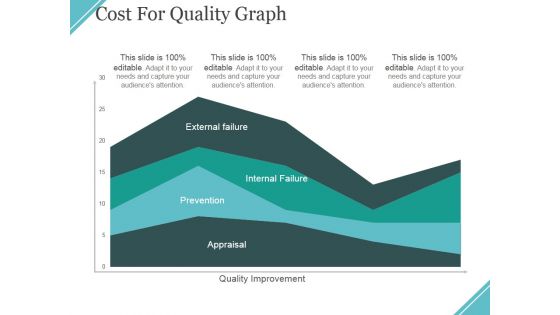
Cost For Quality Graph Ppt PowerPoint Presentation Ideas Files
This is a cost for quality graph ppt powerpoint presentation ideas files. This is a four stage process. The stages in this process are external failure, internal failure, prevention, appraisal, quality improvement.
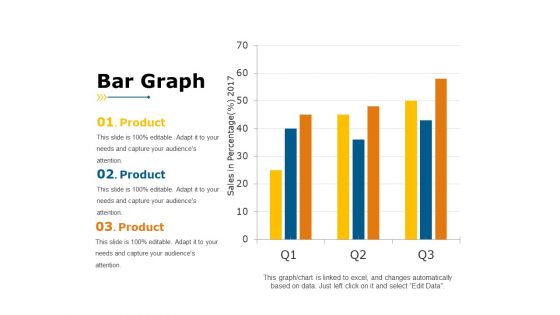
Bar Graph Ppt PowerPoint Presentation Portfolio Example
This is a bar graph ppt powerpoint presentation portfolio example. This is a three stage process. The stages in this process are sales in percentage, year, business, product, business, graph.
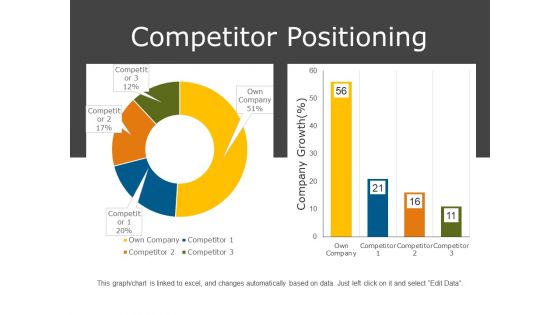
Competitor Positioning Ppt PowerPoint Presentation Styles Aids
This is a competitor positioning ppt powerpoint presentation styles aids. This is a two stage process. The stages in this process are company growth, business, percentage, finance, graph.
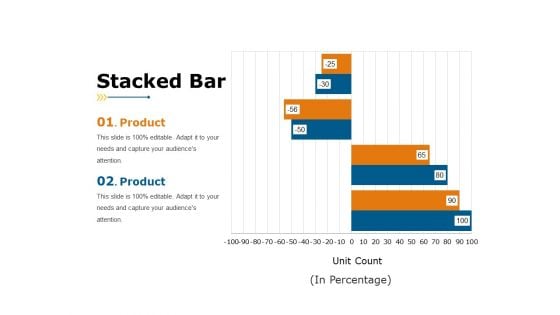
Stacked Bar Ppt PowerPoint Presentation File Sample
This is a stacked bar ppt powerpoint presentation file sample. This is a two stage process. The stages in this process are in percentage, finance, business, marketing, graph.
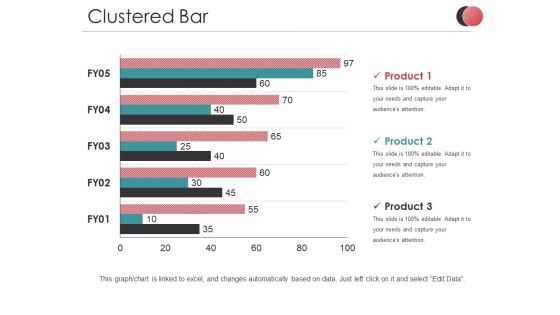
Clustered Bar Ppt PowerPoint Presentation Styles Elements
This is a clustered bar ppt powerpoint presentation styles elements. This is a three stage process. The stages in this process are product, business, marketing finance, graph.
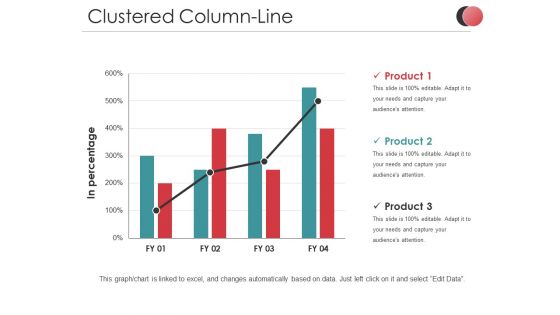
Clustered Column Line Ppt PowerPoint Presentation Infographics Templates
This is a clustered column line ppt powerpoint presentation infographics templates. This is a three stage process. The stages in this process are in percentage, business, marketing, product, finance, graph.
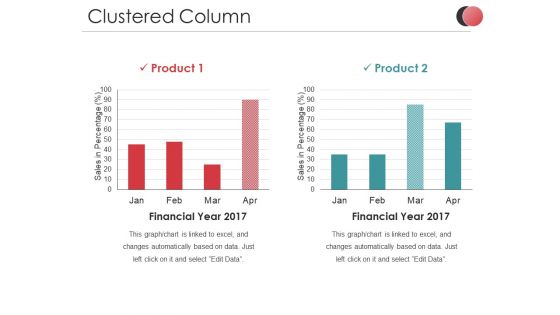
Clustered Column Ppt PowerPoint Presentation Slides Ideas
This is a clustered column ppt powerpoint presentation slides ideas. This is a two stage process. The stages in this process are sales in percentage, business, marketing, finance, graph.
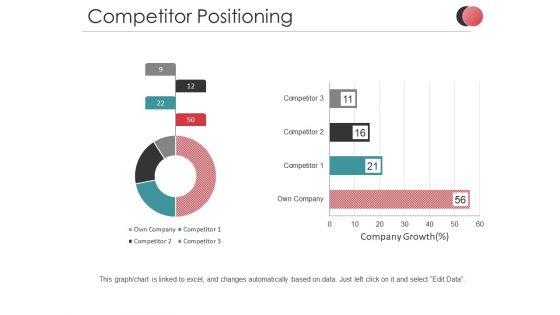
Competitor Positioning Ppt PowerPoint Presentation Outline Tips
This is a competitor positioning ppt powerpoint presentation outline tips. This is a two stage process. The stages in this process are company growth, business, marketing, finance, graph.
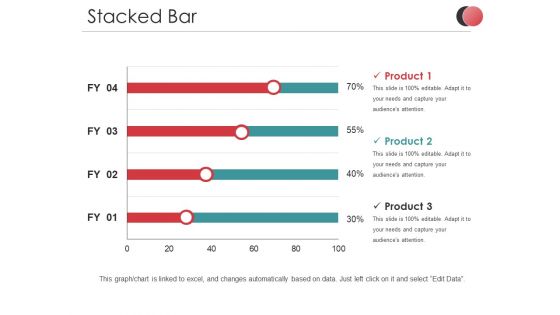
Stacked Bar Ppt PowerPoint Presentation Pictures Graphics
This is a stacked bar ppt powerpoint presentation pictures graphics. This is a three stage process. The stages in this process are product, percentage, business, marketing, finance.
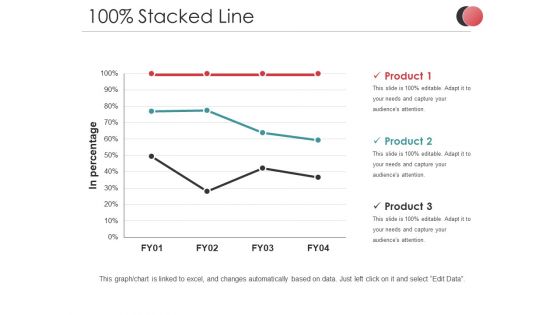
Stacked Line Ppt PowerPoint Presentation Portfolio Background Image
This is a stacked line ppt powerpoint presentation portfolio background image. This is a three stage process. The stages in this process are product, percentage, business, marketing, finance.
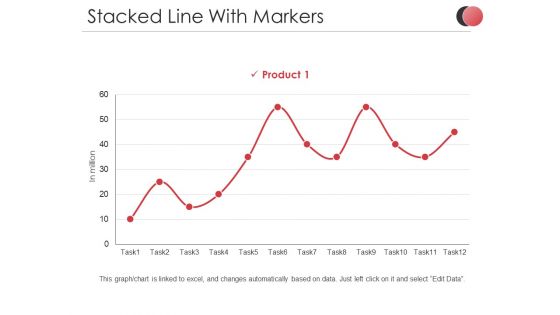
Stacked Line With Markers Ppt PowerPoint Presentation Slides Demonstration
This is a stacked line with markers ppt powerpoint presentation slides demonstration. This is a one stage process. The stages in this process are in million, product, percentage, business, marketing, finance.
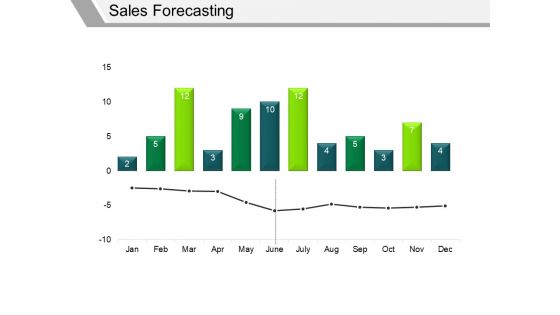
Sales Forecasting Template 2 Ppt PowerPoint Presentation File Graphics
This is a sales forecasting template 2 ppt powerpoint presentation file graphics. This is a two stage process. The stages in this process are finance, marketing, graph, business.
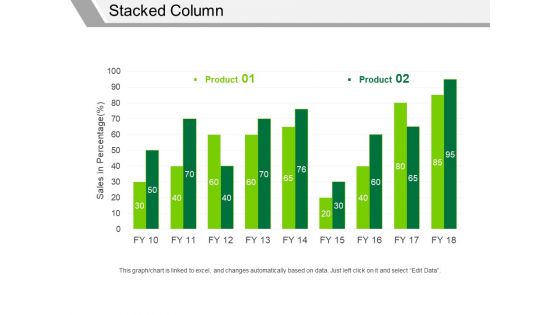
Stacked Column Ppt PowerPoint Presentation Infographics Samples
This is a stacked column ppt powerpoint presentation infographics samples. This is a two stage process. The stages in this process are product, sales in percentage, business, marketing, graph.
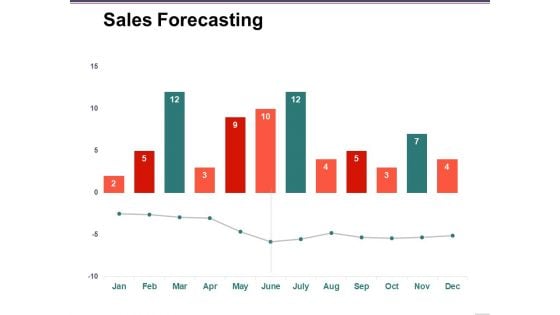
Sales Forecasting Template 2 Ppt PowerPoint Presentation Infographic Template Examples
This is a sales forecasting template 2 ppt powerpoint presentation infographic template examples. This is a two stage process. The stages in this process are forecasting, business, marketing, finance, graph.
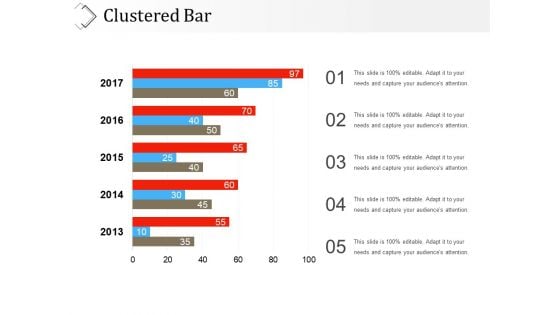
Clustered Bar Ppt PowerPoint Presentation Outline Model
This is a clustered bar ppt powerpoint presentation outline model. This is a five stage process. The stages in this process are years, business, marketing, graph, finance.
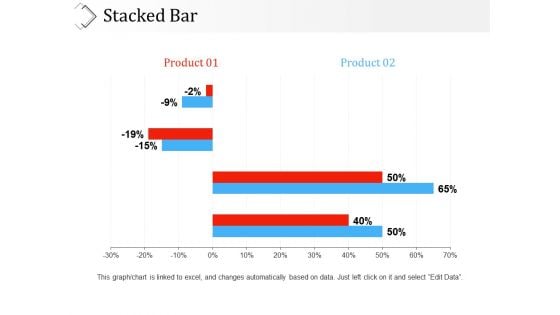
Stacked Bar Ppt PowerPoint Presentation Infographic Template Clipart
This is a stacked bar ppt powerpoint presentation infographic template clipart. This is a two stage process. The stages in this process are product, percentage, business, marketing, graph.
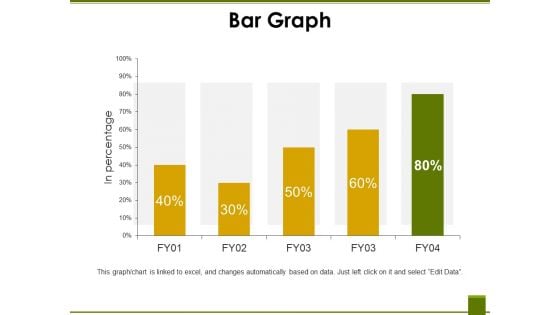
Bar Graph Template 2 Ppt PowerPoint Presentation Ideas Files
This is a bar graph template 2 ppt powerpoint presentation ideas files. This is a five stage process. The stages in this process are in percentage, business, marketing, finance, graph.
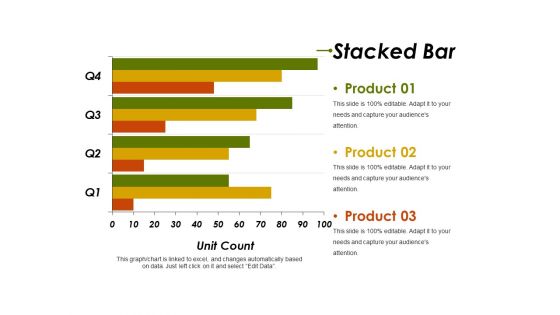
Stacked Bar Ppt PowerPoint Presentation Summary Infographics
This is a stacked bar ppt powerpoint presentation summary infographics. This is a four stage process. The stages in this process are product, unit count, business, marketing, graph.
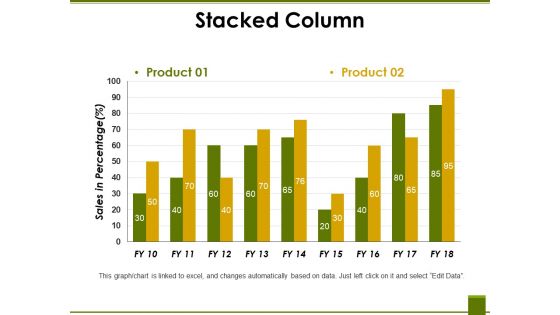
Stacked Column Ppt PowerPoint Presentation Professional Vector
This is a stacked column ppt powerpoint presentation professional vector. This is a two stage process. The stages in this process are product, sales in percentage, business, marketing, graph.
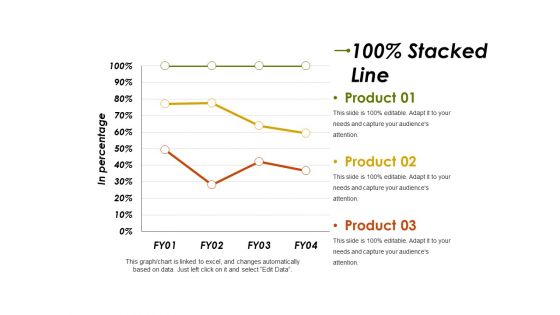
Stacked Line Ppt PowerPoint Presentation Infographic Template Graphics Template
This is a stacked line ppt powerpoint presentation infographic template graphics template. This is a three stage process. The stages in this process are product, in percentage, business, marketing, finance.
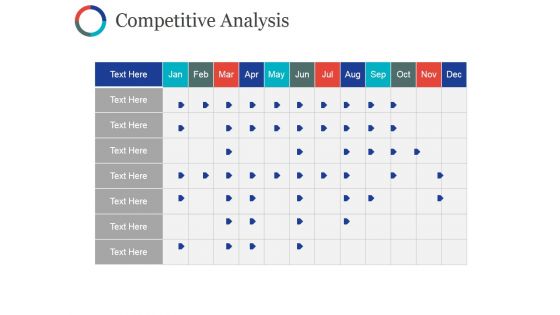
Competitive Analysis Ppt PowerPoint Presentation Summary Model
This is a competitive analysis ppt powerpoint presentation summary model. This is a six stage process. The stages in this process are business, marketing, strategy, bar, finance.
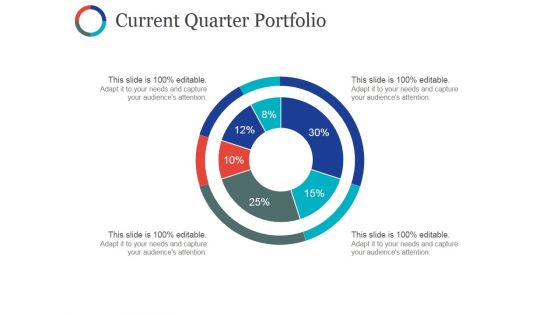
Current Quarter Portfolio Ppt PowerPoint Presentation Summary Ideas
This is a current quarter portfolio ppt powerpoint presentation summary ideas. This is a two stage process. The stages in this process are business, marketing, bar, finance, strategy.
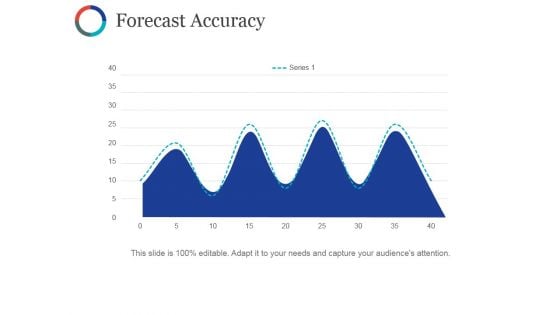
Forecast Accuracy Template Ppt PowerPoint Presentation Styles Format Ideas
This is a forecast accuracy template ppt powerpoint presentation styles format ideas. This is a four stage process. The stages in this process are business, marketing, strategy, graph, planning.


 Continue with Email

 Home
Home


