Financial Icons
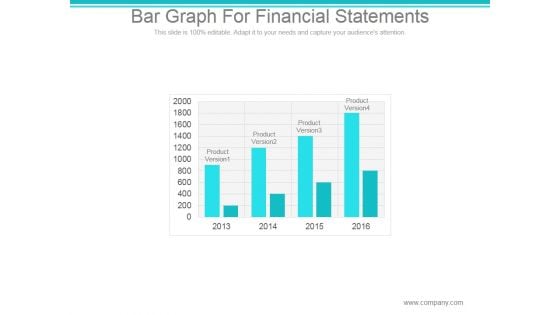
Bar Graph For Financial Statements Ppt PowerPoint Presentation Example
This is a bar graph for financial statements ppt powerpoint presentation example. This is a four stage process. The stages in this process are product version, finance, year.
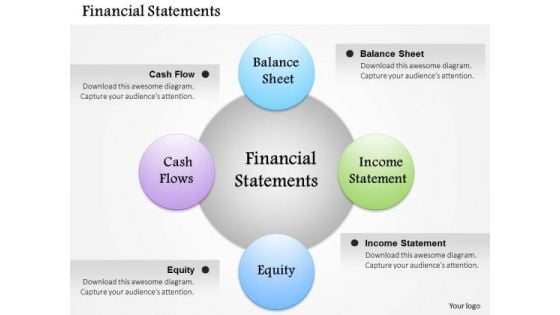
Sales Diagram Circular Financial Process Diagram Business Framework Model
Deliver The Right Dose With Our Sales Diagram Circular Financial Process Diagram Business Framework Model Powerpoint Templates. Your Ideas Will Get The Correct Illumination. Your Abilities Have Been Lying Dormant. Awaken Them With Our Sales Diagram Circular Financial Process Diagram Business Framework Model Powerpoint Templates.
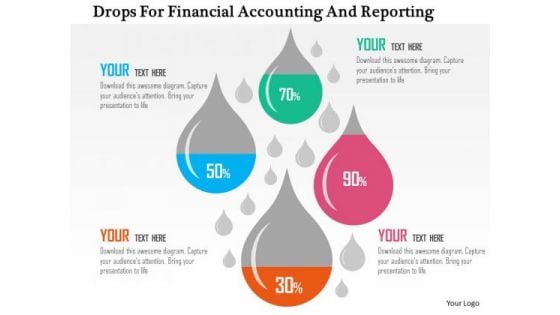
Business Diagram Drops For Financial Accounting And Reporting Presentation Template
This business diagram has been designed with drops displaying financial ratios. Download this diagram to depict financial and accounting ratios. Use this slide to build quality presentations for your viewers.
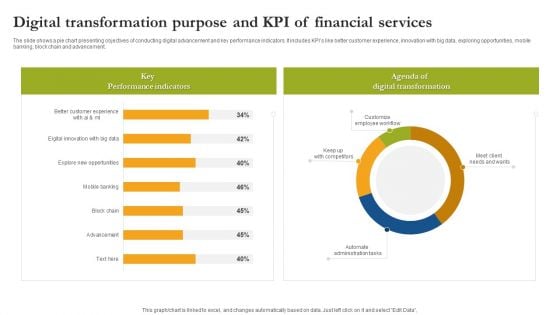
Digital Transformation Purpose And Kpi Of Financial Services Guidelines PDF
The slide shows a pie chart presenting objectives of conducting digital advancement and key performance indicators. It includes KPIs like better customer experience, innovation with big data, exploring opportunities, mobile banking, block chain and advancement. Showcasing this set of slides titled Digital Transformation Purpose And Kpi Of Financial Services Guidelines PDF. The topics addressed in these templates are Key Performance Indicators Digital Transformation, Customize Employee Workflow. All the content presented in this PPT design is completely editable. Download it and make adjustments in color, background, font etc. as per your unique business setting.
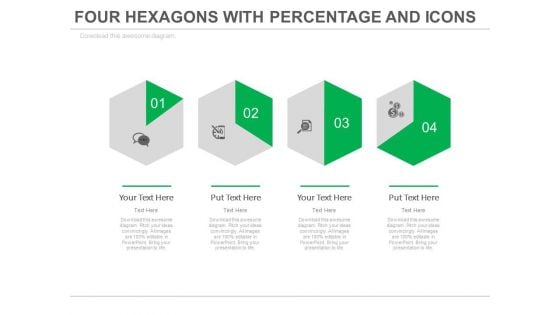
Four Steps Of Financial Growth Analysis Powerpoint Slides
This PowerPoint template with multiple Hexagons can be creatively used to present a timeline in a visual manner. This slide can also help the audience understand a 6 step process in an easier manner. The icons are totally customizable and can be edited to represent the particular process happening at that stage. It can also be used to represent different times or different activities to be carried out at different times in in a day in an office or an organization (e.g. - Medicine schedule) since the hexagon represents a clock and change of shade moves in a clockwise manner. The diagram can be used to represent a comparison or a report or an analysis of the data.
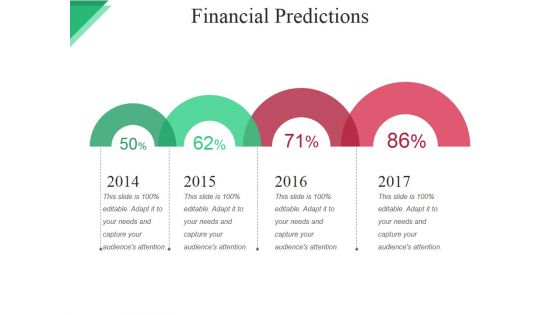
Financial Predictions Ppt PowerPoint Presentation File Clipart Images
This is a financial predictions ppt powerpoint presentation file clipart images. This is a three stage process. The stages in this process are revenue, expense, aggregate net income, monthly breakeven, aggregate breakeven.

Financial Projection Graph Template 1 Ppt PowerPoint Presentation Guide
This is a financial projection graph template 1 ppt powerpoint presentation guide. This is a three stage process. The stages in this process are annual sales, gross margin, net profit.
Financial Highlights Template 2 Ppt PowerPoint Presentation Outline Background Image
This is a financial highlights template 2 ppt powerpoint presentation outline background image. This is a four stage process. The stages in this process are financial highlights, business, marketing, success, management.
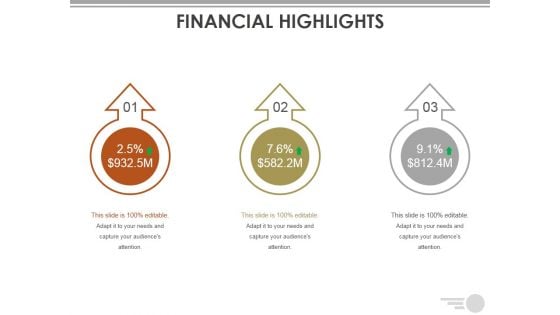
Financial Highlights Template Ppt PowerPoint Presentation File Themes
This is a financial highlights template ppt powerpoint presentation file themes. This is a eight stage process. The stages in this process are business, marketing, finance, analysis, strategy.
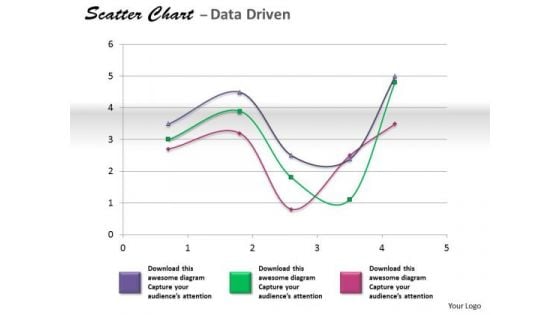
Financial Data Analysis Coordinate With Scatter Chart PowerPoint Templates
Get The Doers Into Action. Activate Them With Our financial data analysis coordinate with scatter chart Powerpoint Templates .

Semicircular Diagram For Financial Ratio Analysis PowerPoint Templates
Deliver amazing presentations with our above template displaying semicircular diagram. This slide has been professionally designed to emphasize on financial ratio analysis. This PPT slide is a best option for revealing opinions and reaching the audience.
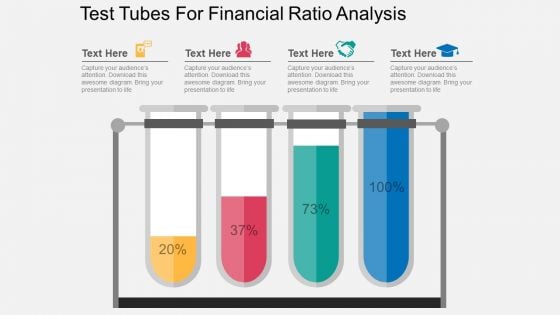
Test Tubes For Financial Ratio Analysis Powerpoint Template
Test tubes infographic diagram has been used to design this business slide. This diagram slide may be used to depict financial ratio analysis. Download this diagram for business research and analysis.
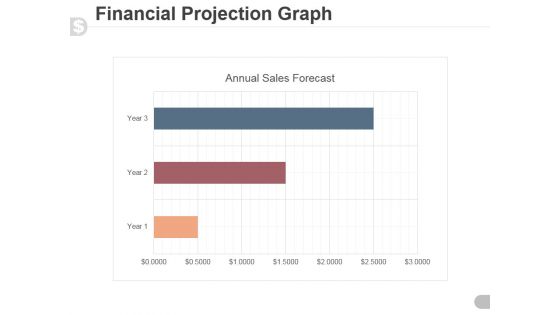
Financial Projection Graph Template 2 Ppt PowerPoint Presentation Samples
This is a financial projection graph template 2 ppt powerpoint presentation samples. This is a three stage process. The stages in this process are annual sales forecast, timeline, marketing, graph, management.
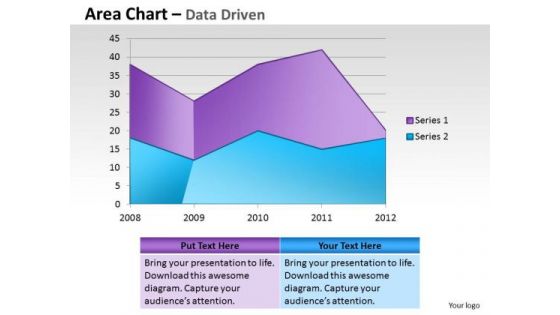
Financial Data Analysis Area Chart For Showing Trends PowerPoint Templates
Document Your Views On Our financial data analysis area chart for showing trends Powerpoint Templates . They Will Create A Strong Impression.
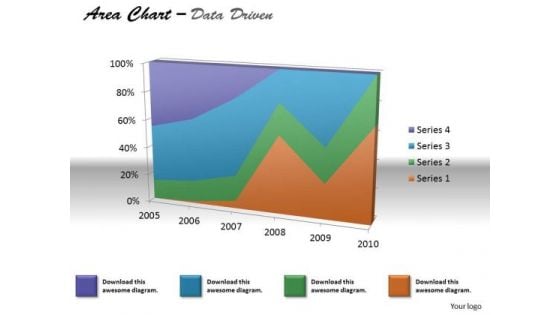
Financial Data Analysis Area Chart For Various Values PowerPoint Templates
Document The Process On Our financial data analysis area chart for various values Powerpoint Templates . Make A Record Of Every Detail.
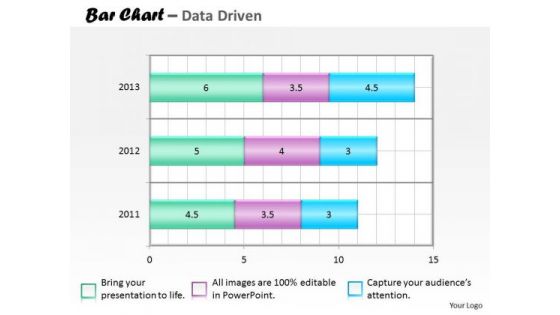
Financial Data Analysis Bar Chart For Collection Of PowerPoint Templates
Our financial data analysis bar chart for collection of Powerpoint Templates Team Are A Dogged Lot. They Keep At It Till They Get It Right.
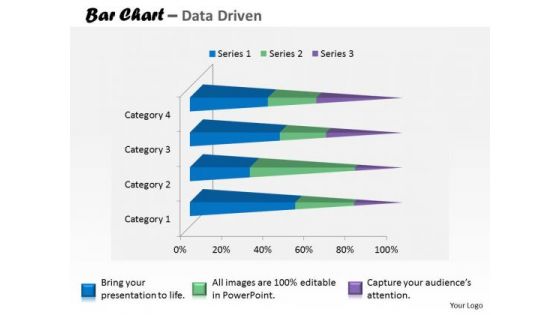
Financial Data Analysis Currency Trading Bar Chart PowerPoint Templates
Put In A Dollop Of Our financial data analysis currency trading bar chart Powerpoint Templates . Give Your Thoughts A Distinctive Flavor.
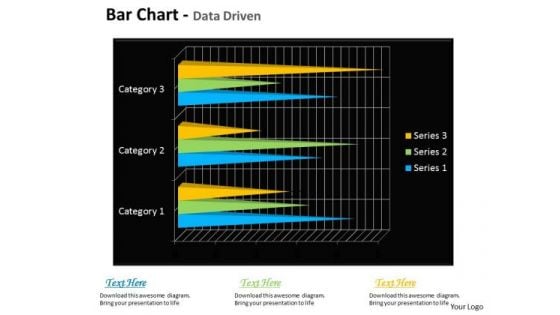
Quantitative Data Analysis Bar Chart For Financial Markets PowerPoint Templates
Draft It Out On Our quantitative data analysis bar chart for financial markets Powerpoint Templates . Give The Final Touches With Your Ideas.
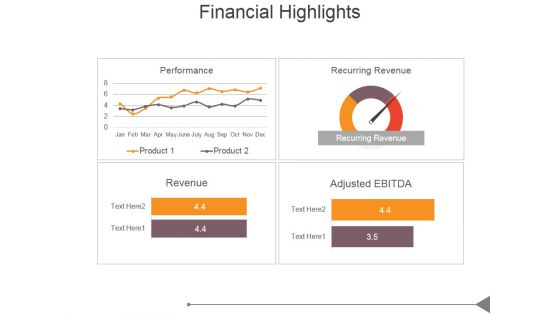
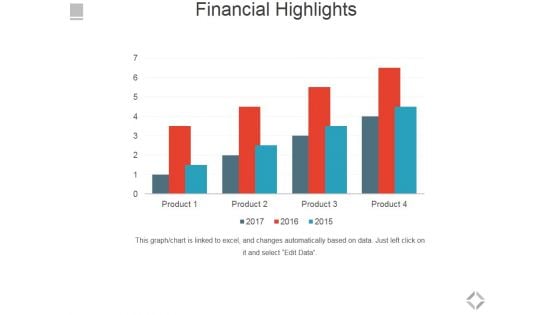
Financial Highlights Template 1 Ppt PowerPoint Presentation Model
This is a financial highlights template 1 ppt powerpoint presentation model. This is a four stage process. The stages in this process are business, marketing, success, business plan, bar graph.
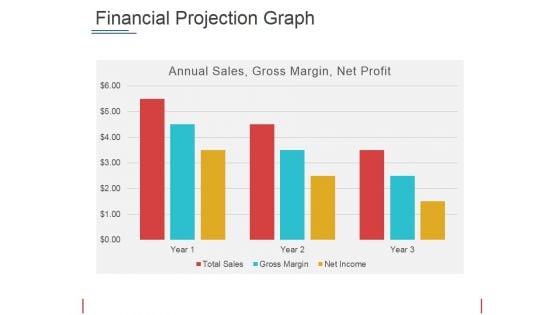
Financial Projection Graph Template 2 Ppt PowerPoint Presentation Show Picture
This is a financial projection graph template 2 ppt powerpoint presentation show picture. This is a three stage process. The stages in this process are annual sales, gross margin, net profit, years.
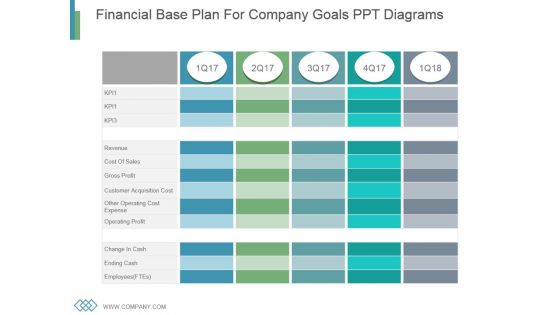
Financial Base Plan For Company Goals Ppt Diagrams
This is a financial base plan for company goals ppt diagrams. This is a five stage process. The stages in this process are revenue, cost of sales, gross profit, customer acquisition cost, other operating cost expense, operating profit, change in cash, ending cash, employees.
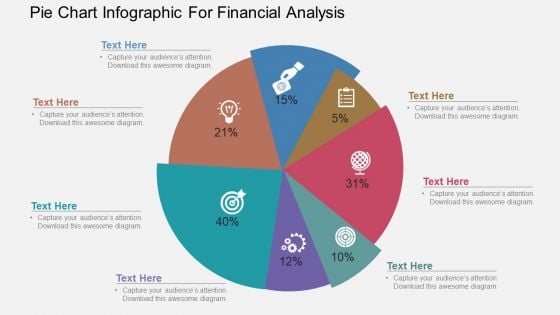
Pie Chart Infographic For Financial Analysis Powerpoint Template
Our above PowerPoint template has been designed with pie chart infographic. This slide is suitable to present financial analysis. Use this business diagram to present your work in a more smart and precise manner.
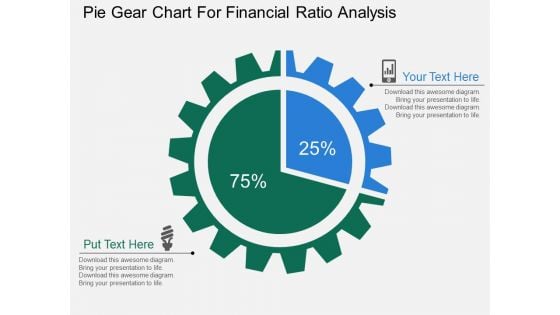
Pie Gear Chart For Financial Ratio Analysis Powerpoint Templates
This PPT slide displays diagram of pie gear chart. This PowerPoint template has been designed to exhibit financial ratio analysis. You can present your opinions using this impressive slide
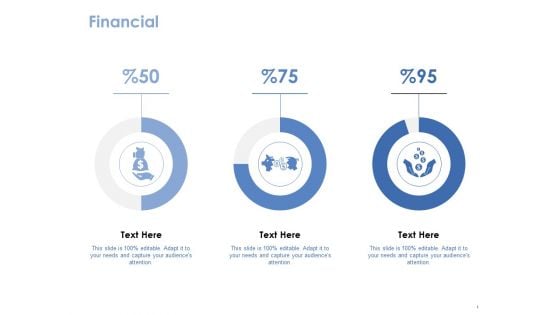
Financial Template 1 Ppt PowerPoint Presentation Pictures Files
This is a financial template 1 ppt powerpoint presentation pictures files. This is a three stage process. The stages in this process are business, finance, marketing, icons, strategy.
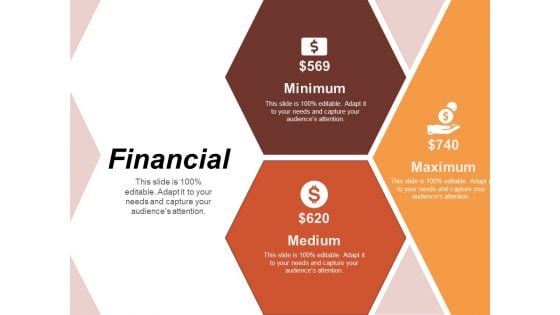
Financial Risk Estimator Ppt PowerPoint Presentation Slides Mockup
This is a financial risk estimator ppt powerpoint presentation slides mockup. This is a three stage process. The stages in this process are business, management, strategy, analysis, icons.
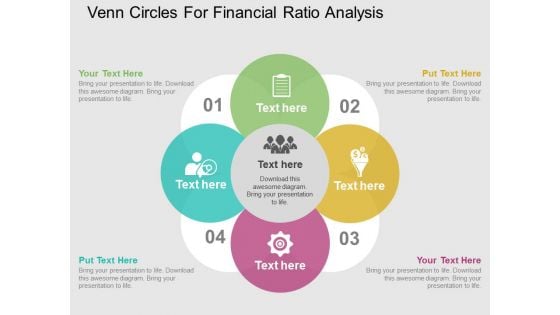
Venn Circles For Financial Ratio Analysis Powerpoint Templates
Create dynamic presentations with our professional template containing dollar plant. This diagram represents the dollar growth. Download this template to leave permanent impression on your audience.
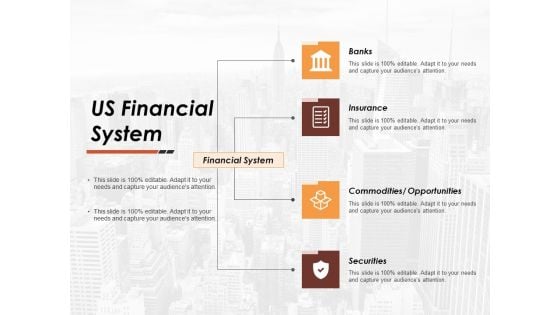
Us Financial System Ppt PowerPoint Presentation Styles Background Designs
This is a us financial system ppt powerpoint presentation styles background designs. This is a four stage process. The stages in this process are business, icons, analysis, strategy, marketing.
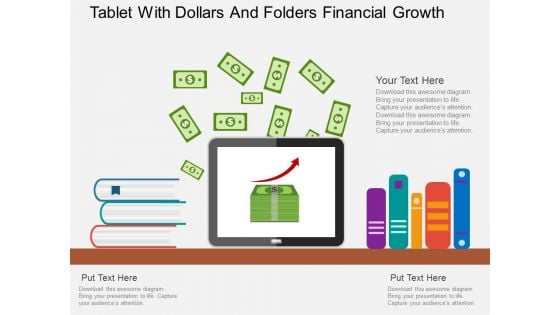
Tablet With Dollars And Folders Financial Growth Powerpoint Template
This business slide displays diagram of tablet with dollars and folders. Download this diagram to display information in visual manner. Visual effect of this diagram helps in maintaining the flow of the discussion and provides more clarity to the subject.
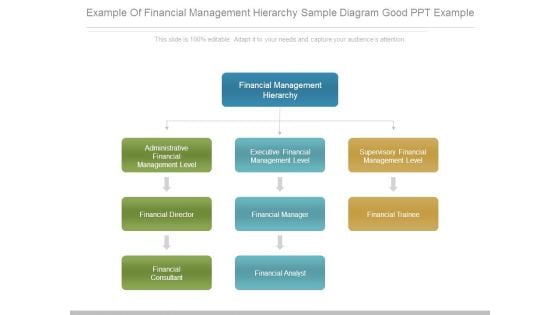
Example Of Financial Management Hierarchy Sample Diagram Good Ppt Example
This is a example of financial management hierarchy sample diagram good ppt example. This is a three stage process. The stages in this process are financial management hierarchy, administrative financial management level, executive financial management level, supervisory financial management level, financial director, financial manager, financial trainee, financial consultant, financial analyst.
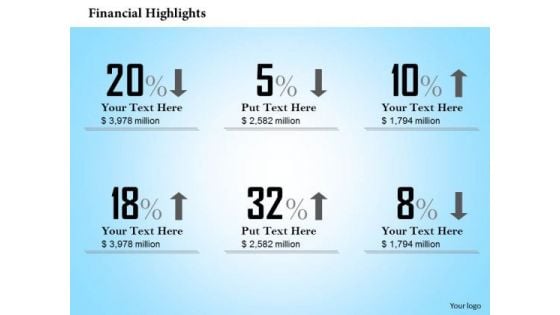
Marketing Diagram Financial Result Analysis Diagram Sales Diagram
Establish Your Dominion With Our Marketing Diagram Financial Result Analysis Diagram Sales Diagram Powerpoint Templates. Rule The Stage With Your Thoughts. Your Ideas Demand Attention. Our Marketing Diagram Financial Result Analysis Diagram Sales Diagram Powerpoint Templates Will Get It Done.
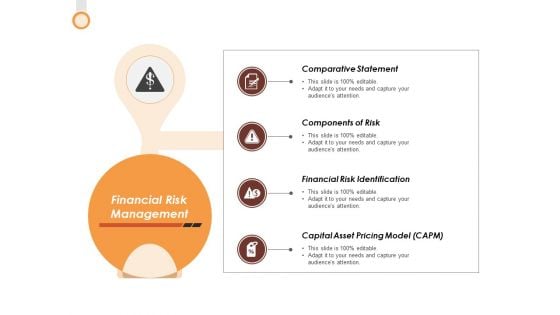
Financial Risk Management Ppt PowerPoint Presentation Gallery Format
This is a financial risk management ppt powerpoint presentation gallery format. This is a four stage process. The stages in this process are icons, management, analysis, strategy, marketing.
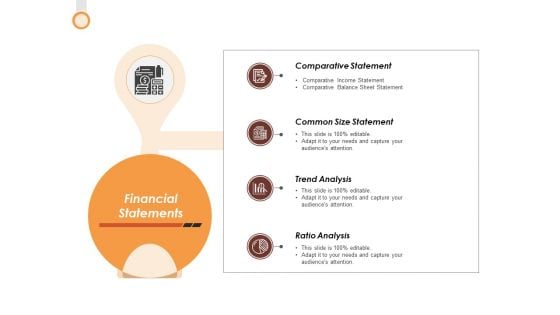
Financial Statements Ppt PowerPoint Presentation Pictures Layout Ideas
This is a financial statements ppt powerpoint presentation pictures layout ideas. This is a four stage process. The stages in this process are icons, management, analysis, strategy, marketing.
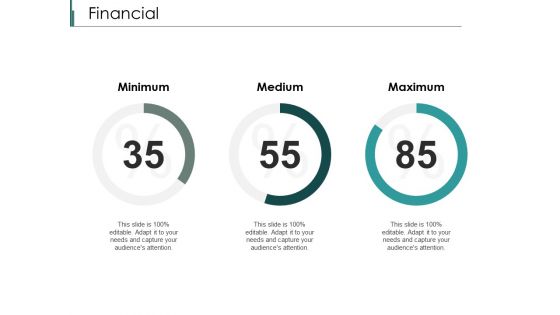
Financial Minimum Medium Ppt PowerPoint Presentation Summary Themes
This is a financial minimum medium ppt powerpoint presentation summary themes. This is a three stage process. The stages in this process are financial, maximum, medium, minimum, marketing.
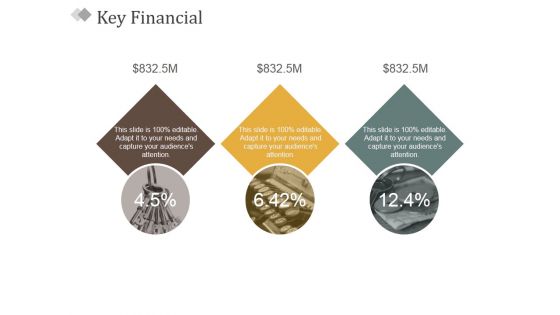
Key Financial Ppt PowerPoint Presentation Inspiration Design Ideas
This is a key financial ppt powerpoint presentation inspiration design ideas. This is a three stage process. The stages in this process are financial, business, sales, marketing, success.
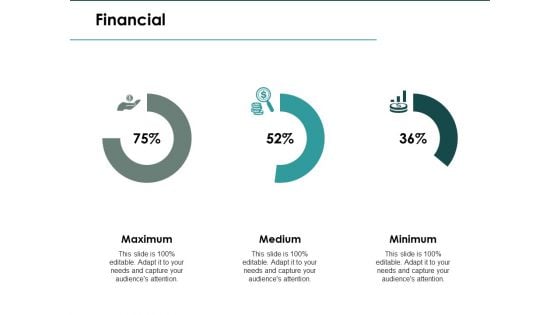
Financial Maximum Ppt PowerPoint Presentation Model Master Slide
This is a financial maximum ppt powerpoint presentation model master slide. This is a three stage process. The stages in this process are financial, maximum, medium, minimum, marketing.

Financial Percentage Ppt PowerPoint Presentation Model Design Templates
This is a financial percentage ppt powerpoint presentation model design templates. This is a three stage process. The stages in this process are financial, minimum, maximum, marketing, strategy.
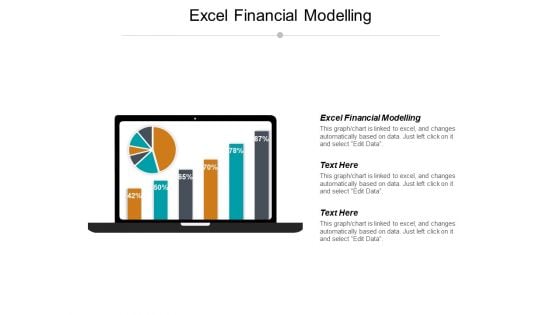
Excel Financial Modelling Ppt PowerPoint Presentation Show Graphic Tips Cpb
This is a excel financial modelling ppt powerpoint presentation show graphic tips cpb. This is a three stage process. The stages in this process are excel financial modelling.
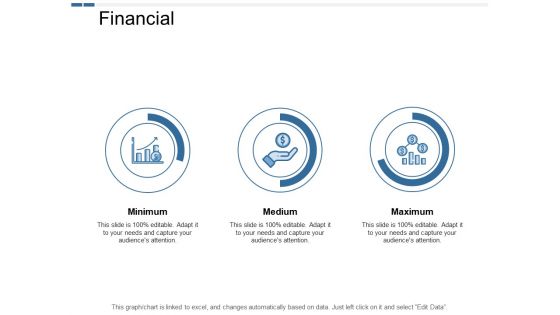
Financial Management Ppt PowerPoint Presentation Slides Graphic Images
This is a financial management ppt powerpoint presentation slides graphic images. This is a three stage process. The stages in this process are financial, management, marketing, planning, strategy.
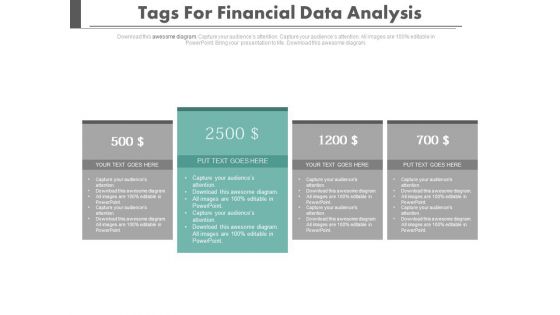
Four Tags For Financial Review And Analysis Powerpoint Slides
This PowerPoint template has been designed with four tags and financial values. This PowerPoint template helps to exhibit financial review and analysis. Use this diagram slide to build an exclusive presentation.
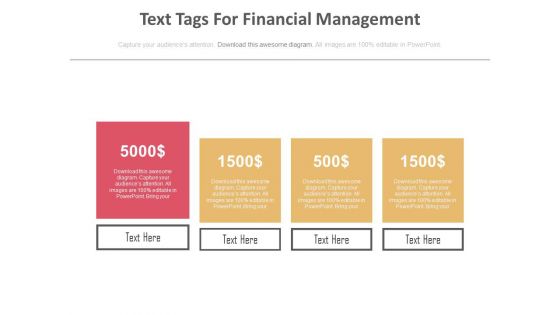
Four Text Tags For Financial Management Powerpoint Slides
Our professionally designed business diagram is as an effective tool for communicating concept of financial management. It contains graphics of four text tags. Above slide is also suitable to display financial planning and strategy.
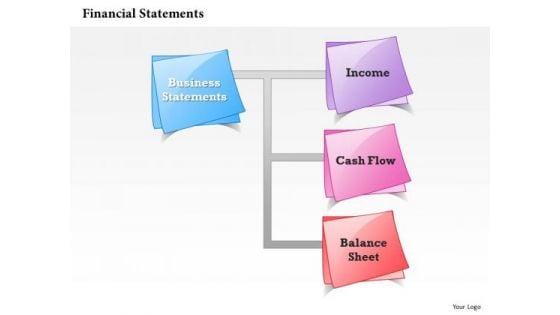
Consulting Diagram Financial Statements Of Cash Flow Strategy Diagram
Document The Process On Our Consulting Diagram Financial Statements Of Cash Flow Strategy Diagram Powerpoint Templates. Make A Record Of Every Detail.
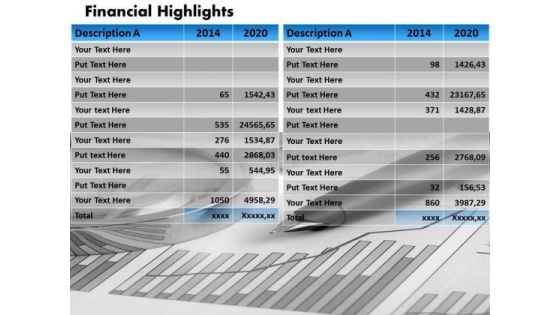
Mba Models And Frameworks Business Financial Chart Diagram Sales Diagram
Open Up Doors That Lead To Success. Our MBA Models And Frameworks Business Financial Chart Diagram Sales Diagram Powerpoint Templates Provide The Handles. Opportunity Will Come Knocking At Your Door. Welcome It With Our MBA Models And Frameworks Business Financial Chart Diagram Sales Diagram Powerpoint Templates.
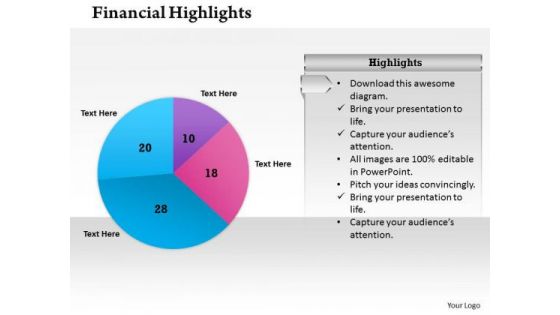
Sales Diagram Pie Chart For Financial Result Business Diagram
Knock On The Door To Success With Our Sales Diagram Pie Chart For Financial Result Business Diagram Powerpoint Templates. Be Assured Of Gaining Entry. Give Them A Dose Of Your Ability. It Will Go Down Well With Our Sales Diagram Pie Chart For Financial Result Business Diagram Powerpoint Templates.
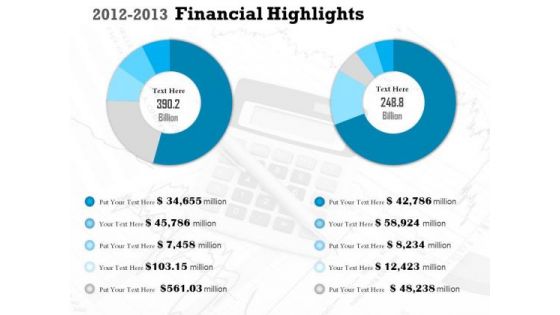
Mba Models And Frameworks 2012 2013 Financial Highlights Consulting Diagram
Get Out Of The Dock With Our MBA Models And Frameworks 2012 2013 Financial Highlights Consulting Diagram Powerpoint Templates. Your Mind Will Be Set Free.
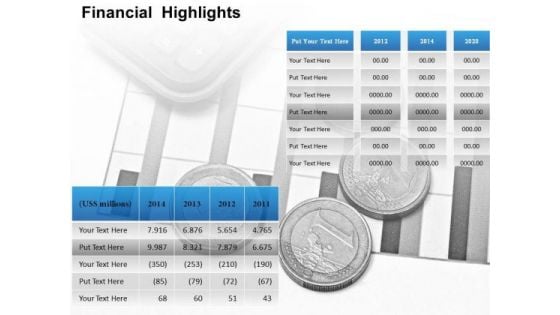
Business Cycle Diagram Financial Presentation Diagram Marketing Diagram
Get Out Of The Dock With Our Business Cycle Diagram Financial Presentation Diagram Marketing Diagram Powerpoint Templates. Your Mind Will Be Set Free. Play The Doctor With Our Business Cycle Diagram Financial Presentation Diagram Marketing Diagram Powerpoint Templates. Control Operations With Your Ideas.
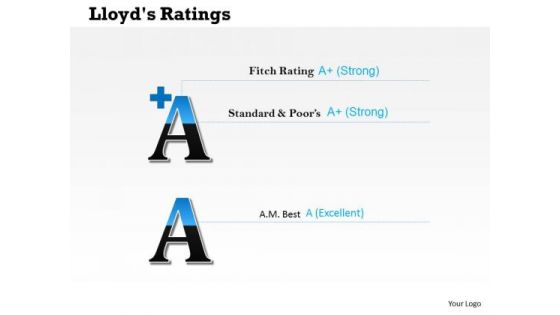
Business Cycle Diagram Financial Result Ratings Diagram Strategy Diagram
Document Your Views On Our Business Cycle Diagram Financial Result Ratings Diagram Strategy Diagram Powerpoint Templates. They Will Create A Strong Impression. Plan Your Documentary Shot By Shot. Break Them Down On Our Business Cycle Diagram Financial Result Ratings Diagram Strategy Diagram Powerpoint Templates.
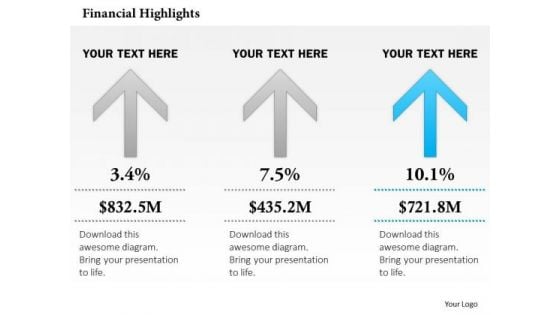
Marketing Diagram Three Financial Result Arrows Diagram Sales Diagram
Your Listeners Will Never Doodle. Our Marketing Diagram Three Financial Result Arrows Diagram Sales Diagram Powerpoint Templates Will Hold Their Concentration. Do The One Thing With Your Thoughts. Uphold Custom With Our Marketing Diagram Three Financial Result Arrows Diagram Sales Diagram Powerpoint Templates.
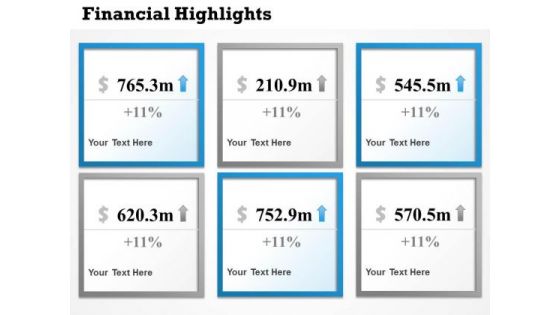
Strategy Diagram 6 Staged Financial Highlight Diagram Business Cycle Diagram
Double Your Chances With Our Strategy Diagram 6 Staged Financial Highlight Diagram Business Cycle Diagram Powerpoint Templates. The Value Of Your Thoughts Will Increase Two-Fold. Charm The Audience With Your Thoughts. Add Our Strategy Diagram 6 Staged Financial Highlight Diagram Business Cycle Diagram Powerpoint Templates And They Will Be Dotty For You.

Business Framework Model Financial Report Analysis Diagram Marketing Diagram
Put In A Dollop Of Our Business Framework Model Financial Report Analysis Diagram Marketing Diagram Powerpoint Templates. Give Your Thoughts A Distinctive Flavor. Create Your Domain With Our Business Framework Model Financial Report Analysis Diagram Marketing Diagram Powerpoint Templates. Rule Minds With Your Thoughts.
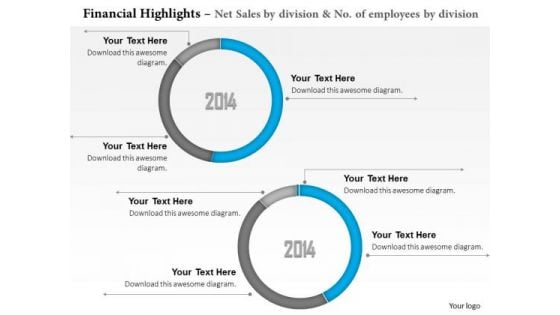
Business Framework Model Net Sales Financial Diagram Business Cycle Diagram
Get The Domestics Right With Our Business Framework Model Net Sales Financial Diagram Business Cycle Diagram Powerpoint Templates. Create The Base For Thoughts To Grow. Do Away With Dogmatic Approaches. Establish The Value Of Reason With Our Business Framework Model Net Sales Financial Diagram Business Cycle Diagram Powerpoint Templates.
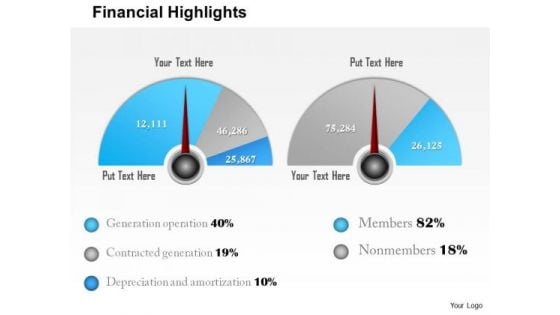
Marketing Diagram Financial Range Definer Diagram Business Framework Model
Dominate Proceedings With Your Ideas. Our Marketing Diagram Financial Range Definer Diagram Business Framework Model Powerpoint Templates Will Empower Your Thoughts. Our Marketing Diagram Financial Range Definer Diagram Business Framework Model Powerpoint Templates Have A Domino Effect. Your Ideas Will Generate One After Another.
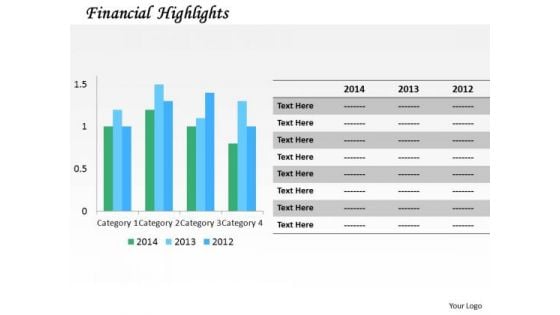
Consulting Diagram Annual Financial Growth Graph Strategic Management
Analyze Ailments On Our Consulting Diagram Annual Financial Growth Graph Strategic Management Powerpoint Templates. Bring Out The Thinking Doctor In You. Dock Your Thoughts With Our Consulting Diagram Annual Financial Growth Graph Strategic Management Powerpoint Templates. They Will Launch Them Into Orbit.
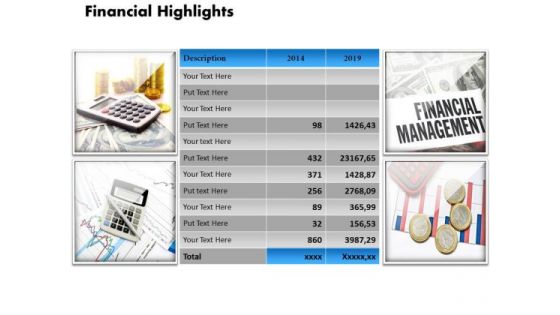
Business Diagram Design For Financial Presentation Mba Models And Frameworks
Analyze Ailments On Our Business Diagram Design For Financial Presentation MBA Models And Frameworks Powerpoint Templates. Bring Out The Thinking Doctor In You. Dock Your Thoughts With Our Business Diagram Design For Financial Presentation MBA Models And Frameworks Powerpoint Templates. They Will Launch Them Into Orbit.
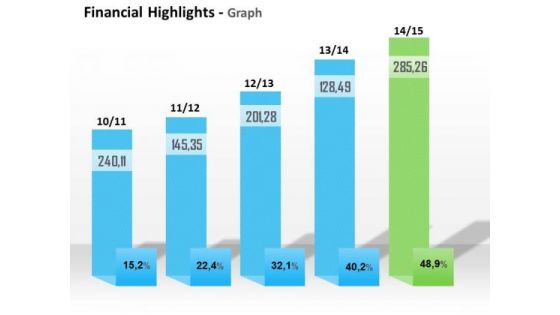
Business Cycle Diagram Annual Growth Of Financial Result Strategic Management
Analyze Ailments On Our Business Cycle Diagram Annual Growth Of Financial Result Strategic Management Powerpoint Templates. Bring Out The Thinking Doctor In You. Dock Your Thoughts With Our Business Cycle Diagram Annual Growth Of Financial Result Strategic Management Powerpoint Templates. They Will Launch Them Into Orbit.

Clustered Bar Financial Chart Ppt PowerPoint Presentation File Design Ideas
This is a clustered bar financial chart ppt powerpoint presentation file design ideas. This is a three stage process. The stages in this process are column chart, financial, business, marketing, planning, strategy.
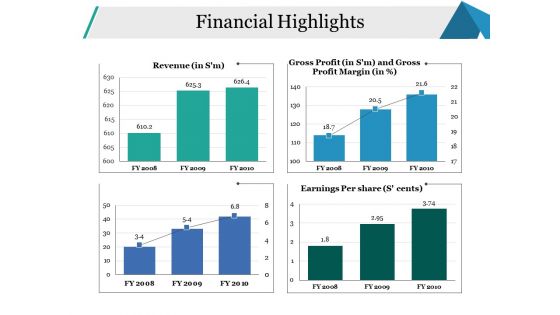
Financial Highlights Ppt PowerPoint Presentation File Background Designs
This is a financial highlights ppt powerpoint presentation file background designs. This is a four stage process. The stages in this process are revenue, earnings per share, financial, business, marketing.
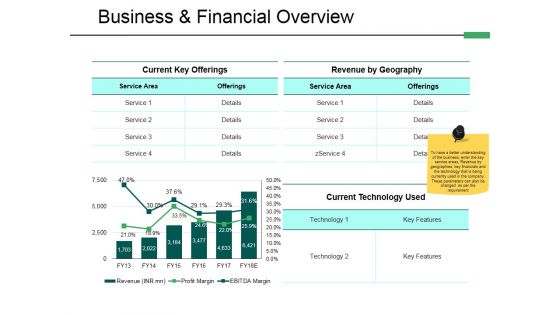
Business And Financial Overview Ppt PowerPoint Presentation Pictures Visuals
This is a business and financial overview ppt powerpoint presentation pictures visuals. This is a two stage process. The stages in this process are current key offerings, revenue by geography, current technology used, business financial overview.
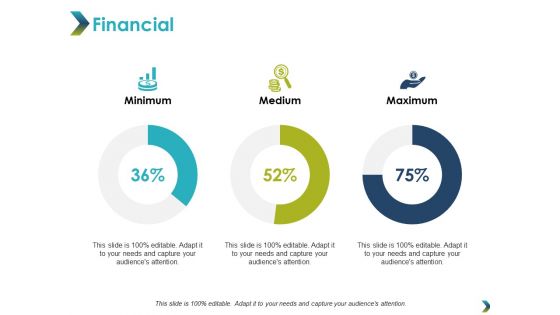
Financial Minimum Maximum Ppt PowerPoint Presentation Infographic Template Picture
This is a financial minimum maximum ppt powerpoint presentation infographic template picture. This is a three stage process. The stages in this process are financial, minimum, maximum, marketing, strategy.
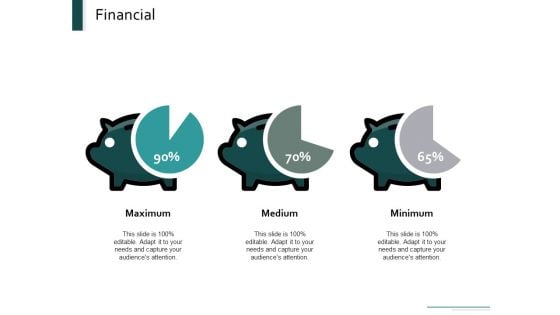
Financial Maximum Medium Minimum Ppt Powerpoint Presentation Portfolio Master Slide
This is a financial maximum medium minimum ppt powerpoint presentation portfolio master slide.This is a three stage process. The stages in this process are financial, maximum, medium, minimum, management.
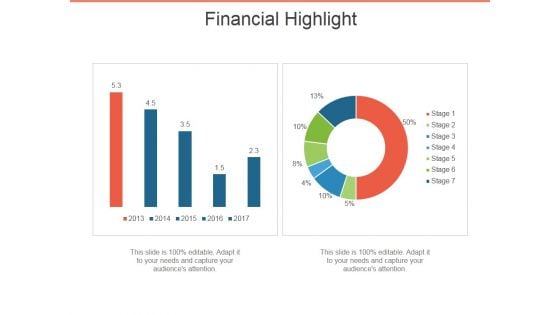
Financial Highlight Template 1 Ppt PowerPoint Presentation Ideas Themes
This is a financial highlight template 1 ppt powerpoint presentation ideas themes. This is a two stage process. The stages in this process are financial, highlight, business, bar graph, marketing.

 Home
Home