Financial Icons
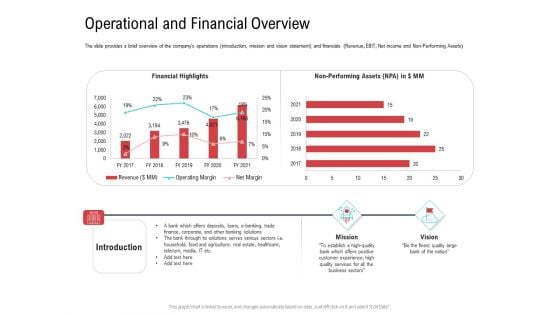
Investor Pitch Deck Collect Funding Spot Market Operational And Financial Overview Sample PDF
The slide provides a brief overview of the companys operations introduction, mission and vision statement and financials Revenue, EBIT, Net income and Non Performing Assets. Deliver and pitch your topic in the best possible manner with this investor pitch deck collect funding spot market operational and financial overview sample pdf. Use them to share invaluable insights on mission, vision, introduction, financial highlights, non performing assets and impress your audience. This template can be altered and modified as per your expectations. So, grab it now.
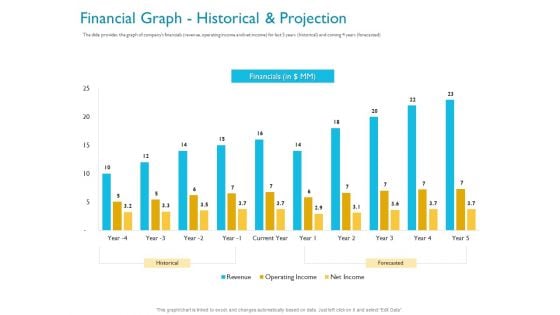
Investor Funding Deck For Hybrid Financing Financial Graph Historical And Projection Ppt Layouts Slides PDF
The slide provides the graph of companys financials revenue, operating income and net income for last 5 years historical and coming 4 years forecasted. Deliver and pitch your topic in the best possible manner with this investor funding deck for hybrid financing financial graph historical and projection ppt layouts slides pdf. Use them to share invaluable insights on historical, forecasted, net income, operating income, financial and impress your audience. This template can be altered and modified as per your expectations. So, grab it now.
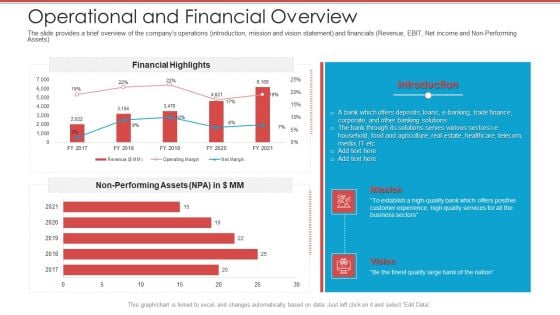
Cash Market Investor Deck Operational And Financial Overview Ppt Slides Format Ideas PDF
The slide provides a brief overview of the companys operations introduction, mission and vision statement and financials Revenue, EBIT, Net income and Non-Performing Assets. Deliver and pitch your topic in the best possible manner with this cash market investor deck operational and financial overview ppt slides format ideas pdf. Use them to share invaluable insights on financial highlights, performing assets, mission, vision, high quality services and impress your audience. This template can be altered and modified as per your expectations. So, grab it now.
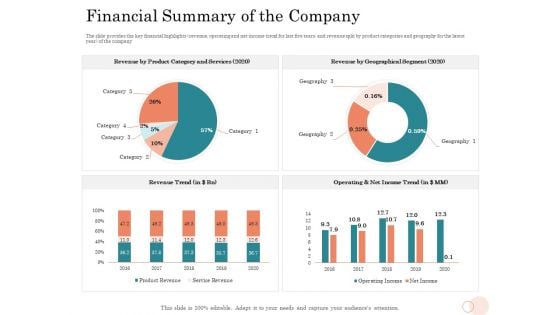
Option Pool Funding Pitch Deck Financial Summary Of The Company Ppt File Themes PDF
The slide provides the key financial highlights revenue, operating and net income trend for last five tears and revenue split by product categories and geography for the latest year of the company. Deliver and pitch your topic in the best possible manner with this option pool funding pitch deck financial summary of the company ppt file themes pdf. Use them to share invaluable insights on revenue trend, operating and net income trend, revenue by geographical segment, revenue by product and services and impress your audience. This template can be altered and modified as per your expectations. So, grab it now.
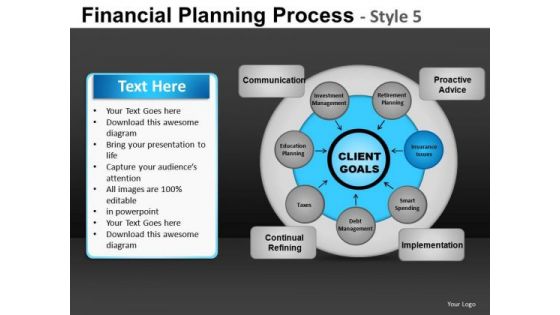
Components Financial Planning Process 5 PowerPoint Slides And Ppt Diagram Templates
Components Financial Planning Process 5 PowerPoint Slides And PPT Diagram Templates-These high quality powerpoint pre-designed slides and powerpoint templates have been carefully created by our professional team to help you impress your audience. All slides have been created and are 100% editable in powerpoint. Each and every property of any graphic - color, size, orientation, shading, outline etc. can be modified to help you build an effective powerpoint presentation. Any text can be entered at any point in the powerpoint template or slide. Simply DOWNLOAD, TYPE and PRESENT! Chart your journey with our Components Financial Planning Process 5 PowerPoint Slides And Ppt Diagram Templates. Download without worries with our money back guaranteee.
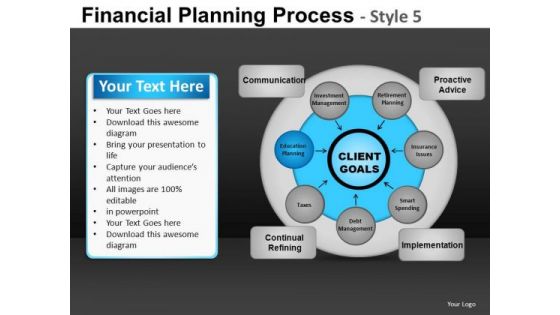
Corporate Financial Planning Process 5 PowerPoint Slides And Ppt Diagram Templates
Corporate Financial Planning Process 5 PowerPoint Slides And PPT Diagram Templates-These high quality, editable pre-designed powerpoint slides have been carefully created by our professional team to help you impress your audience. Each graphic in every slide is vector based and is 100% editable in powerpoint. Each and every property of any slide - color, size, shading etc can be modified to build an effective powerpoint presentation. Use these slides to convey complex business concepts in a simplified manner. Any text can be entered at any point in the powerpoint slide. Simply DOWNLOAD, TYPE and PRESENT! Make everyday special with our Corporate Financial Planning Process 5 PowerPoint Slides And Ppt Diagram Templates. Ring in the changes with our Corporate Financial Planning Process 5 PowerPoint Slides And Ppt Diagram Templates.
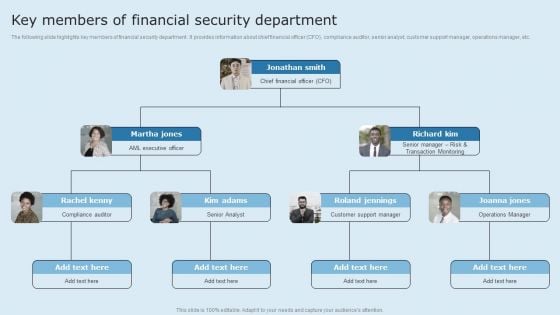
Actual Time Transaction Monitoring Software And Strategies Key Members Of Financial Security Department Diagrams PDF
The following slide highlights key members of financial security department. It provides information about chief financial officer CFO, compliance auditor, senior analyst, customer support manager, operations manager, etc. Coming up with a presentation necessitates that the majority of the effort goes into the content and the message you intend to convey. The visuals of a PowerPoint presentation can only be effective if it supplements and supports the story that is being told. Keeping this in mind our experts created Actual Time Transaction Monitoring Software And Strategies Key Members Of Financial Security Department Diagrams PDF to reduce the time that goes into designing the presentation. This way, you can concentrate on the message while our designers take care of providing you with the right template for the situation.
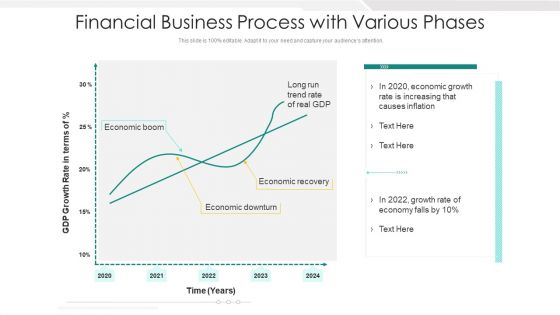
Financial Business Process With Various Phases Ppt PowerPoint Presentation File Background Image PDF
Presenting our well structured financial business process with various phases ppt powerpoint presentation file background image pdf. The topics discussed in this slide are economic, rate, growth. This is an instantly available PowerPoint presentation that can be edited conveniently. Download it right away and captivate your audience.
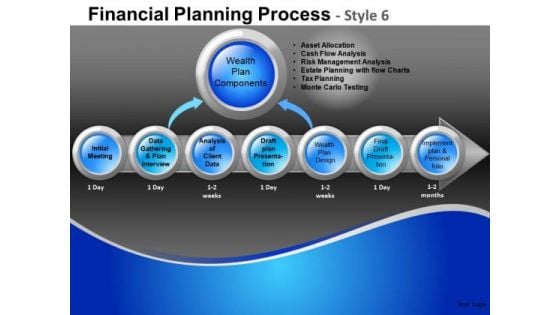
Components Financial Planning Process 6 PowerPoint Slides And Ppt Diagram Templates
Components Financial Planning Process 6 PowerPoint Slides And PPT Diagram Templates-These high quality powerpoint pre-designed slides and powerpoint templates have been carefully created by our professional team to help you impress your audience. All slides have been created and are 100% editable in powerpoint. Each and every property of any graphic - color, size, orientation, shading, outline etc. can be modified to help you build an effective powerpoint presentation. Any text can be entered at any point in the powerpoint template or slide. Simply DOWNLOAD, TYPE and PRESENT! Our Components Financial Planning Process 6 PowerPoint Slides And Ppt Diagram Templates are evidently advantageous. The balance will tilt in your favour.
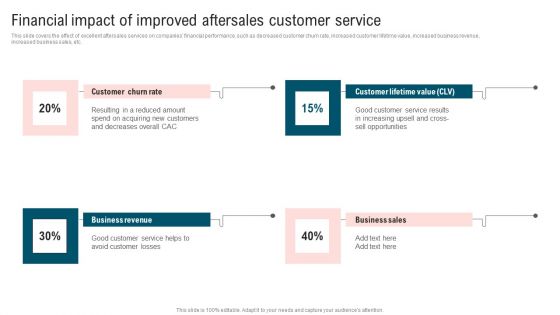
Ultimate Guide To Improve Customer Support And Services Financial Impact Of Improved Aftersales Themes PDF
This slide covers the effect of excellent aftersales services on companies financial performance, such as decreased customer churn rate, increased customer lifetime value, increased business revenue, increased business sales, etc. If you are looking for a format to display your unique thoughts, then the professionally designed Ultimate Guide To Improve Customer Support And Services Financial Impact Of Improved Aftersales Themes PDF is the one for you. You can use it as a Google Slides template or a PowerPoint template. Incorporate impressive visuals, symbols, images, and other charts. Modify or reorganize the text boxes as you desire. Experiment with shade schemes and font pairings. Alter, share or cooperate with other people on your work. Download Ultimate Guide To Improve Customer Support And Services Financial Impact Of Improved Aftersales Themes PDF and find out how to give a successful presentation. Present a perfect display to your team and make your presentation unforgettable.
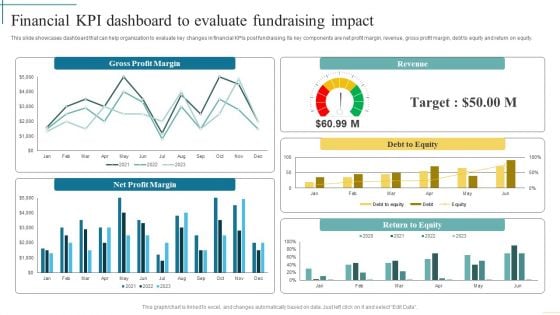
Financial Kpi Dashboard To Evaluate Fundraising Impact Developing Fundraising Techniques Diagrams PDF
This slide showcases dashboard that can help organization to evaluate key changes in financial KPIs post fundraising. Its key components are net profit margin, revenue, gross profit margin, debt to equity and return on equity. From laying roadmaps to briefing everything in detail, our templates are perfect for you. You can set the stage with your presentation slides. All you have to do is download these easy-to-edit and customizable templates. Financial Kpi Dashboard To Evaluate Fundraising Impact Developing Fundraising Techniques Diagrams PDF will help you deliver an outstanding performance that everyone would remember and praise you for. Do download this presentation today.
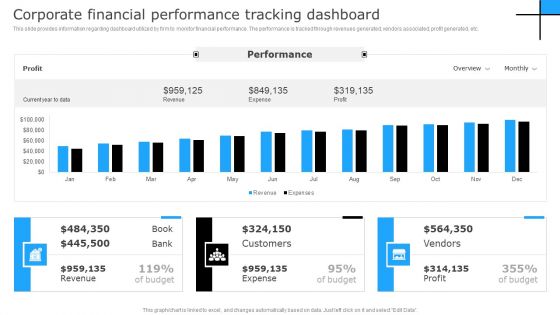
Successful Corporate Technique Enhancing Firms Performance Corporate Financial Performance Diagrams PDF
This slide provides information regarding dashboard utilized by firm to monitor financial performance. The performance is tracked through revenues generated, vendors associated, profit generated, etc. Find a pre designed and impeccable Successful Corporate Technique Enhancing Firms Performance Corporate Financial Performance Diagrams PDF. The templates can ace your presentation without additional effort. You can download these easy to edit presentation templates to make your presentation stand out from others. So, what are you waiting for Download the template from Slidegeeks today and give a unique touch to your presentation.
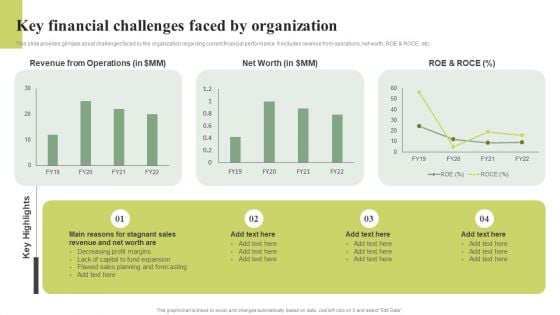
Key Financial Challenges Faced By Organization Effective Planning For Monetary Formats PDF
This slide provides glimpse about challenges faced by the organization regarding current financial performance. It includes revenue from operations, net worth, ROE ROCE, etc.Do you have an important presentation coming up Are you looking for something that will make your presentation stand out from the rest Look no further than Key Financial Challenges Faced By Organization Effective Planning For Monetary Formats PDF. With our professional designs, you can trust that your presentation will pop and make delivering it a smooth process. And with Slidegeeks, you can trust that your presentation will be unique and memorable. So why wait Grab Key Financial Challenges Faced By Organization Effective Planning For Monetary Formats PDF today and make your presentation stand out from the rest.
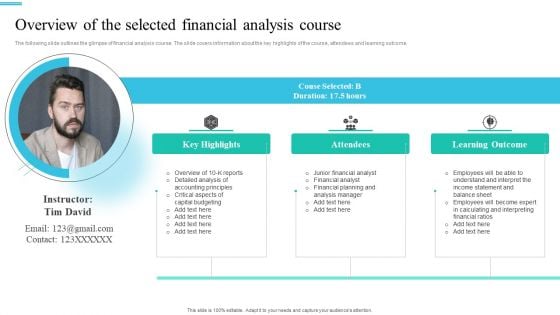
Monetary Planning And Evaluation Guide Overview Of The Selected Financial Analysis Course Ppt Inspiration Themes PDF
The following slide outlines the glimpse of financial analysis course. The slide covers information about the key highlights of the course, attendees and learning outcome. Explore a selection of the finest Monetary Planning And Evaluation Guide Overview Of The Selected Financial Analysis Course Ppt Inspiration Themes PDF here. With a plethora of professionally designed and pre-made slide templates, you can quickly and easily find the right one for your upcoming presentation. You can use our Monetary Planning And Evaluation Guide Overview Of The Selected Financial Analysis Course Ppt Inspiration Themes PDF to effectively convey your message to a wider audience. Slidegeeks has done a lot of research before preparing these presentation templates. The content can be personalized and the slides are highly editable. Grab templates today from Slidegeeks.
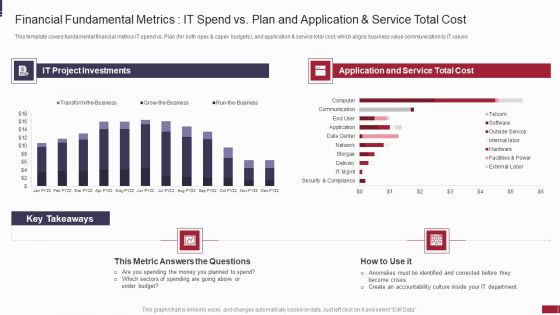
Guidelines For Exhibiting Business Value Of Information And Technology Financial Fundamental Metrics Diagrams PDF
This template covers fundamental financial metrics IT spend vs Plan for both opex and capex budgets, and application and service total cost, which aligns business value communication to IT values. Deliver and pitch your topic in the best possible manner with this guidelines for exhibiting business value of information and technology financial fundamental metrics diagrams pdf. Use them to share invaluable insights on metric, budget, accountability, planned and impress your audience. This template can be altered and modified as per your expectations. So, grab it now.
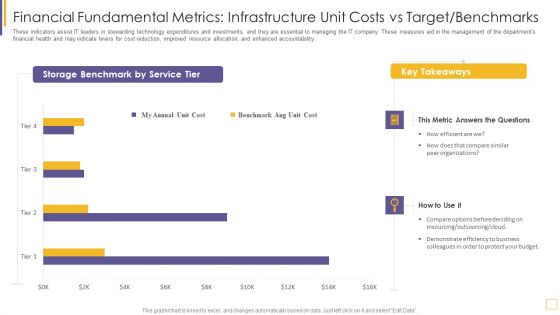
IT Value Story Significant To Corporate Leadership Financial Fundamental Metrics Diagrams PDF
These indicators assist IT leaders in stewarding technology expenditures and investments, and they are essential to managing the IT company. These measures aid in the management of the departments financial health and may indicate levers for cost reduction, improved resource allocation, and enhanced accountability. Deliver and pitch your topic in the best possible manner with this it value story significant to corporate leadership financial fundamental metrics diagrams pdf. Use them to share invaluable insights on organizations, budget, metric, cost and impress your audience. This template can be altered and modified as per your expectations. So, grab it now.
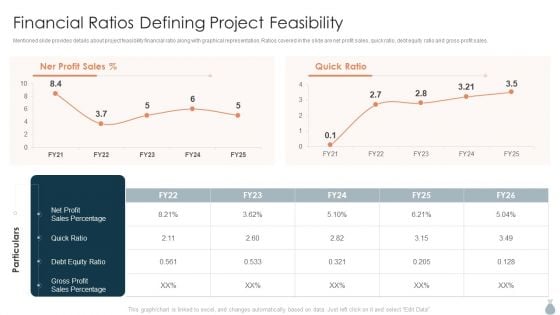
Real Estate Development Project Financing Financial Ratios Defining Project Feasibility Themes PDF
Mentioned slide provides details about project feasibility financial ratio along with graphical representation. Ratios covered in the slide are net profit sales, quick ratio, debt equity ratio and gross profit sales.Deliver and pitch your topic in the best possible manner with this Real Estate Development Project Financing Financial Ratios Defining Project Feasibility Themes PDF. Use them to share invaluable insights on Debt Equity, Sales Percentage, Gross Profit and impress your audience. This template can be altered and modified as per your expectations. So, grab it now.
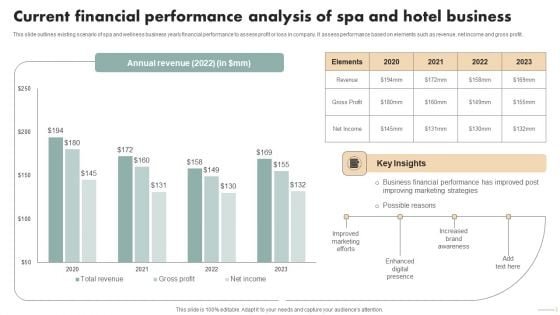
Spa Marketing Strategy Boost Reservations Enhance Revenue Current Financial Performance Analysis Mockup PDF
This slide outlines existing scenario of spa and wellness business yearly financial performance to assess profit or loss in company. It assess performance based on elements such as revenue, net income and gross profit. Do you have to make sure that everyone on your team knows about any specific topic I yes, then you should give Spa Marketing Strategy Boost Reservations Enhance Revenue Current Financial Performance Analysis Mockup PDF a try. Our experts have put a lot of knowledge and effort into creating this impeccable Spa Marketing Strategy Boost Reservations Enhance Revenue Current Financial Performance Analysis Mockup PDF. You can use this template for your upcoming presentations, as the slides are perfect to represent even the tiniest detail. You can download these templates from the Slidegeeks website and these are easy to edit. So grab these today.
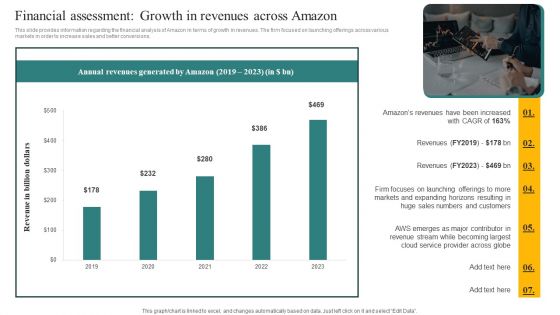
Financial Assessment Growth In Revenues Across Amazon Ppt Slides Graphics Example PDF
This slide provides information regarding the financial analysis of Amazon in terms of growth in revenues. The firm focused on launching offerings across various markets in order to increase sales and better conversions. Create an editable Financial Assessment Growth In Revenues Across Amazon Ppt Slides Graphics Example PDF that communicates your idea and engages your audience. Whether you are presenting a business or an educational presentation, pre designed presentation templates help save time. Financial Assessment Growth In Revenues Across Amazon Ppt Slides Graphics Example PDF is highly customizable and very easy to edit, covering many different styles from creative to business presentations. Slidegeeks has creative team members who have crafted amazing templates. So, go and get them without any delay.
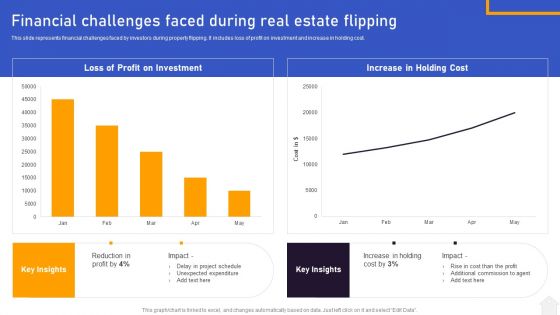
Strategies For Flipping Houses For Maximum Revenue Financial Challenges Faced During Real Estate Flipping Designs PDF
This slide represents financial challenges faced by investors during property flipping. It includes loss of profit on investment and increase in holding cost. Formulating a presentation can take up a lot of effort and time, so the content and message should always be the primary focus. The visuals of the PowerPoint can enhance the presenters message, so our Strategies For Flipping Houses For Maximum Revenue Financial Challenges Faced During Real Estate Flipping Designs PDF was created to help save time. Instead of worrying about the design, the presenter can concentrate on the message while our designers work on creating the ideal templates for whatever situation is needed. Slidegeeks has experts for everything from amazing designs to valuable content, we have put everything into Strategies For Flipping Houses For Maximum Revenue Financial Challenges Faced During Real Estate Flipping Designs PDF
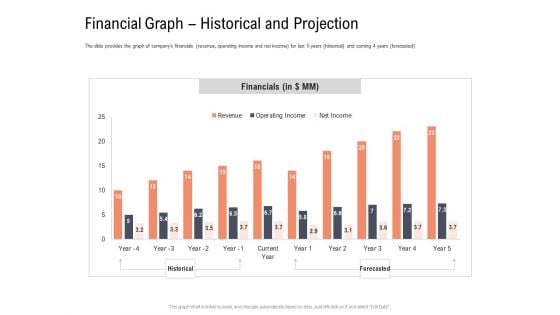
Investor Pitch Deck To Collect Capital From Subordinated Loan Financial Graph Historical And Projection Introduction PDF
The slide provides the graph of companys financials revenue, operating income and net income for last 5 years historical and coming 4 years forecasted. Deliver an awe-inspiring pitch with this creative investor pitch deck to collect capital from subordinated loan financial graph historical and projection introduction pdf bundle. Topics like financials, net income, operating income, revenue, historical, forecasted can be discussed with this completely editable template. It is available for immediate download depending on the needs and requirements of the user.
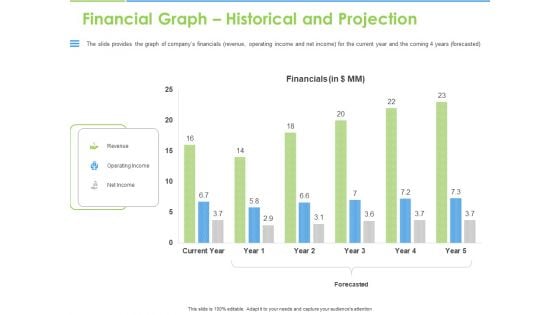
Convertible Bonds Pitch Deck For Increasing Capitals Financial Graph Historical And Projection Elements PDF
The slide provides the graph of companys financials revenue, operating income and net income for the current year and the coming 4 years forecasted. Deliver an awe-inspiring pitch with this creative convertible bonds pitch deck for increasing capitals financial graph historical and projection elements pdf bundle. Topics like revenue, operating income, net income, forecasted, financials, current year can be discussed with this completely editable template. It is available for immediate download depending on the needs and requirements of the user.
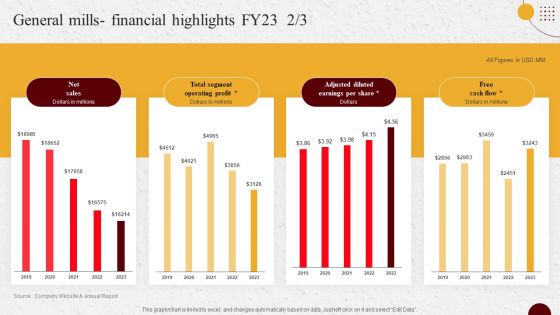
Industry Report Of Packaged Food Products Part 2 General Mills Financial Highlights Fy23 Diagrams PDF
Do you have to make sure that everyone on your team knows about any specific topic I yes, then you should give Industry Report Of Packaged Food Products Part 2 General Mills Financial Highlights Fy23 Diagrams PDF a try. Our experts have put a lot of knowledge and effort into creating this impeccable Industry Report Of Packaged Food Products Part 2 General Mills Financial Highlights Fy23 Diagrams PDF. You can use this template for your upcoming presentations, as the slides are perfect to represent even the tiniest detail. You can download these templates from the Slidegeeks website and these are easy to edit. So grab these today.
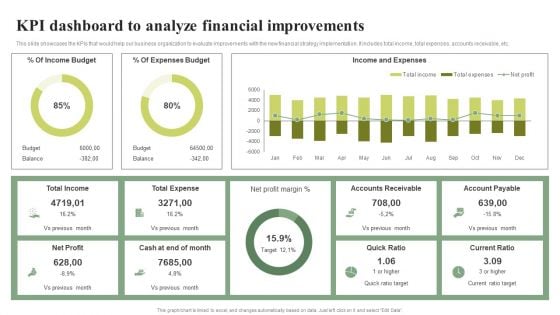
KPI Dashboard To Analyze Financial Improvements Effective Planning For Monetary Portrait PDF
This slide showcases the KPIs that would help our business organization to evaluate improvements with the new financial strategy implementation. It includes total income, total expenses, accounts receivable, etc.Find highly impressive KPI Dashboard To Analyze Financial Improvements Effective Planning For Monetary Portrait PDF on Slidegeeks to deliver a meaningful presentation. You can save an ample amount of time using these presentation templates. No need to worry to prepare everything from scratch because Slidegeeks experts have already done a huge research and work for you. You need to download KPI Dashboard To Analyze Financial Improvements Effective Planning For Monetary Portrait PDF for your upcoming presentation. All the presentation templates are 100precent editable and you can change the color and personalize the content accordingly. Download now,
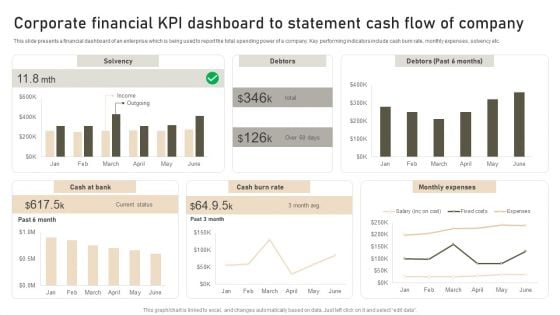
Corporate Financial KPI Dashboard To Statement Cash Flow Of Company Diagrams PDF
This slide presents a financial dashboard of an enterprise which is being used to report the total spending power of a company. Key performing indicators include cash burn rate, monthly expenses, solvency etc. Showcasing this set of slides titled Corporate Financial KPI Dashboard To Statement Cash Flow Of Company Diagrams PDF. The topics addressed in these templates are Solvency, Debtors, Monthly Expenses. All the content presented in this PPT design is completely editable. Download it and make adjustments in color, background, font etc. as per your unique business setting.
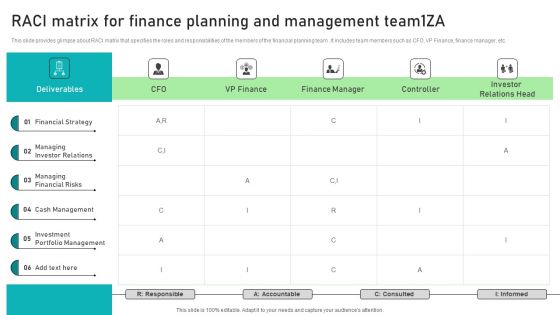
Adjusting Financial Strategies And Planning RACI Matrix For Finance Planning And Management Team1za Themes PDF
This slide provides glimpse about RACI matrix that specifies the roles and responsibilities of the members of the financial planning team . It includes team members such as CFO, VP Finance, finance manager, etc. Are you searching for a Adjusting Financial Strategies And Planning Quarterly Income Statement For Monitoring Business Profitability Infographics PDF that is uncluttered, straightforward, and original Its easy to edit, and you can change the colors to suit your personal or business branding. For a presentation that expresses how much effort you have put in, this template is ideal. With all of its features, including tables, diagrams, statistics, and lists, its perfect for a business plan presentation. Make your ideas more appealing with these professional slides. Download Adjusting Financial Strategies And Planning Quarterly Income Statement For Monitoring Business Profitability Infographics PDF from Slidegeeks today.
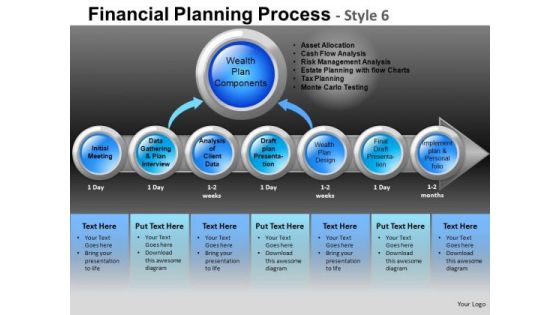
Editable Process Showing Financial Planning PowerPoint Slides And Ppt Diagram Templates
Editable Process Showing Financial Planning PowerPoint Slides And PPT Diagram Templates-These high quality powerpoint pre-designed slides and powerpoint templates have been carefully created by our professional team to help you impress your audience. All slides have been created and are 100% editable in powerpoint. Each and every property of any graphic - color, size, orientation, shading, outline etc. can be modified to help you build an effective powerpoint presentation. Any text can be entered at any point in the powerpoint template or slide. Simply DOWNLOAD, TYPE and PRESENT! With our Editable Process Showing Financial Planning PowerPoint Slides And Ppt Diagram Templates you won't bat an eyelid. Display your ability with equanimity.
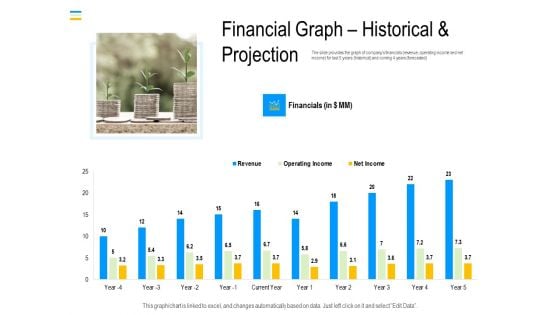
Mezzanine Debt Financing Pitch Deck Financial Graph Historical And Projection Demonstration PDF
The slide provides the graph of companys financials revenue, operating income and net income for last five years historical and coming four years forecasted. Deliver and pitch your topic in the best possible manner with this mezzanine debt financing pitch deck financial graph historical and projection demonstration pdf. Use them to share invaluable insights on financials, revenue, operating income and impress your audience. This template can be altered and modified as per your expectations. So, grab it now.
Business Diagram For Financial Result PowerPoint Templates Ppt Backgrounds For Slides 0613
Give them a dose of your ability. It will go down well with our Business Diagram For Financial Result PowerPoint Templates PPT Backgrounds For Slides 0613. Connect the dots with our Pie charts PowerPoint Templates. Watch the whole picture clearly emerge. Dot your thoughts with our Business PowerPoint Templates. Give your demeanour that Propah look. Make informative presentations with our Business Diagram For Financial Result PowerPoint Templates Ppt Backgrounds For Slides 0613. Dont waste time struggling with PowerPoint. Let us do it for you.
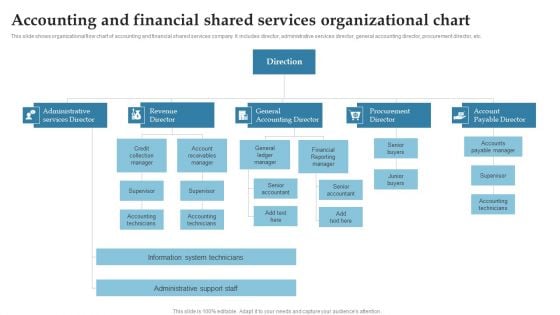
Accounting And Financial Shared Services Organizational Chart Ppt Styles Example PDF
This slide shows organizational flow chart of accounting and financial shared services company. It includes director, administrative services director, general accounting director, procurement director, etc. Persuade your audience using this Accounting And Financial Shared Services Organizational Chart Ppt Styles Example PDF. This PPT design covers seven stages, thus making it a great tool to use. It also caters to a variety of topics including Revenue Director, General Accounting Director, Procurement Director, Account Payable Director. Download this PPT design now to present a convincing pitch that not only emphasizes the topic but also showcases your presentation skills.
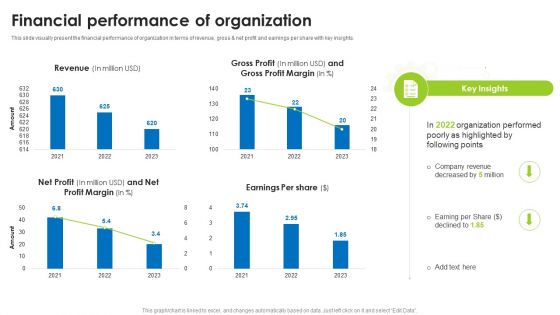
BI Technique For Data Informed Decisions Financial Performance Of Organization Guidelines PDF
This slide visually present the financial performance of organization in terms of revenue, gross and net profit and earnings per share with key insights. If you are looking for a format to display your unique thoughts, then the professionally designed BI Technique For Data Informed Decisions Financial Performance Of Organization Guidelines PDF is the one for you. You can use it as a Google Slides template or a PowerPoint template. Incorporate impressive visuals, symbols, images, and other charts. Modify or reorganize the text boxes as you desire. Experiment with shade schemes and font pairings. Alter, share or cooperate with other people on your work. Download BI Technique For Data Informed Decisions Financial Performance Of Organization Guidelines PDF and find out how to give a successful presentation. Present a perfect display to your team and make your presentation unforgettable.
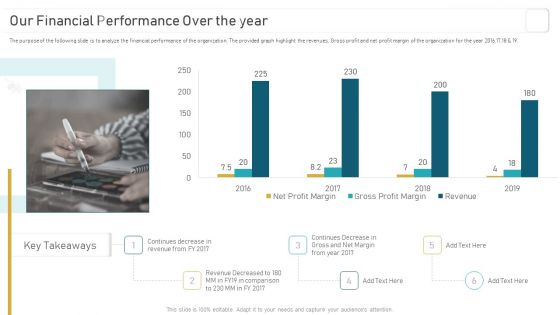
Deploying And Managing Recurring Our Financial Performance Over The Year Infographics PDF
The purpose of the following slide is to analyze the financial performance of the organization. The provided graph highlight the revenues, Gross profit and net profit margin of the organization for the year 2016,17,18 and 19. If you are looking for a format to display your unique thoughts, then the professionally designed Deploying And Managing Recurring Our Financial Performance Over The Year Infographics PDF is the one for you. You can use it as a Google Slides template or a PowerPoint template. Incorporate impressive visuals, symbols, images, and other charts. Modify or reorganize the text boxes as you desire. Experiment with shade schemes and font pairings. Alter, share or cooperate with other people on your work. Download Deploying And Managing Recurring Our Financial Performance Over The Year Infographics PDF and find out how to give a successful presentation. Present a perfect display to your team and make your presentation unforgettable.
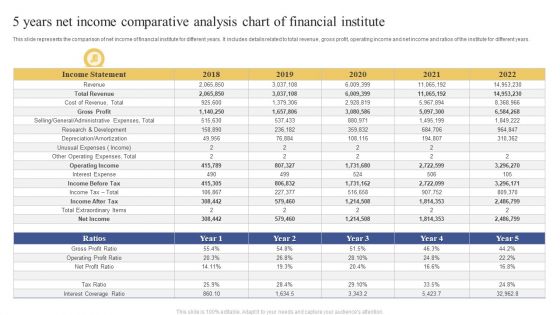
5 Years Net Income Comparative Analysis Chart Of Financial Institute Ppt Show Designs PDF
This slide represents the comparison of net income of financial institute for different years. It includes details related to total revenue, gross profit, operating income and net income and ratios of the institute for different years. Showcasing this set of slides titled 5 Years Net Income Comparative Analysis Chart Of Financial Institute Ppt Show Designs PDF. The topics addressed in these templates are Income Statement, 2018 To 2022, Ratios. All the content presented in this PPT design is completely editable. Download it and make adjustments in color, background, font etc. as per your unique business setting.
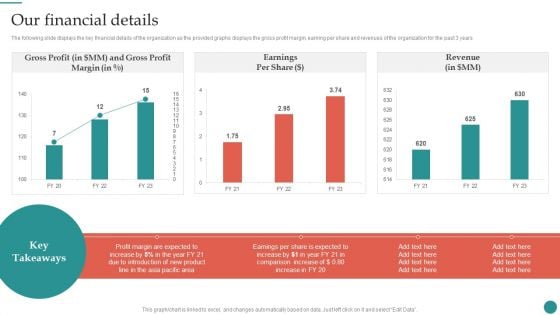
Our Financial Details Company Process Administration And Optimization Playbook Microsoft PDF
The following slide displays the key financial details of the organization as the provided graphs displays the gross profit margin, earning per share and revenues of the organization for the past 3 years.Crafting an eye-catching presentation has never been more straightforward. Let your presentation shine with this tasteful yet straightforward Our Financial Details Company Process Administration And Optimization Playbook Microsoft PDF template. It offers a minimalistic and classy look that is great for making a statement. The colors have been employed intelligently to add a bit of playfulness while still remaining professional. Construct the ideal Our Financial Details Company Process Administration And Optimization Playbook Microsoft PDF that effortlessly grabs the attention of your audience Begin now and be certain to wow your customers.
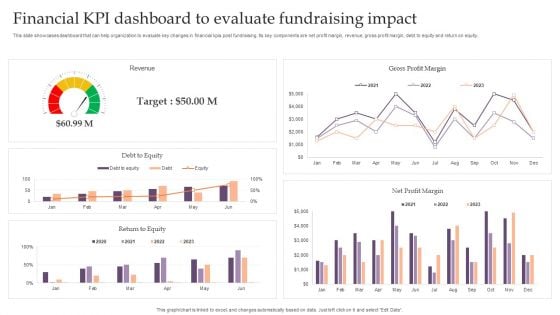
Assessing Debt And Equity Fundraising Alternatives For Business Growth Financial KPI Dashboard To Evaluate Infographics PDF
This slide showcases dashboard that can help organization to evaluate key changes in financial kpis post fundraising. Its key components are net profit margin, revenue, gross profit margin, debt to equity and return on equity. This Assessing Debt And Equity Fundraising Alternatives For Business Growth Financial KPI Dashboard To Evaluate Infographics PDF is perfect for any presentation, be it in front of clients or colleagues. It is a versatile and stylish solution for organizing your meetings. TheAssessing Debt And Equity Fundraising Alternatives For Business Growth Financial KPI Dashboard To Evaluate Infographics PDF features a modern design for your presentation meetings. The adjustable and customizable slides provide unlimited possibilities for acing up your presentation. Slidegeeks has done all the homework before launching the product for you. So, do not wait, grab the presentation templates today

Deployment Of Business Process Dashboard To Measure Business Financial Performance Microsoft PDF
This slide shows the dashboard to measure business financial performance which focuses on revenues, debt to equity, net profit margin, gross profit margin and return on equity. Do you have to make sure that everyone on your team knows about any specific topic I yes, then you should give Deployment Of Business Process Dashboard To Measure Business Financial Performance Microsoft PDF a try. Our experts have put a lot of knowledge and effort into creating this impeccable Deployment Of Business Process Dashboard To Measure Business Financial Performance Microsoft PDF. You can use this template for your upcoming presentations, as the slides are perfect to represent even the tiniest detail. You can download these templates from the Slidegeeks website and these are easy to edit. So grab these today.
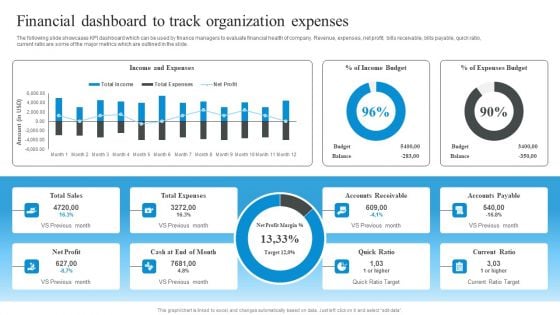
Market Evaluation Of IT Industry Financial Dashboard To Track Organization Expenses Clipart PDF
The following slide showcases KPI dashboard which can be used by finance managers to evaluate financial health of company. Revenue, expenses, net profit, bills receivable, bills payable, quick ratio, current ratio are some of the major metrics which are outlined in the slide. Do you have an important presentation coming up Are you looking for something that will make your presentation stand out from the rest Look no further than Market Evaluation Of IT Industry Financial Dashboard To Track Organization Expenses Clipart PDF. With our professional designs, you can trust that your presentation will pop and make delivering it a smooth process. And with Slidegeeks, you can trust that your presentation will be unique and memorable. So why wait Grab Market Evaluation Of IT Industry Financial Dashboard To Track Organization Expenses Clipart PDF today and make your presentation stand out from the rest.
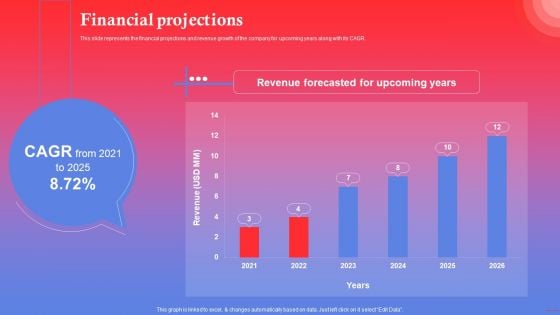
Rapping Platform Investor Funding Elevator Pitch Deck Financial Projections Inspiration PDF
This slide represents the financial performance of the company with the aid of graphical representation of revenue generated over the years. Find highly impressive Rapping Platform Investor Funding Elevator Pitch Deck Financial Projections Inspiration PDF on Slidegeeks to deliver a meaningful presentation. You can save an ample amount of time using these presentation templates. No need to worry to prepare everything from scratch because Slidegeeks experts have already done a huge research and work for you. You need to download Rapping Platform Investor Funding Elevator Pitch Deck Financial Projections Inspiration PDF for your upcoming presentation. All the presentation templates are 100 percent editable and you can change the color and personalize the content accordingly. Download now.
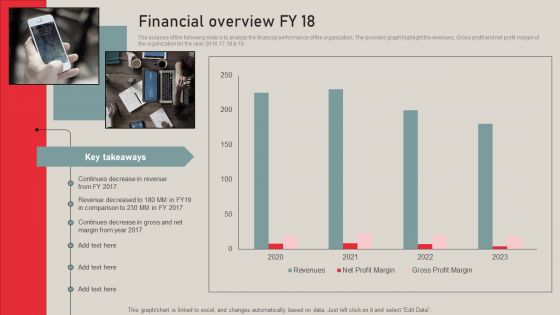
Individualized Pricing Approach For Managed Services Financial Overview FY 18 Structure PDF
The purpose of the following slide is to analyze the financial performance of the organization. The provided graph highlight the revenues, Gross profit and net profit margin of the organization for the year 2016,17,18 and 19. Create an editable Individualized Pricing Approach For Managed Services Financial Overview FY 18 Structure PDF that communicates your idea and engages your audience. Whether you are presenting a business or an educational presentation, pre designed presentation templates help save time. Individualized Pricing Approach For Managed Services Financial Overview FY 18 Structure PDF is highly customizable and very easy to edit, covering many different styles from creative to business presentations. Slidegeeks has creative team members who have crafted amazing templates. So, go and get them without any delay.
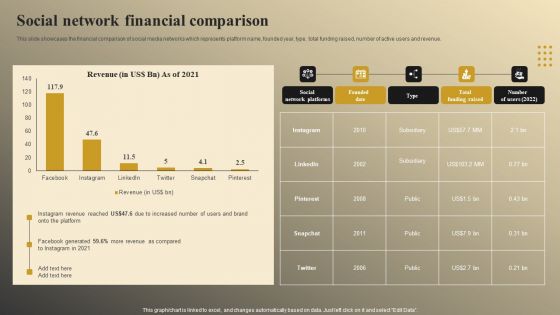
Online Video Model Company Profile Social Network Financial Comparison Formats PDF
This slide showcases the financial comparison of social media networks which represents platform name, founded year, type, total funding raised, number of active users and revenue. Formulating a presentation can take up a lot of effort and time, so the content and message should always be the primary focus. The visuals of the PowerPoint can enhance the presenters message, so our Online Video Model Company Profile Social Network Financial Comparison Formats PDF was created to help save time. Instead of worrying about the design, the presenter can concentrate on the message while our designers work on creating the ideal templates for whatever situation is needed. Slidegeeks has experts for everything from amazing designs to valuable content, we have put everything into Online Video Model Company Profile Social Network Financial Comparison Formats PDF.
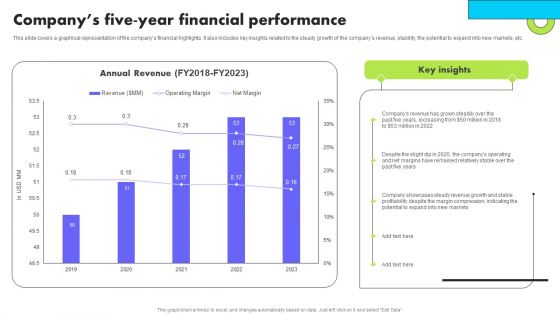
Planning Transnational Technique To Improve International Scope Companys Five Year Financial Performance Clipart PDF
This slide covers a graphical representation of the companys financial highlights. It also includes key insights related to the steady growth of the companys revenue, stability, the potential to expand into new markets, etc. Do you have to make sure that everyone on your team knows about any specific topic I yes, then you should give Planning Transnational Technique To Improve International Scope Companys Five Year Financial Performance Clipart PDF a try. Our experts have put a lot of knowledge and effort into creating this impeccable Planning Transnational Technique To Improve International Scope Companys Five Year Financial Performance Clipart PDF. You can use this template for your upcoming presentations, as the slides are perfect to represent even the tiniest detail. You can download these templates from the Slidegeeks website and these are easy to edit. So grab these today.
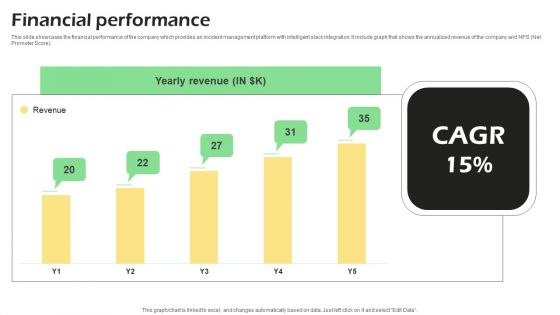
Real Time Incident Management Solution Investor Funding Pitch Deck Financial Performance Information PDF
This slide showcases the financial performance of the company which provides an incident management platform with intelligent slack integration. It include graph that shows the annualized revenue of the company and NPS Net Promoter Score. Crafting an eye catching presentation has never been more straightforward. Let your presentation shine with this tasteful yet straightforward Real Time Incident Management Solution Investor Funding Pitch Deck Financial Performance Information PDF template. It offers a minimalistic and classy look that is great for making a statement. The colors have been employed intelligently to add a bit of playfulness while still remaining professional. Construct the ideal Real Time Incident Management Solution Investor Funding Pitch Deck Financial Performance Information PDF that effortlessly grabs the attention of your audience. Begin now and be certain to wow your customers.
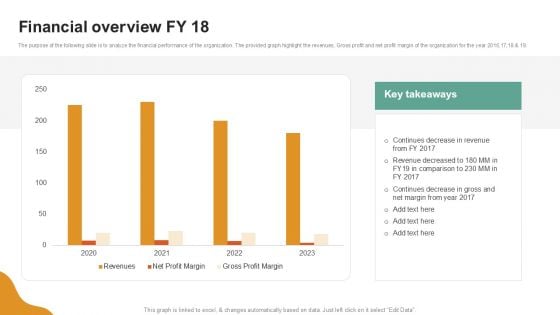
A LA Carte Business Strategy Financial Overview FY 18 Topics PDF
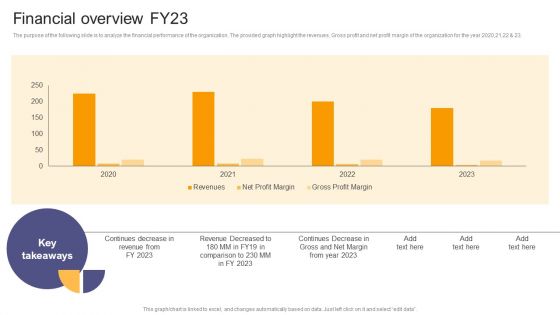
Per Device Pricing Strategy For Managed Solutions Financial Overview FY23 Ideas PDF
The purpose of the following slide is to analyze the financial performance of the organization. The provided graph highlight the revenues, Gross profit and net profit margin of the organization for the year 2020,21,22 and 23. Find highly impressive Per Device Pricing Strategy For Managed Solutions Financial Overview FY23 Ideas PDF on Slidegeeks to deliver a meaningful presentation. You can save an ample amount of time using these presentation templates. No need to worry to prepare everything from scratch because Slidegeeks experts have already done a huge research and work for you. You need to download Per Device Pricing Strategy For Managed Solutions Financial Overview FY23 Ideas PDF for your upcoming presentation. All the presentation templates are 100 percent editable and you can change the color and personalize the content accordingly. Download now.
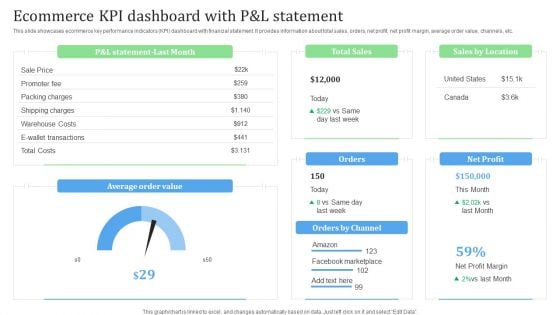
Ecommerce KPI Dashboard With P And L Statement Financial Management Strategies Background PDF
This slide showcases ecommerce key performance indicators KPI dashboard with financial statement. It provides information about total sales, orders, net profit, net profit margin, average order value, channels, etc.Whether you have daily or monthly meetings, a brilliant presentation is necessary. Ecommerce KPI Dashboard With P And L Statement Financial Management Strategies Background PDF can be your best option for delivering a presentation. Represent everything in detail using Ecommerce KPI Dashboard With P And L Statement Financial Management Strategies Background PDF and make yourself stand out in meetings. The template is versatile and follows a structure that will cater to your requirements. All the templates prepared by Slidegeeks are easy to download and edit. Our research experts have taken care of the corporate themes as well. So, give it a try and see the results.

Business Presentation Shows Financial Chart PowerPoint Templates Ppt Backgrounds For Slides 0513
Our Business Presentation Shows Financial Chart PowerPoint Templates PPT Backgrounds For Slides help in a duel of wits. They get your ideas to come out on top. Our finance PowerPoint Templates play a dual role. They aid and abet you in your endeavour. Win any duel with our business PowerPoint Templates. Your thoughts will be faster on the draw. Our Business Presentation Shows Financial Chart PowerPoint Templates Ppt Backgrounds For Slides 0513 save time creating a mind blowing presentation. With our money back guarantee you have nothing to lose.
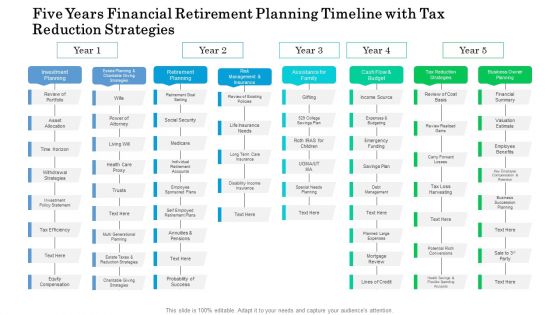
Five Years Financial Retirement Planning Timeline With Tax Reduction Strategies Inspiration
We present our five years financial retirement planning timeline with tax reduction strategies inspiration. This PowerPoint layout is easy to edit so you can change the font size, font type, color, and shape conveniently. In addition to this, the PowerPoint layout is Google Slides compatible, so you can share it with your audience and give them access to edit it. Therefore, download and save this well researched five years financial retirement planning timeline with tax reduction strategies inspiration in different formats like PDF, PNG, and JPG to smoothly execute your business plan.
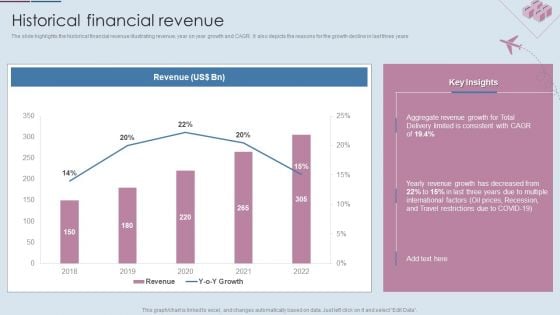
Logistics Shipment Company Profile Historical Financial Revenue Ppt Gallery Templates PDF
The slide highlights the historical financial revenue illustrating revenue, year on year growth and CAGR. It also depicts the reasons for the growth decline in last three years. Deliver and pitch your topic in the best possible manner with this Logistics Shipment Company Profile Historical Financial Revenue Ppt Gallery Templates PDF. Use them to share invaluable insights on Revenue, 2018 To 2022, Aggregate Revenue Growth and impress your audience. This template can be altered and modified as per your expectations. So, grab it now.
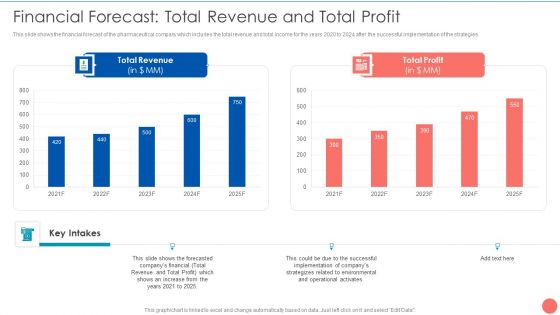
Tactics To Achieve Sustainability Financial Forecast Total Revenue And Total Profit Elements PDF
This slide shows the financial forecast of the pharmaceutical company which includes the total revenue and total income for the years 2020 to 2024 after the successful implementation of the strategies. Deliver and pitch your topic in the best possible manner with this Tactics To Achieve Sustainability Financial Forecast Total Revenue And Total Profit Elements PDF. Use them to share invaluable insights on Total Revenue Increase, Total Profit Years, 2021 To 2025 and impress your audience. This template can be altered and modified as per your expectations. So, grab it now.
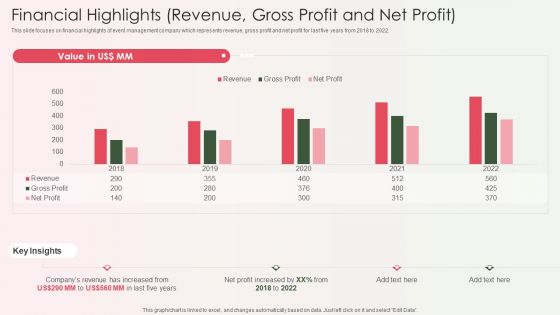
Event Organizer And Coordinator Company Profile Financial Highlights Revenue Gross Profit And Net Profit Formats PDF
This slide focuses on financial highlights of event management company which represents revenue, gross profit and net profit for last five years from 2018 to 2022.Deliver and pitch your topic in the best possible manner with this Event Organizer And Coordinator Company Profile Financial Highlights Revenue Gross Profit And Net Profit Formats PDF Use them to share invaluable insights on Revenue Increased, Profit Increased, Key Insights and impress your audience. This template can be altered and modified as per your expectations. So, grab it now.
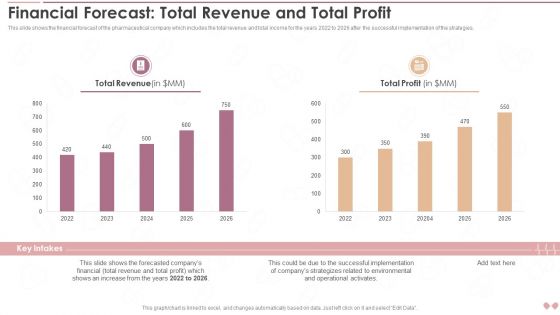
Innovative Business Model Of Pharmaceutical Financial Forecast Total Revenue And Total Profit Topics PDF
This slide shows the financial forecast of the pharmaceutical company which includes the total revenue and total income for the years 2022 to 2026 after the successful implementation of the strategies.Deliver an awe inspiring pitch with this creative Innovative Business Model Of Pharmaceutical Financial Forecast Total Revenue And Total Profit Topics PDF bundle. Topics like Total Revenue, Total Profit, Forecasted Company can be discussed with this completely editable template. It is available for immediate download depending on the needs and requirements of the user.
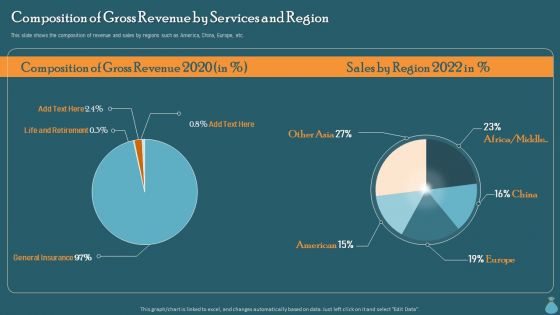
Financial Data Revelation To Varied Stakeholders Composition Of Gross Revenue By Services And Region Slides PDF
This slide shows the composition of revenue and sales by regions such as America, China, Europe, etc. Create an editable Financial Data Revelation To Varied Stakeholders Composition Of Gross Revenue By Services And Region Slides PDF that communicates your idea and engages your audience. Whether you are presenting a business or an educational presentation, pre designed presentation templates help save time. Financial Data Revelation To Varied Stakeholders Composition Of Gross Revenue By Services And Region Slides PDF is highly customizable and very easy to edit, covering many different styles from creative to business presentations. Slidegeeks has creative team members who have crafted amazing templates. So, go and get them without any delay.
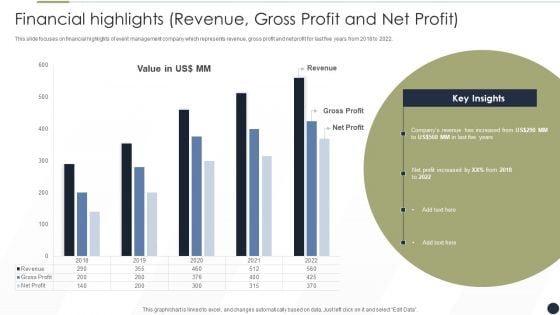
Event Management Services Company Profile Financial Highlights Revenue Gross Profit And Net Profit Template PDF
This slide focuses on financial highlights of event management company which represents revenue, gross profit and net profit for last five years from 2018 to 2022.Deliver and pitch your topic in the best possible manner with this Event Management Services Company Profile Financial Highlights Revenue Gross Profit And Net Profit Template PDF Use them to share invaluable insights on Gross Profit, Key Insights, profit increased and impress your audience. This template can be altered and modified as per your expectations. So, grab it now.
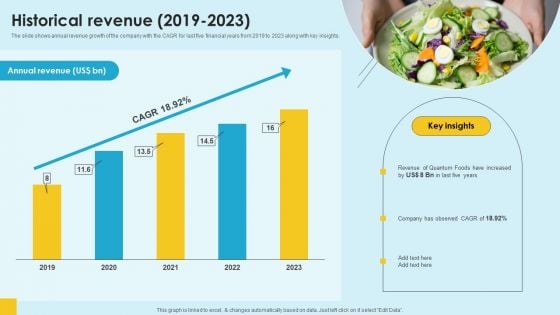
Food Company Financial Performance Summary Historical Revenue 2019 2023 Background PDF
The slide shows annual revenue growth of the company with the CAGR for last five financial years from 2019 to 2023 along with key insights. Take your projects to the next level with our ultimate collection of Food Company Financial Performance Summary Historical Revenue 2019 2023 Background PDF. Slidegeeks has designed a range of layouts that are perfect for representing task or activity duration, keeping track of all your deadlines at a glance. Tailor these designs to your exact needs and give them a truly corporate look with your own brand colors they will make your projects stand out from the rest
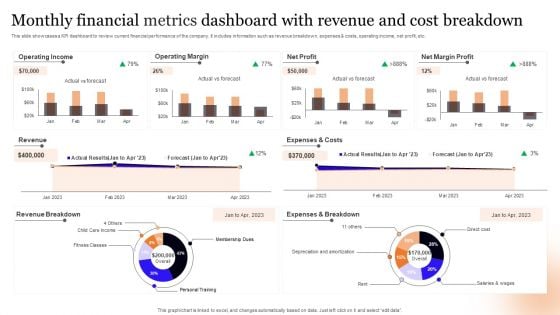
Monthly Financial Metrics Dashboard With Revenue And Cost Breakdown Information PDF
This slide showcases a KPI dashboard to review current financial performance of the company. It includes information such as revenue breakdown, expenses and costs, operating income, net profit, etc. Pitch your topic with ease and precision using this Monthly Financial Metrics Dashboard With Revenue And Cost Breakdown Information PDF. This layout presents information on Operating Income, Operating Margin, Net Profit. It is also available for immediate download and adjustment. So, changes can be made in the color, design, graphics or any other component to create a unique layout.
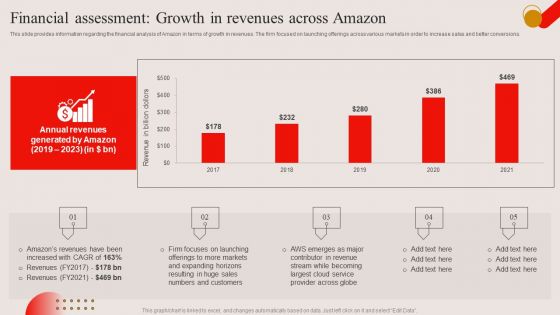
Financial Assessment Growth In Revenues Across Amazon Ppt PowerPoint Presentation File Show PDF
This slide provides information regarding the financial analysis of Amazon in terms of growth in revenues. The firm focused on launching offerings across various markets in order to increase sales and better conversions. If your project calls for a presentation, then Slidegeeks is your go to partner because we have professionally designed, easy to edit templates that are perfect for any presentation. After downloading, you can easily edit Financial Assessment Growth In Revenues Across Amazon Ppt PowerPoint Presentation File Show PDF and make the changes accordingly. You can rearrange slides or fill them with different images. Check out all the handy templates
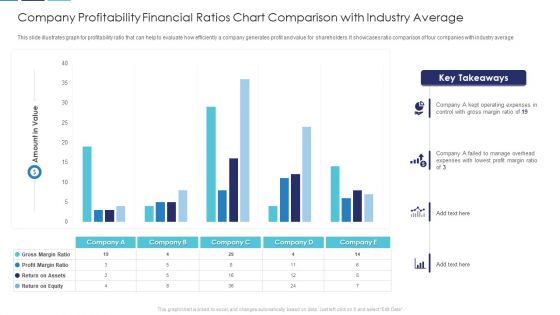
Company Profitability Financial Ratios Chart Comparison With Industry Average Download PDF
This slide illustrates graph for profitability ratio that can help to evaluate how efficiently a company generates profit and value for shareholders. It showcases ratio comparison of four companies with industry average Showcasing this set of slides titled company profitability financial ratios chart comparison with industry average download pdf. The topics addressed in these templates are company profitability financial ratios chart comparison with industry average. All the content presented in this PPT design is completely editable. Download it and make adjustments in color, background, font etc. as per your unique business setting.
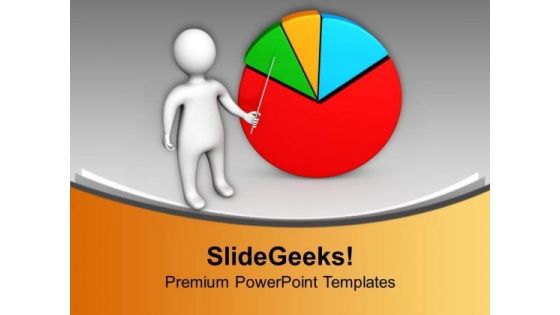
Financial Result Display By Pie Chart PowerPoint Templates Ppt Backgrounds For Slides 0613
Give power to your elbow with our Financial Result Display By Pie Chart PowerPoint Templates PPT Backgrounds For Slides. Get that extra information you need. Put them on the same page with our Pie Charts PowerPoint Templates. Your team will sing from the same sheet. Push the envelop with our People PowerPoint Templates. Let your thoughts rise above the norm. Achieve the fame you aspire to. Our Financial Result Display By Pie Chart PowerPoint Templates Ppt Backgrounds For Slides 0613 will make it a certainty.
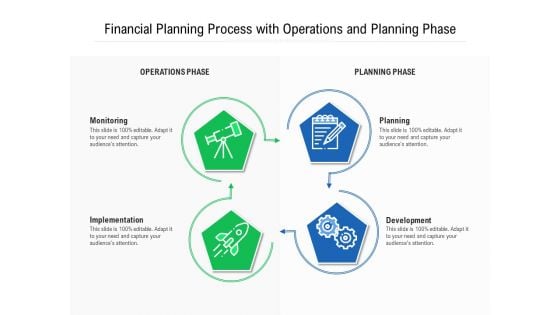
Financial Planning Process With Operations And Planning Phase Ppt PowerPoint Presentation File Graphics Template PDF
Presenting financial planning process with operations and planning phase ppt powerpoint presentation file graphics template pdf to dispense important information. This template comprises four stages. It also presents valuable insights into the topics including monitoring, planning, development. This is a completely customizable PowerPoint theme that can be put to use immediately. So, download it and address the topic impactfully.
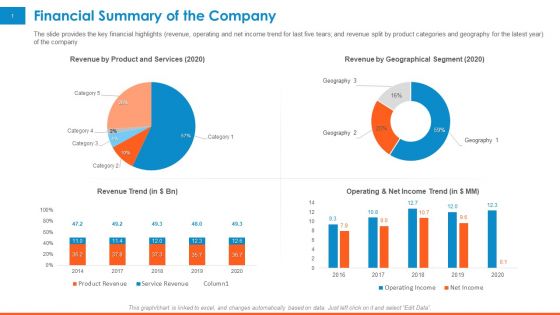
Raising Company Capital From Public Funding Sources Financial Summary Of The Company Graphics PDF
The slide provides the key financial highlights revenue, operating and net income trend for last five tears and revenue split by product categories and geography for the latest year of the company. Deliver an awe-inspiring pitch with this creative raising company capital from public funding sources financial summary of the company graphics pdf bundle. Topics like revenue product and services 2020, revenue geographical segment 2020, revenue trend, operating and net income trend can be discussed with this completely editable template. It is available for immediate download depending on the needs and requirements of the user.

 Home
Home