Financial Kpi
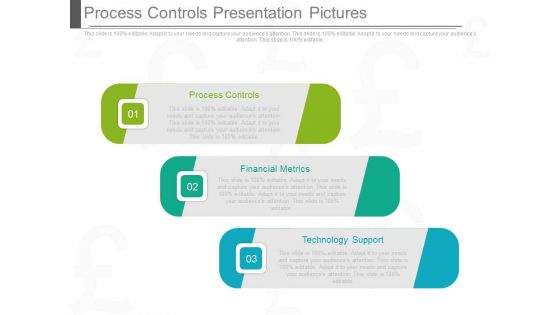
Process Controls Presentation Pictures
This is a process controls presentation pictures. This is a three stage process. The stages in this process are process controls, financial metrics, technology support.
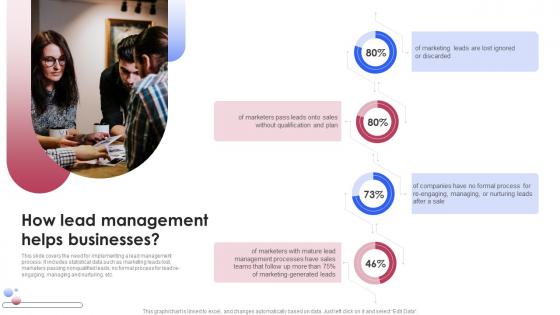
How Lead Management Helps Businesses Various Techniques For Managing Mockup PDF
This slide covers the KPI dashboard for tracking improved lead management system performance. It includes metrics such as visitors, social media followers, email subscribers, organic leads, etc. This slide covers the KPI dashboard for tracking improved lead management system performance. It includes metrics such as visitors, social media followers, email subscribers, organic leads, etc. Make sure to capture your audiences attention in your business displays with our gratis customizable How Lead Management Helps Businesses Various Techniques For Managing Mockup PDF. These are great for business strategies, office conferences, capital raising or task suggestions. If you desire to acquire more customers for your tech business and ensure they stay satisfied, create your own sales presentation with these plain slides. This slide covers the KPI dashboard for tracking improved lead management system performance. It includes metrics such as visitors, social media followers, email subscribers, organic leads, etc.
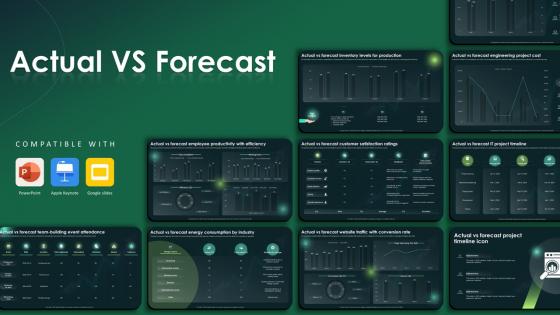
Actual Vs Forecast Powerpoint Ppt Template Bundles
This Actual Vs Forecast Powerpoint Ppt Template Bundles is designed to help you retain your audiences attention. This content-ready PowerPoint Template enables you to take your audience on a journey and share information in a way that is easier to recall. It helps you highlight the crucial parts of your work so that the audience does not get saddled with information download. This KPI Dashboard, Data Driven Marketing, Campaign Performance, Marketing Evaluation, Inventory Assessment-slide PPT Deck comes prepared with the graphs and charts you could need to showcase your information through visuals. You only need to enter your own data in them. Download this editable PowerPoint Theme and walk into that meeting with confidence. Our Actual vs. Forecast PowerPoint presentation can provide you with valuable business insights. Analyze sales figures, budgets, and financial predictions. Identify major differences, modify methods, and match projections with results to improve decision-making. Download now to accelerate your success.
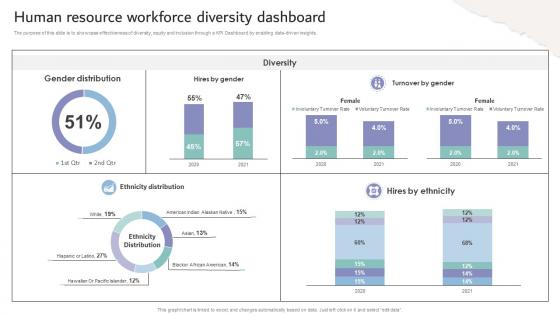
Inclusive Workplace Training Program Human Resource Workforce Diversity Dashboard DTE SS V
The purpose of this slide is to showcase effectiveness of diversity, equity and inclusion through a KPI Dashboard by enabling data-driven insights. Make sure to capture your audiences attention in your business displays with our gratis customizable Inclusive Workplace Training Program Human Resource Workforce Diversity Dashboard DTE SS V. These are great for business strategies, office conferences, capital raising or task suggestions. If you desire to acquire more customers for your tech business and ensure they stay satisfied, create your own sales presentation with these plain slides. The purpose of this slide is to showcase effectiveness of diversity, equity and inclusion through a KPI Dashboard by enabling data-driven insights.
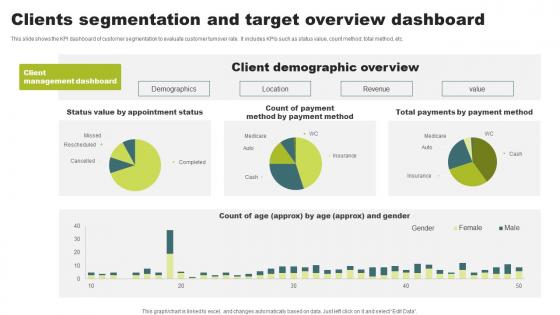
Clients Segmentation And Target Overview Dashboard Microsoft Pdf
This slide shows the KPI dashboard of customer segmentation to evaluate customer turnover rate. It includes KPIs such as status value, count method, total method, etc. Showcasing this set of slides titled Clients Segmentation And Target Overview Dashboard Microsoft Pdf. The topics addressed in these templates are Client Demographic Overview, Revenue, Location. All the content presented in this PPT design is completely editable. Download it and make adjustments in color, background, font etc. as per your unique business setting. This slide shows the KPI dashboard of customer segmentation to evaluate customer turnover rate. It includes KPIs such as status value, count method, total method, etc.
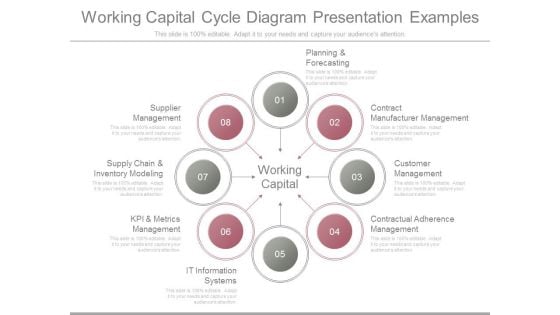
Working Capital Cycle Diagram Presentation Examples
This is a working capital cycle diagram presentation examples. This is a eight stage process. The stages in this process are planning and forecasting, contract manufacturer management, customer management, contractual adherence management, it information systems, kpi and metrics management, supply chain and inventory modeling, supplier management.
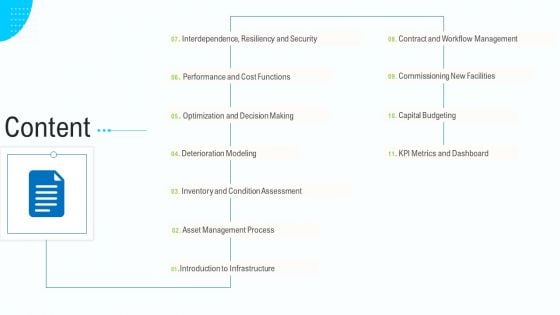
Business Activities Assessment Examples Content Professional PDF
Deliver an awe inspiring pitch with this creative business activities assessment examples content professional pdf bundle. Topics like contract and workflow management, commissioning new facilities, capital budgeting, kpi metrics and dashboard, asset management process can be discussed with this completely editable template. It is available for immediate download depending on the needs and requirements of the user.
Online Business Promotion Performance Analysis To Fulfill Business Objectives Ppt PowerPoint Presentation Summary Icon PDF
Pitch your topic with ease and precision using this online business promotion performance analysis to fulfill business objectives ppt powerpoint presentation summary icon pdf. This layout presents information on KPI performance metric, advertiser revenue, sell products. It is also available for immediate download and adjustment. So, changes can be made in the color, design, graphics or any other component to create a unique layout.
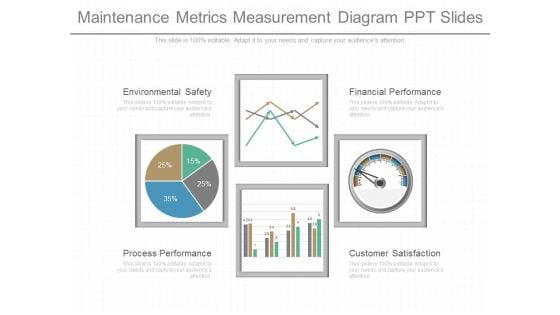
Maintenance Metrics Measurement Diagram Ppt Slides
This is a maintenance metrics measurement diagram ppt slides. This is a four stage process. The stages in this process are environmental safety, process performance, financial performance, customer satisfaction.
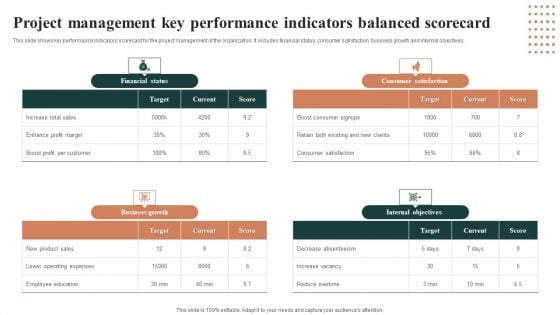
Project Management Key Performance Indicators Balanced Scorecard Introduction PDF
This slide shows key performance indicators scorecard for the project management of the organization. It includes financial status, consumer satisfaction, business growth and internal objectives. Pitch your topic with ease and precision using this Project Management Key Performance Indicators Balanced Scorecard Introduction PDF. This layout presents information on Financial Status, Business Growth, Consumer Satisfaction. It is also available for immediate download and adjustment. So, changes can be made in the color, design, graphics or any other component to create a unique layout.
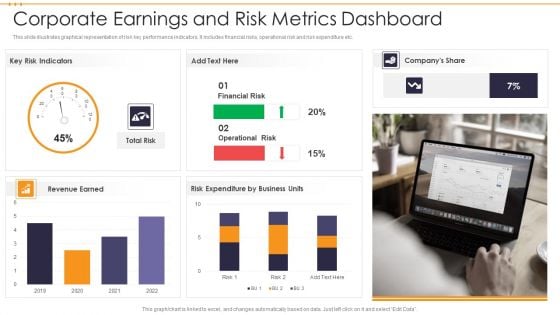
Corporate Earnings And Risk Metrics Dashboard Guidelines PDF
This slide illustrates graphical representation of risk key performance indicators. It includes financial risks, operational risk and risk expenditure etc. Pitch your topic with ease and precision using this Corporate Earnings And Risk Metrics Dashboard Guidelines PDF. This layout presents information on Financial Risk, Operational Risk Expenditure. It is also available for immediate download and adjustment. So, changes can be made in the color, design, graphics or any other component to create a unique layout.
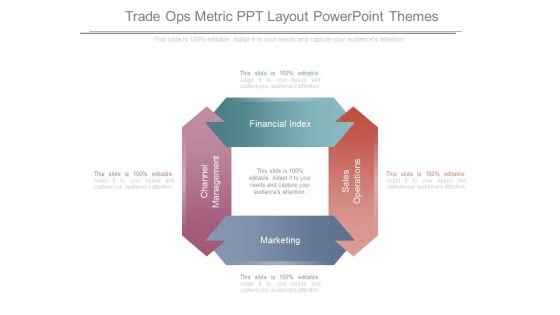
Trade Ops Metric Ppt Layout Powerpoint Themes
This is a trade ops metric ppt layout powerpoint themes. This is a four stage process. The stages in this process are channel management, marketing, sales operations, financial index.
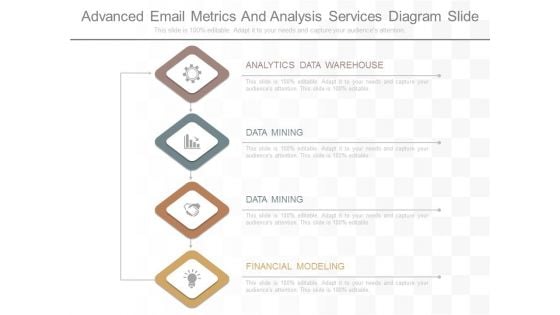
Advanced Email Metrics And Analysis Services Diagram Slide
This is a advanced email metrics and analysis services diagram slide. This is a four stage process. The stages in this process are analytics data warehouse, data mining, financial modeling.
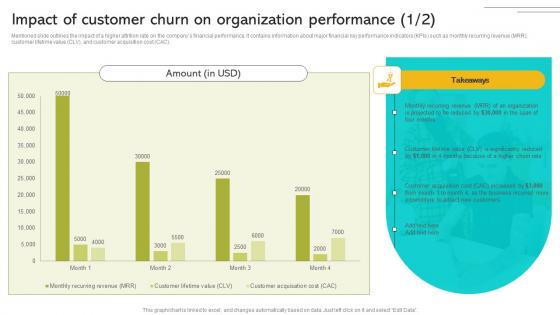
Implementing Strategies To Enhance Impact Of Customer Churn On Organization Performance Infographics PDF
Mentioned slide outlines the impact of a higher attrition rate on the companys financial performance. It contains information about major financial key performance indicators KPIs such as monthly recurring revenue MRR, customer lifetime value CLV, and customer acquisition cost CAC. Make sure to capture your audiences attention in your business displays with our gratis customizable Implementing Strategies To Enhance Impact Of Customer Churn On Organization Performance Infographics PDF These are great for business strategies, office conferences, capital raising or task suggestions. If you desire to acquire more customers for your tech business and ensure they stay satisfied, create your own sales presentation with these plain slides. Mentioned slide outlines the impact of a higher attrition rate on the companys financial performance. It contains information about major financial key performance indicators KPIs such as monthly recurring revenue MRR, customer lifetime value CLV, and customer acquisition cost CAC.
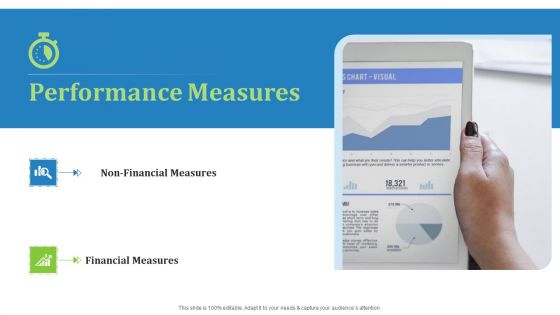
Supply Chain Management Operational Metrics Performance Measures Designs PDF
This is a supply chain management operational metrics performance measures designs pdf. template with various stages. Focus and dispense information on two stages using this creative set, that comes with editable features. It contains large content boxes to add your information on topics like NON financial measures, financial measures. You can also showcase facts, figures, and other relevant content using this PPT layout. Grab it now.
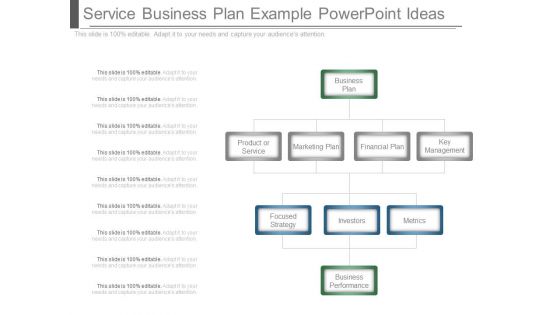
Service Business Plan Example Powerpoint Ideas
This is a service business plan example powerpoint ideas. This is a nine stage process. The stages in this process are business plan, product or service, marketing plan, financial plan, key management, focused strategy, investors, metrics.
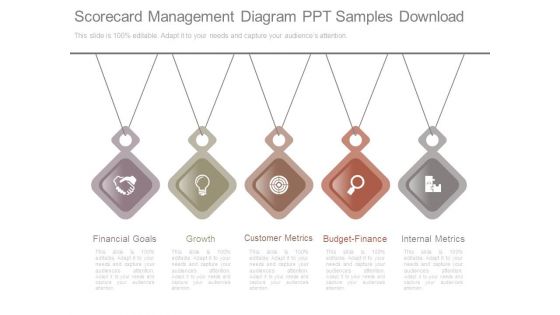
Scorecard Management Diagram Ppt Samples Download
This is a scorecard management diagram ppt samples download. This is a five stage process. The stages in this process are financial goals, growth, customer metrics, budget finance, internal metrics.
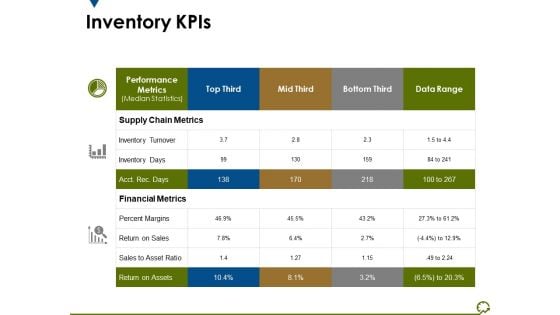
Inventory Kpis Ppt PowerPoint Presentation Infographic Template Display
This is a inventory kpis ppt powerpoint presentation infographic template display. This is a three stage process. The stages in this process are supply chain metrics, financial metrics, percent margins, return on assets, inventory turnover.
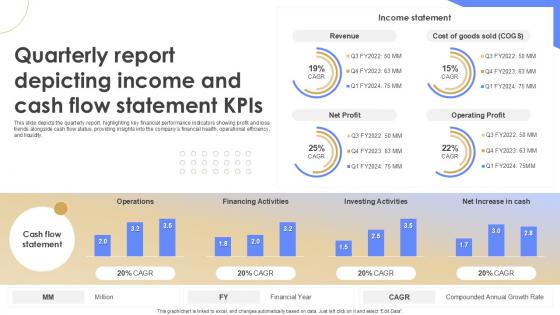
Quarterly Report Depicting Income And Cash Flow Statement KPIS Quarterly Report Ppt Example
This slide depicts the quarterly report, highlighting key financial performance indicators showing profit and loss trends alongside cash flow status, providing insights into the companys financial health, operational efficiency, and liquidity. Do you have an important presentation coming up Are you looking for something that will make your presentation stand out from the rest Look no further than Quarterly Report Depicting Income And Cash Flow Statement KPIS Quarterly Report Ppt Example With our professional designs, you can trust that your presentation will pop and make delivering it a smooth process. And with Slidegeeks, you can trust that your presentation will be unique and memorable. So why wait Grab Quarterly Report Depicting Income And Cash Flow Statement KPIS Quarterly Report Ppt Example today and make your presentation stand out from the rest This slide depicts the quarterly report, highlighting key financial performance indicators showing profit and loss trends alongside cash flow status, providing insights into the companys financial health, operational efficiency, and liquidity.
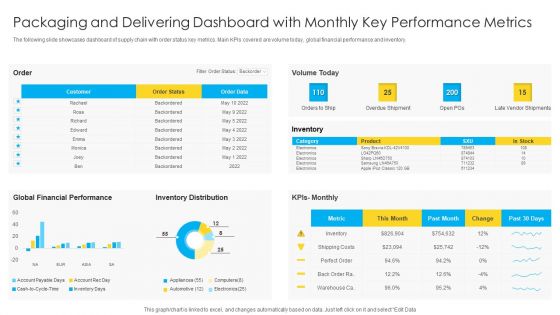
Packaging And Delivering Dashboard With Monthly Key Performance Metrics Microsoft PDF
The following slide showcases dashboard of supply chain with order status key metrics. Main KPIs covered are volume today, global financial performance and inventory. Pitch your topic with ease and precision using this Packaging And Delivering Dashboard With Monthly Key Performance Metrics Microsoft PDF. This layout presents information on Customer, Global Financial Performance, Inventory Distribution. It is also available for immediate download and adjustment. So, changes can be made in the color, design, graphics or any other component to create a unique layout.
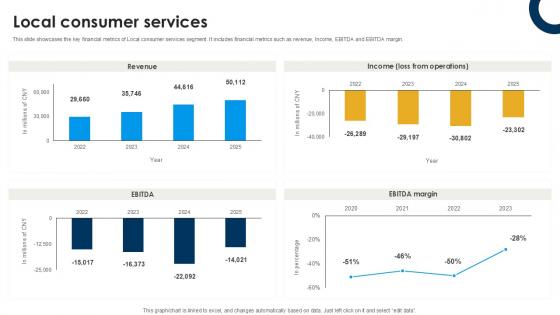
Local Consumer Services International Trade Of Products And Services PPT Example CP SS V
This slide showcases the key financial metrics of Local consumer services segment. It includes financial metrics such as revenue, Income, EBITDA and EBITDA margin. Welcome to our selection of the Local Consumer Services International Trade Of Products And Services PPT Example CP SS V. These are designed to help you showcase your creativity and bring your sphere to life. Planning and Innovation are essential for any business that is just starting out. This collection contains the designs that you need for your everyday presentations. All of our PowerPoints are 100Percent editable, so you can customize them to suit your needs. This multi-purpose template can be used in various situations. Grab these presentation templates today. This slide showcases the key financial metrics of Local consumer services segment. It includes financial metrics such as revenue, Income, EBITDA and EBITDA margin.
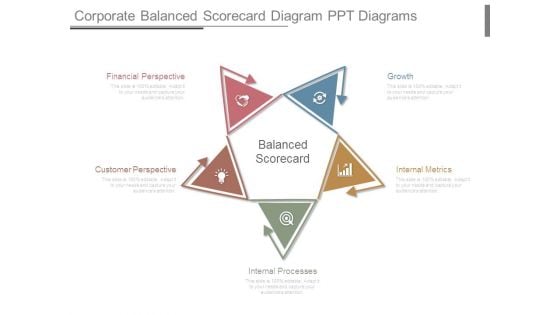
Corporate Balanced Scorecard Diagram Ppt Diagrams
This is a corporate balanced scorecard diagram ppt diagrams. This is a five stage process. The stages in this process are financial perspective, customer perspective, internal processes, growth, internal metrics, balanced scorecard.
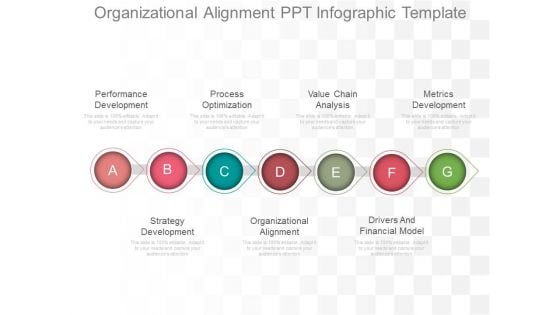
Organizational Alignment Ppt Infographic Template
This is a organizational alignment ppt infographic template. This is a seven stage process. The stages in this process are performance development, process optimization, value chain analysis, metrics development, strategy development, organizational alignment, drivers and financial model.

Knowledge Management Process Model Ppt Slides
This is a knowledge management process model ppt slides. This is a six stage process. The stages in this process are knowledge manager, reports dashboard, metrics manager, financial tracker, resource manager, project tracker, result, strategy, execution.
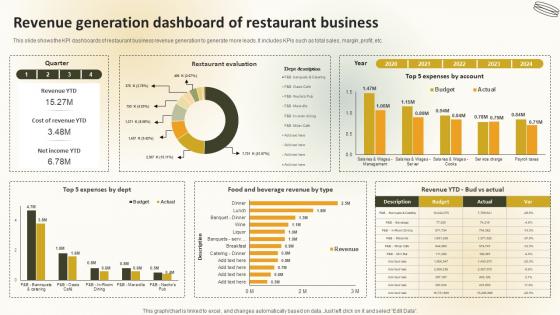
Revenue Generation Dashboard Of Restaurant Business Create An Effective Restaurant
This slide shows the KPI dashboards of restaurant business revenue generation to generate more leads. It includes KPIs such as total sales, margin,profit, etc. Present like a pro with Revenue Generation Dashboard Of Restaurant Business Create An Effective Restaurant. Create beautiful presentations together with your team, using our easy-to-use presentation slides. Share your ideas in real-time and make changes on the fly by downloading our templates. So whether you are in the office, on the go, or in a remote location, you can stay in sync with your team and present your ideas with confidence. With Slidegeeks presentation got a whole lot easier. Grab these presentations today. This slide shows the KPI dashboards of restaurant business revenue generation to generate more leads. It includes KPIs such as total sales, margin,profit, etc.

Create A Restaurant Marketing Revenue Generation Dashboard Of Restaurant
This slide shows the KPI dashboards of restaurant business revenue generation to generate more leads. It includes KPIs such as total sales, margin ,profit, etc. Present like a pro with Create A Restaurant Marketing Revenue Generation Dashboard Of Restaurant. Create beautiful presentations together with your team, using our easy-to-use presentation slides. Share your ideas in real-time and make changes on the fly by downloading our templates. So whether you are in the office, on the go, or in a remote location, you can stay in sync with your team and present your ideas with confidence. With Slidegeeks presentation got a whole lot easier. Grab these presentations today. This slide shows the KPI dashboards of restaurant business revenue generation to generate more leads. It includes KPIs such as total sales, margin ,profit, etc.
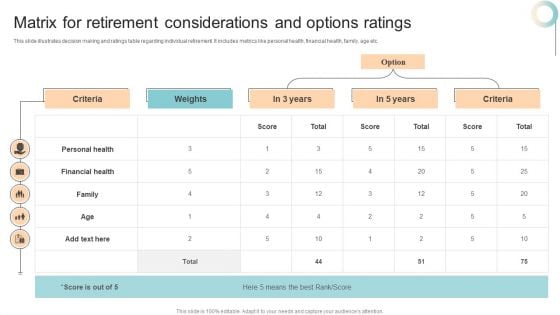
Matrix For Retirement Considerations And Options Ratings Infographics PDF
This slide illustrates decision making and ratings table regarding individual retirement. It includes metrics like personal health, financial health, family, age etc. Showcasing this set of slides titled Matrix For Retirement Considerations And Options Ratings Infographics PDF. The topics addressed in these templates are Personal Health, Financial Health, Family. All the content presented in this PPT design is completely editable. Download it and make adjustments in color, background, font etc. as per your unique business setting.
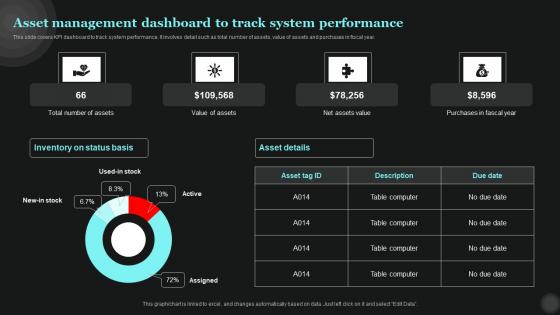
Asset Management Dashboard To Track Tech Asset Management Diagrams Pdf
This slide covers KPI dashboard to track system performance. It involves detail such as total number of assets, value of assets and purchases in fiscal year. Slidegeeks has constructed Asset Management Dashboard To Track Tech Asset Management Diagrams Pdf after conducting extensive research and examination. These presentation templates are constantly being generated and modified based on user preferences and critiques from editors. Here, you will find the most attractive templates for a range of purposes while taking into account ratings and remarks from users regarding the content. This is an excellent jumping-off point to explore our content and will give new users an insight into our top-notch PowerPoint Templates. This slide covers KPI dashboard to track system performance. It involves detail such as total number of assets, value of assets and purchases in fiscal year.
Asset Management Dashboard Maximizing Efficiency With Asset Tracking Solutions Clipart Pdf
This slide covers KPI dashboard to track system performance. It involves detail such as total number of assets, value of assets and purchases in fiscal year. Slidegeeks is one of the best resources for PowerPoint templates. You can download easily and regulate Asset Management Dashboard Maximizing Efficiency With Asset Tracking Solutions Clipart Pdf for your personal presentations from our wonderful collection. A few clicks is all it takes to discover and get the most relevant and appropriate templates. Use our Templates to add a unique zing and appeal to your presentation and meetings. All the slides are easy to edit and you can use them even for advertisement purposes. This slide covers KPI dashboard to track system performance. It involves detail such as total number of assets, value of assets and purchases in fiscal year.
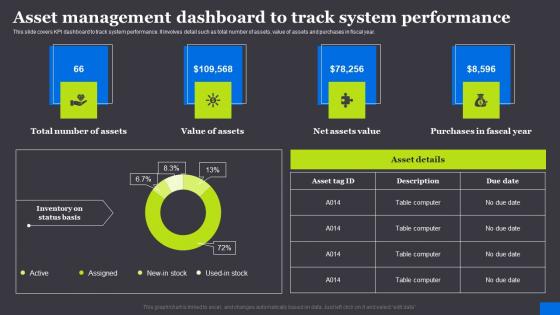
Asset Management Dashboard To Track RFID Solutions For Asset Traceability Mockup Pdf
This slide covers KPI dashboard to track system performance. It involves detail such as total number of assets, value of assets and purchases in fiscal year. Slidegeeks is one of the best resources for PowerPoint templates. You can download easily and regulate Asset Management Dashboard To Track RFID Solutions For Asset Traceability Mockup Pdf for your personal presentations from our wonderful collection. A few clicks is all it takes to discover and get the most relevant and appropriate templates. Use our Templates to add a unique zing and appeal to your presentation and meetings. All the slides are easy to edit and you can use them even for advertisement purposes. This slide covers KPI dashboard to track system performance. It involves detail such as total number of assets, value of assets and purchases in fiscal year.
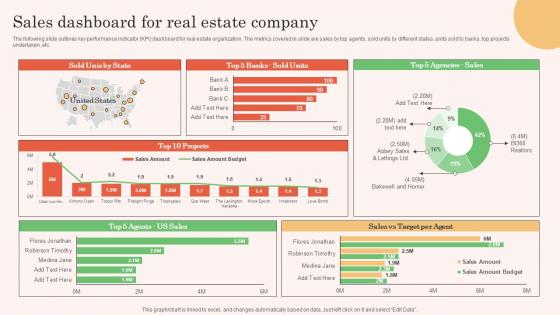
Sales Dashboard For Real Estate Company Real Estate Property Marketing Demonstration Pdf
The following slide outlines key performance indicator KPI dashboard for real estate organization. The metrics covered in slide are sales by top agents, sold units by different states, units sold to banks, top projects undertaken, etc.Make sure to capture your audiences attention in your business displays with our gratis customizable Sales Dashboard For Real Estate Company Real Estate Property Marketing Demonstration Pdf. These are great for business strategies, office conferences, capital raising or task suggestions. If you desire to acquire more customers for your tech business and ensure they stay satisfied, create your own sales presentation with these plain slides. The following slide outlines key performance indicator KPI dashboard for real estate organization. The metrics covered in slide are sales by top agents, sold units by different states, units sold to banks, top projects undertaken, etc.
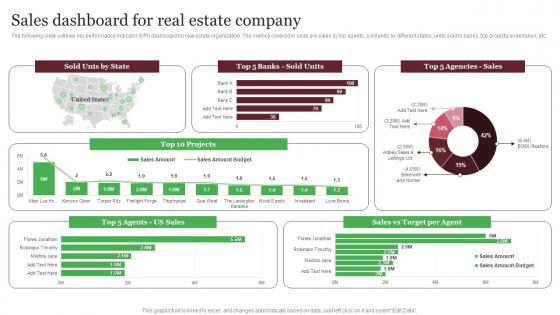
Sales Dashboard For Real Estate Company Out Of The Box Real Designs Pdf
The following slide outlines key performance indicator KPI dashboard for real estate organization. The metrics covered in slide are sales by top agents, sold units by different states, units sold to banks, top projects undertaken, etc. Make sure to capture your audiences attention in your business displays with our gratis customizable Sales Dashboard For Real Estate Company Out Of The Box Real Designs Pdf These are great for business strategies, office conferences, capital raising or task suggestions. If you desire to acquire more customers for your tech business and ensure they stay satisfied, create your own sales presentation with these plain slides. The following slide outlines key performance indicator KPI dashboard for real estate organization. The metrics covered in slide are sales by top agents, sold units by different states, units sold to banks, top projects undertaken, etc.
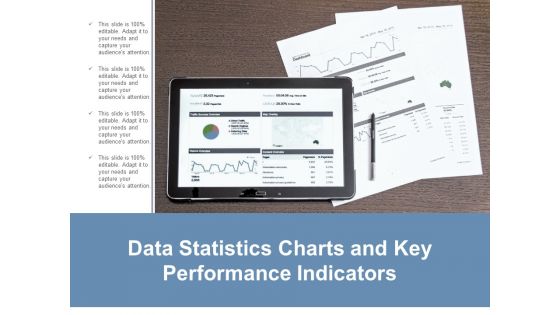
Data Statistics Charts And Key Performance Indicators Ppt Powerpoint Presentation Layouts Guide
This is a data statistics charts and key performance indicators ppt powerpoint presentation layouts guide. This is a four stage process. The stages in this process are business metrics, business kpi, business dashboard.
Improving PPC Campaign Results Annual Sem Campaign Performance Plan Icons Pdf
The following slide showcases the yearly search engine marketing campaign performance plan to project results. It KPI such as revenue, pay-per-click, media spend, management fee, total cost, paid search revenue etc. Slidegeeks is one of the best resources for PowerPoint templates. You can download easily and regulate Improving PPC Campaign Results Annual Sem Campaign Performance Plan Icons Pdf for your personal presentations from our wonderful collection. A few clicks is all it takes to discover and get the most relevant and appropriate templates. Use our Templates to add a unique zing and appeal to your presentation and meetings. All the slides are easy to edit and you can use them even for advertisement purposes. The following slide showcases the yearly search engine marketing campaign performance plan to project results. It KPI such as revenue, pay-per-click, media spend, management fee, total cost, paid search revenue etc.
Dashboard For Tracking Impact Of Implementing Sales Techniques For Achieving Rules Pdf
This slide covers the KPI dashboard for tracking KPIs such as new customer YTD, sales revenue, profit, average weekly sales, above sales target, average revenue per unit, customer lifetime value, etc. Do you have an important presentation coming up Are you looking for something that will make your presentation stand out from the rest Look no further than Dashboard For Tracking Impact Of Implementing Sales Techniques For Achieving Rules Pdf. With our professional designs, you can trust that your presentation will pop and make delivering it a smooth process. And with Slidegeeks, you can trust that your presentation will be unique and memorable. So why wait Grab Dashboard For Tracking Impact Of Implementing Sales Techniques For Achieving Rules Pdf today and make your presentation stand out from the rest This slide covers the KPI dashboard for tracking KPIs such as new customer YTD, sales revenue, profit, average weekly sales, above sales target, average revenue per unit, customer lifetime value, etc.
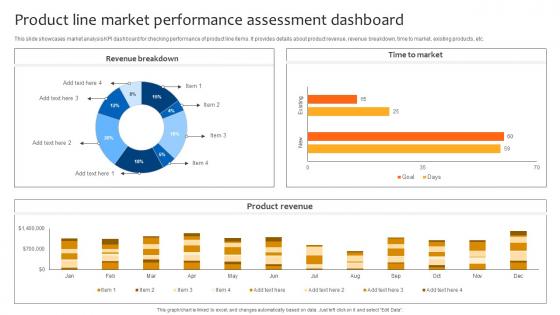
Deploying Strategies For Business Product Line Market Performance Assessment Dashboard Strategy SS V
This slide showcases market analysis KPI dashboard for checking performance of product line items. It provides details about product revenue, revenue breakdown, time to market, existing products, etc. Take your projects to the next level with our ultimate collection of Deploying Strategies For Business Product Line Market Performance Assessment Dashboard Strategy SS V. Slidegeeks has designed a range of layouts that are perfect for representing task or activity duration, keeping track of all your deadlines at a glance. Tailor these designs to your exact needs and give them a truly corporate look with your own brand colors they will make your projects stand out from the rest This slide showcases market analysis KPI dashboard for checking performance of product line items. It provides details about product revenue, revenue breakdown, time to market, existing products, etc.
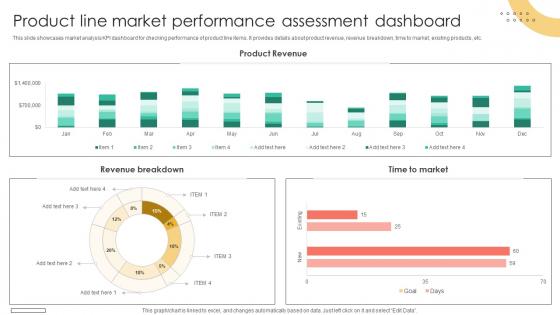
Brand Extension Techniques Product Line Market Performance Assessment Dashboard Strategy SS V
This slide showcases market analysis KPI dashboard for checking performance of product line items. It provides details about product revenue, revenue breakdown, time to market, existing products, etc. This Brand Extension Techniques Product Line Market Performance Assessment Dashboard Strategy SS V from Slidegeeks makes it easy to present information on your topic with precision. It provides customization options, so you can make changes to the colors, design, graphics, or any other component to create a unique layout. It is also available for immediate download, so you can begin using it right away. Slidegeeks has done good research to ensure that you have everything you need to make your presentation stand out. Make a name out there for a brilliant performance. This slide showcases market analysis KPI dashboard for checking performance of product line items. It provides details about product revenue, revenue breakdown, time to market, existing products, etc.
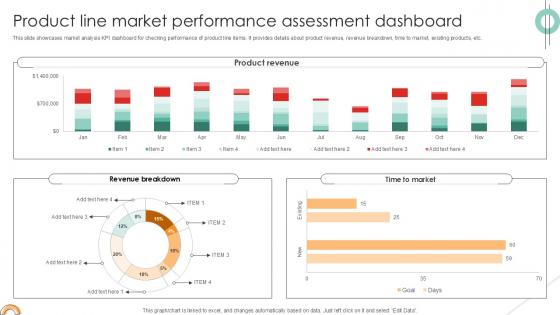
Product Line Market Performance Implementing Product Diversification PPT Sample Strategy SS V
This slide showcases market analysis KPI dashboard for checking performance of product line items. It provides details about product revenue, revenue breakdown, time to market, existing products, etc. Do you know about Slidesgeeks Product Line Market Performance Implementing Product Diversification PPT Sample Strategy SS V. These are perfect for delivering any kind od presentation. Using it, create PowerPoint presentations that communicate your ideas and engage audiences. Save time and effort by using our pre-designed presentation templates that are perfect for a wide range of topic. Our vast selection of designs covers a range of styles, from creative to business, and are all highly customizable and easy to edit. Download as a PowerPoint template or use them as Google Slides themes. This slide showcases market analysis KPI dashboard for checking performance of product line items. It provides details about product revenue, revenue breakdown, time to market, existing products, etc.
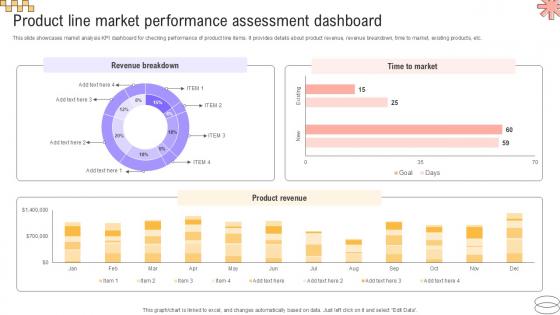
Product Line Market Performance Implementing Geographic Extension PPT Slide Strategy SS V
This slide showcases market analysis KPI dashboard for checking performance of product line items. It provides details about product revenue, revenue breakdown, time to market, existing products, etc. Take your projects to the next level with our ultimate collection of Product Line Market Performance Implementing Geographic Extension PPT Slide Strategy SS V. Slidegeeks has designed a range of layouts that are perfect for representing task or activity duration, keeping track of all your deadlines at a glance. Tailor these designs to your exact needs and give them a truly corporate look with your own brand colors they will make your projects stand out from the rest This slide showcases market analysis KPI dashboard for checking performance of product line items. It provides details about product revenue, revenue breakdown, time to market, existing products, etc.
Optimizing Client Lead Handling Lead Generation Dashboard For Tracking Information Pdf
This slide covers the KPI dashboard for tracking lead conversion rates. It includes metrics such as visitors, average session rate, per visit, bounce rate, page views, etc. Make sure to capture your audiences attention in your business displays with our gratis customizable Optimizing Client Lead Handling Lead Generation Dashboard For Tracking Information Pdf. These are great for business strategies, office conferences, capital raising or task suggestions. If you desire to acquire more customers for your tech business and ensure they stay satisfied, create your own sales presentation with these plain slides. This slide covers the KPI dashboard for tracking lead conversion rates. It includes metrics such as visitors, average session rate, per visit, bounce rate, page views, etc.
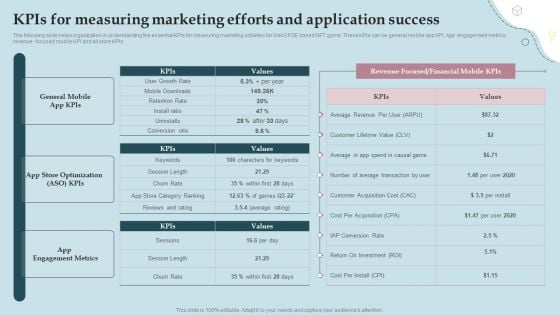
Business Strategy And Promotional Approach For Multiplayer Oriented Mobile Game Kpis For Measuring Marketing Efforts Topics PDF
The following slide helps organization in understanding the essential KPIs for measuring marketing activities for Web3 P2E based NFT game. These KPIs can be general mobile app KPI, App engagement metrics, revenue focused mobile KPI and all store KPIs Do you know about Slidesgeeks Business Strategy And Promotional Approach For Multiplayer Oriented Mobile Game Kpis For Measuring Marketing Efforts Topics PDF. These are perfect for delivering any kind od presentation. Using it, create PowerPoint presentations that communicate your ideas and engage audiences. Save time and effort by using our pre designed presentation templates that are perfect for a wide range of topic. Our vast selection of designs covers a range of styles, from creative to business, and are all highly customizable and easy to edit. Download as a PowerPoint template or use them as Google Slides themes.
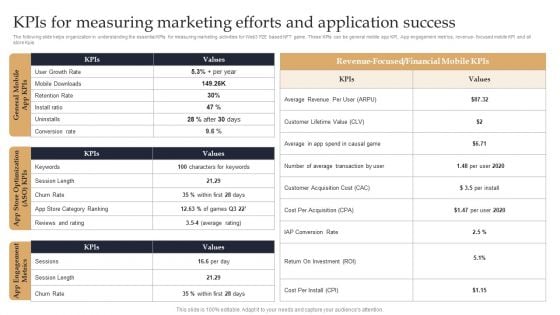
Web 3 0 Blockchain Based P2E Mobile Game Sector Report Promotional Plan Kpis For Measuring Marketing Diagrams PDF
The following slide helps organization in understanding the essential KPIs for measuring marketing activities for Web3 P2E based NFT game. These KPIs can be general mobile app KPI, App engagement metrics, revenue- focused mobile KPI and all store Kpis. Find highly impressive Web 3 0 Blockchain Based P2E Mobile Game Sector Report Promotional Plan Kpis For Measuring Marketing Diagrams PDF on Slidegeeks to deliver a meaningful presentation. You can save an ample amount of time using these presentation templates. No need to worry to prepare everything from scratch because Slidegeeks experts have already done a huge research and work for you. You need to download Web 3 0 Blockchain Based P2E Mobile Game Sector Report Promotional Plan Kpis For Measuring Marketing Topics PDF for your upcoming presentation. All the presentation templates are 100 percent editable and you can change the color and personalize the content accordingly. Download now.
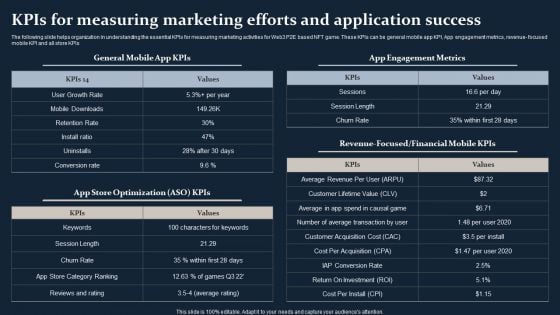
Smartphone Game Development And Advertising Technique Kpis For Measuring Marketing Efforts And Application Guidelines PDF
The following slide helps organization in understanding the essential KPIs for measuring marketing activities for Web3 P2E based NFT game. These KPIs can be general mobile app KPI, App engagement metrics, revenue focused mobile KPI and all store KPIs Present like a pro with Smartphone Game Development And Advertising Technique Kpis For Measuring Marketing Efforts And Application Guidelines PDF Create beautiful presentations together with your team, using our easy to use presentation slides. Share your ideas in real time and make changes on the fly by downloading our templates. So whether you are in the office, on the go, or in a remote location, you can stay in sync with your team and present your ideas with confidence. With Slidegeeks presentation got a whole lot easier. Grab these presentations today.
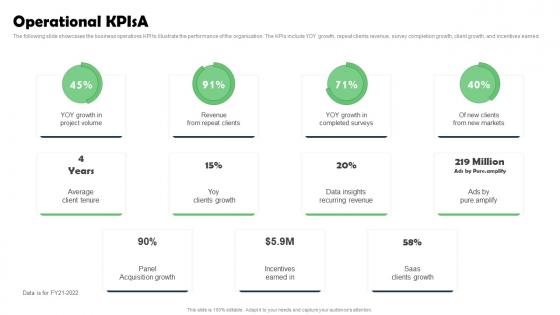
Operational KPIsA Marketing Research Services Management Business Sample Pdf
The following slide showcases the business operations KPI to illustrate the performance of the organization. The KPIs include YOY growth, repeat clients revenue, survey completion growth, client growth, and incentives earned. Are you searching for a Operational KPIsA Marketing Research Services Management Business Sample Pdf that is uncluttered, straightforward, and original It is easy to edit, and you can change the colors to suit your personal or business branding. For a presentation that expresses how much effort you have put in, this template is ideal With all of its features, including tables, diagrams, statistics, and lists, it is perfect for a business plan presentation. Make your ideas more appealing with these professional slides. Download Operational KPIsA Marketing Research Services Management Business Sample Pdf from Slidegeeks today. The following slide showcases the business operations KPI to illustrate the performance of the organization. The KPIs include YOY growth, repeat clients revenue, survey completion growth, client growth, and incentives earned.
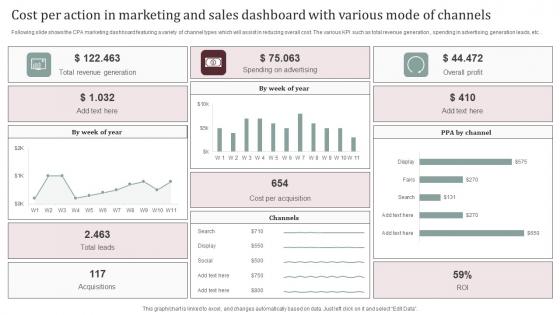
Cost Per Action In Marketing And Sales Dashboard With Various Mode Of Channels Designs Pdf
Following slide shows the CPA marketing dashboard featuring a variety of channel types which will assist in reducing overall cost. The various KPI such as total revenue generation , spending in advertising, generation leads, etc. Showcasing this set of slides titled Cost Per Action In Marketing And Sales Dashboard With Various Mode Of Channels Designs Pdf. The topics addressed in these templates are Channel, Acquisitions. All the content presented in this PPT design is completely editable. Download it and make adjustments in color, background, font etc. as per your unique business setting. Following slide shows the CPA marketing dashboard featuring a variety of channel types which will assist in reducing overall cost. The various KPI such as total revenue generation , spending in advertising, generation leads, etc.
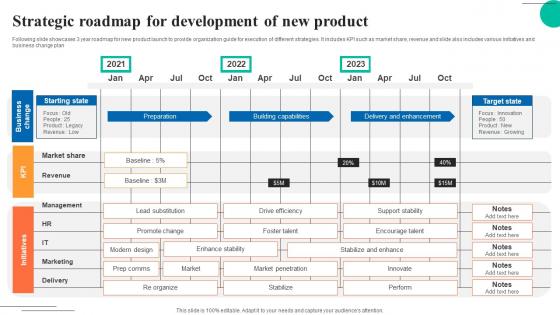
Strategic Roadmap For Development Of New Product Inspiration Pdf
Following slide showcases 3 year roadmap for new product launch to provide organization guide for execution of different strategies. It includes KPI such as market share, revenue and slide also includes various initiatives and business change plan. Pitch your topic with ease and precision using this Strategic Roadmap For Development Of New Product Inspiration Pdf. This layout presents information on Jan, Apr, Jul, Oct. It is also available for immediate download and adjustment. So, changes can be made in the color, design, graphics or any other component to create a unique layout. Following slide showcases 3 year roadmap for new product launch to provide organization guide for execution of different strategies. It includes KPI such as market share, revenue and slide also includes various initiatives and business change plan.
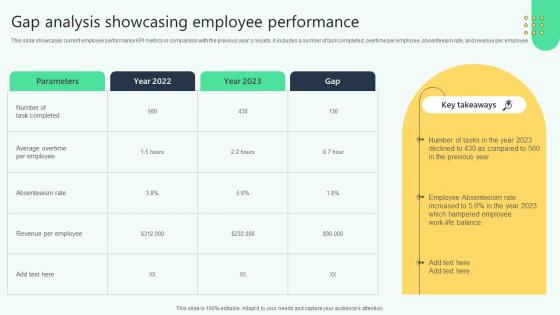
Gap Analysis Showcasing Employee Performance Analysing Hr Data For Effective Decision Making
This slide showcases current employee performance KPI metrics in comparison with the previous years results. It includes a number of task completed, overtime per employee, absenteeism rate, and revenue per employee. This modern and well-arranged Gap Analysis Showcasing Employee Performance Analysing Hr Data For Effective Decision Making provides lots of creative possibilities. It is very simple to customize and edit with the Powerpoint Software. Just drag and drop your pictures into the shapes. All facets of this template can be edited with Powerpoint, no extra software is necessary. Add your own material, put your images in the places assigned for them, adjust the colors, and then you can show your slides to the world, with an animated slide included. This slide showcases current employee performance KPI metrics in comparison with the previous years results. It includes a number of task completed, overtime per employee, absenteeism rate, and revenue per employee.

Strategies For Stabilizing Corporate Company Profit And Loss Dashboard With Income Statement
This slide provides a KPI dashboard that enables an organization to track revenue, expenses, and profit incurred in a specific period. It includes gross profit margin, OPEX ratio, operating profit margin, and net profit margin. There are so many reasons you need a Strategies For Stabilizing Corporate Company Profit And Loss Dashboard With Income Statement. The first reason is you can not spend time making everything from scratch, Thus, Slidegeeks has made presentation templates for you too. You can easily download these templates from our website easily. This slide provides a KPI dashboard that enables an organization to track revenue, expenses, and profit incurred in a specific period. It includes gross profit margin, OPEX ratio, operating profit margin, and net profit margin.

Measuring Customer Satisfaction Improving Customer Retention PPT Template
The following slide covers KPI dashboard to evaluate customer satisfaction score. It includes elements such as requests answered, total revenue, service level, cost per support, retention rate, average time taken to resolve an issue etc. This modern and well-arranged Measuring Customer Satisfaction Improving Customer Retention PPT Template provides lots of creative possibilities. It is very simple to customize and edit with the Powerpoint Software. Just drag and drop your pictures into the shapes. All facets of this template can be edited with Powerpoint, no extra software is necessary. Add your own material, put your images in the places assigned for them, adjust the colors, and then you can show your slides to the world, with an animated slide included. The following slide covers KPI dashboard to evaluate customer satisfaction score. It includes elements such as requests answered, total revenue, service level, cost per support, retention rate, average time taken to resolve an issue etc.

Measuring Customer Satisfaction Enhancing Customer Experience Ppt Sample
The following slide covers KPI dashboard to evaluate customer satisfaction score. It includes elements such as requests answered, total revenue, service level, cost per support, retention rate, average time taken to resolve an issue etc. This modern and well-arranged Measuring Customer Satisfaction Enhancing Customer Experience Ppt Sample provides lots of creative possibilities. It is very simple to customize and edit with the Powerpoint Software. Just drag and drop your pictures into the shapes. All facets of this template can be edited with Powerpoint, no extra software is necessary. Add your own material, put your images in the places assigned for them, adjust the colors, and then you can show your slides to the world, with an animated slide included. The following slide covers KPI dashboard to evaluate customer satisfaction score. It includes elements such as requests answered, total revenue, service level, cost per support, retention rate, average time taken to resolve an issue etc.
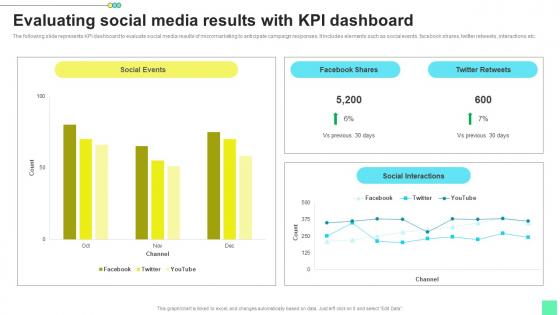
Evaluating Social Media Results Introduction To Niche Marketing Audience Segmentation Microsoft Pdf
The following slide represents KPI dashboard to evaluate social media results of micromarketing to anticipate campaign responses. It includes elements such as social events, facebook shares, twitter retweets, interactions etc. Make sure to capture your audiences attention in your business displays with our gratis customizable Evaluating Social Media Results Introduction To Niche Marketing Audience Segmentation Microsoft Pdf. These are great for business strategies, office conferences, capital raising or task suggestions. If you desire to acquire more customers for your tech business and ensure they stay satisfied, create your own sales presentation with these plain slides. The following slide represents KPI dashboard to evaluate social media results of micromarketing to anticipate campaign responses. It includes elements such as social events, facebook shares, twitter retweets, interactions etc.
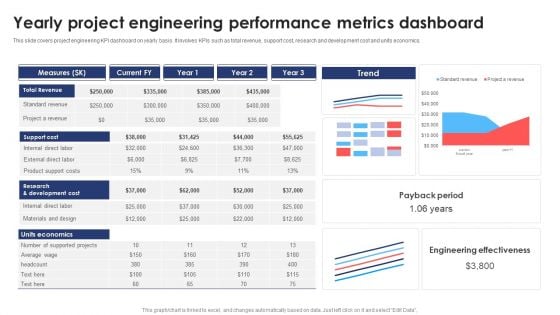
Yearly Project Engineering Performance Metrics Dashboard Information PDF
This slide covers project engineering KPI dashboard on yearly basis. It involves KPIs such as total revenue, support cost, research and development cost and units economics. Pitch your topic with ease and precision using this Yearly Project Engineering Performance Metrics Dashboard Information PDF. This layout presents information on Support Cost, Revenue, Measures. It is also available for immediate download and adjustment. So, changes can be made in the color, design, graphics or any other component to create a unique layout.

Agile QA Procedure Reasons Behind Decrease In Revenues Elements PDF
This slide depicts the reasons behind decrease in the number of projects. So, Approximately 50 parcent of the projects were of poor quality, which eventually lead to decline in revenues. Deliver and pitch your topic in the best possible manner with this agile qa procedure quality control kpi dashboard topics pdf. Use them to share invaluable insights on reasons behind decrease in revenues and impress your audience. This template can be altered and modified as per your expectations. So, grab it now.
Essentials Of Statistics For Business And Economics Ppt Powerpoint Presentation Pictures Styles
This is a essentials of statistics for business and economics ppt powerpoint presentation pictures styles. This is a three stage process. The stages in this process are business metrics, business kpi, business dashboard.

Calculator With Business Reports For Operational Efficiency Ppt Powerpoint Presentation Ideas Infographic Template
This is a calculator with business reports for operational efficiency ppt powerpoint presentation ideas infographic template. This is a four stage process. The stages in this process are business metrics, business kpi, business dashboard.
Track Business Performance And Profitability Ppt Powerpoint Presentation File Master Slide
This is a track business performance and profitability ppt powerpoint presentation file master slide. This is a four stage process. The stages in this process are business metrics, business kpi, business dashboard.
Online Customer Interaction Referral Program Performance Tracking Dashboard Sample PDF
This slide covers the KPI dashboard for analyzing referral campaign results. It includes metrics such as total revenue generated, monthly recurring revenue, new customers, clicks, cancelled customers, paying customers, etc. Deliver an awe inspiring pitch with this creative Online Customer Interaction Referral Program Performance Tracking Dashboard Sample PDF bundle. Topics like Revenue Generated, Recurring Revenue, Paying Customers can be discussed with this completely editable template. It is available for immediate download depending on the needs and requirements of the user.
Referral Program Performance Tracking Dashboard Elements PDF
This slide covers the KPI dashboard for analyzing referral campaign results. It includes metrics such as total revenue generated, monthly recurring revenue, new customers, clicks, cancelled customers, paying customers, etc. Deliver an awe inspiring pitch with this creative Referral Program Performance Tracking Dashboard Elements PDF bundle. Topics like Dashboard, Monthly Recurring Revenue, Paying Customers can be discussed with this completely editable template. It is available for immediate download depending on the needs and requirements of the user.
E Commerce Transactions Performance Tracking Dashboard Topics PDF
This slide displays KPI dashboard to help company in tracking and monitoring total online purchases made. It includes metrics such as revenue, customers, average price, top articles sold, etc. Showcasing this set of slides titled E Commerce Transactions Performance Tracking Dashboard Topics PDF. The topics addressed in these templates are Total Customers, Division, Revenue. All the content presented in this PPT design is completely editable. Download it and make adjustments in color, background, font etc. as per your unique business setting.
Online Customer Interaction Loyalty Program Performance Tracking Dashboard Rules PDF
This slide covers the KPI dashboard for analyzing customer loyalty campaign results. It includes metrics such as revenue, liability, NQP accrued, transaction count, members, redemption ratio, etc.Deliver an awe inspiring pitch with this creative Online Customer Interaction Loyalty Program Performance Tracking Dashboard Rules PDF bundle. Topics like Revenue Liability, Transaction Count, Redemption Ratio can be discussed with this completely editable template. It is available for immediate download depending on the needs and requirements of the user.


 Continue with Email

 Home
Home


