Financial Literacy
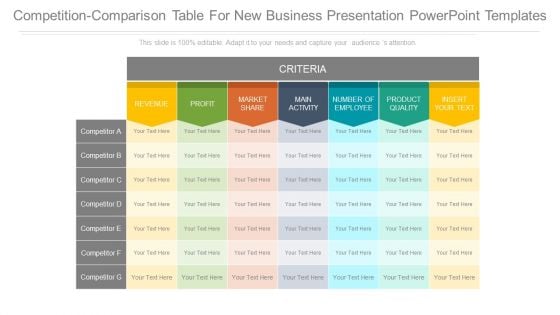
Competition Comparison Table For New Business Presentation Powerpoint Templates
This is a competition comparison table for new business presentation powerpoint templates. This is a seven stage process. The stages in this process are criteria, revenue, profit, market share, main activity, number of employee, product quality, insert your text.
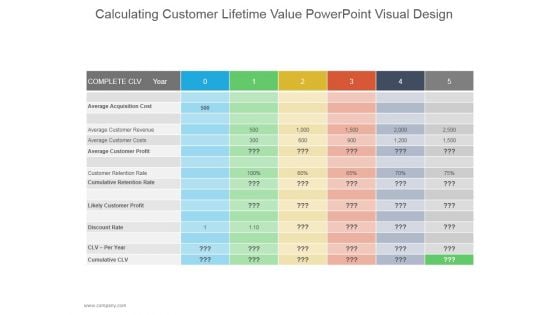
Calculating Customer Lifetime Value Ppt PowerPoint Presentation Introduction
This is a calculating customer lifetime value ppt powerpoint presentation introduction. This is a five stage process. The stages in this process are average acquisition cost, average customer revenue, likely customer profit.
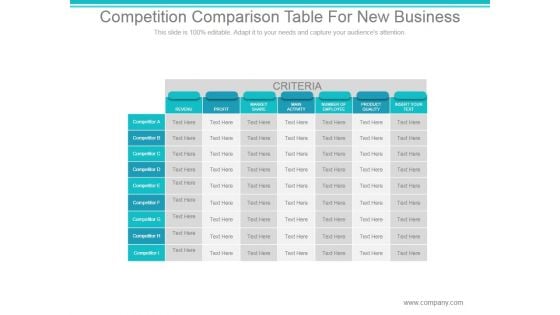
Competition Comparison Table For New Business Ppt PowerPoint Presentation Slides
This is a competition comparison table for new business ppt powerpoint presentation slides. This is a seven stage process. The stages in this process are criteria, revenue, profit, market share, main activity, number of employee, product quality, competitor.
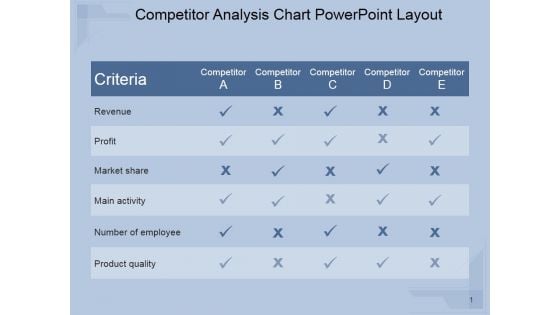
Competitor Analysis Chart Ppt PowerPoint Presentation Visuals
This is a competitor analysis chart ppt powerpoint presentation visuals. This is a five stage process. The stages in this process are revenue, profit, market share, main activity, number of employee, product quality.
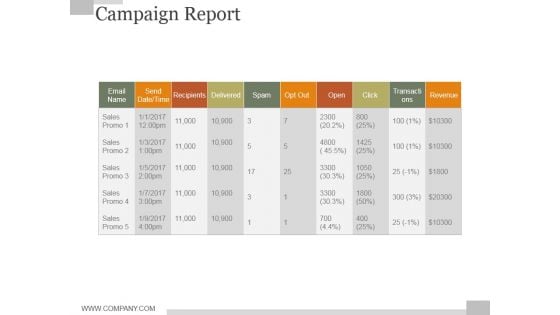
Campaign Report Ppt PowerPoint Presentation Example File
This is a campaign report ppt powerpoint presentation example file. This is a nine stage process. The stages in this process are send date time, recipients, delivered, spam, opt out, open, click, transactions, revenue.
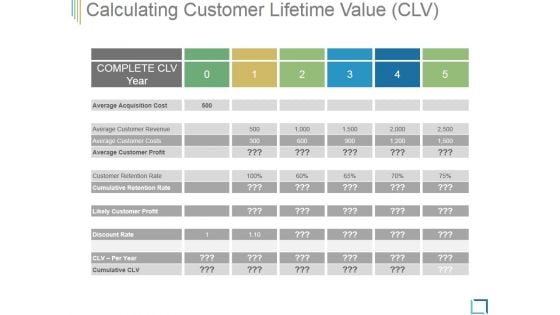
Calculating Customer Lifetime Value Ppt PowerPoint Presentation Templates
This is a calculating customer lifetime value ppt powerpoint presentation templates. This is a five stage process. The stages in this process are average acquisition cost, average customer revenue, average customer costs, average customer profit, customer retention rate.
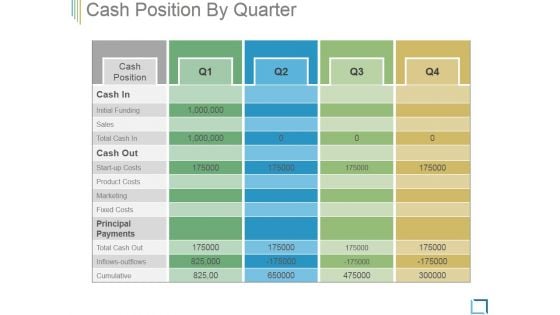
Cash Position By Quarter Ppt PowerPoint Presentation Model
This is a cash position by quarter ppt powerpoint presentation model. This is a four stage process. The stages in this process are average acquisition cost, average customer revenue, average customer costs, average customer profit, customer retention rate.
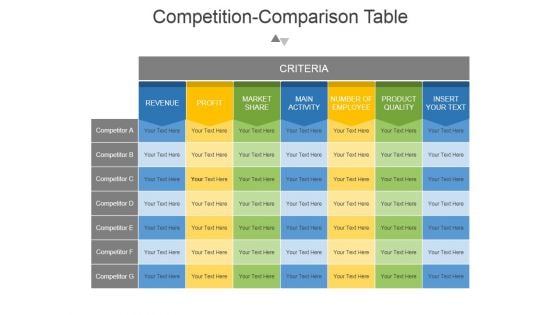
Competition Comparison Table Ppt PowerPoint Presentation Backgrounds
This is a competition comparison table ppt powerpoint presentation backgrounds. This is a seven stage process. The stages in this process are revenue, profit, market share , main activity, number of employee, product quality , insert your text.
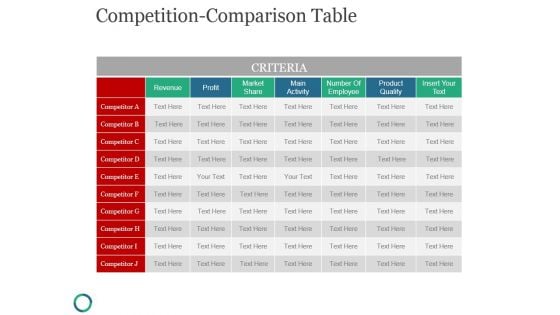
Competition Comparison Table Ppt PowerPoint Presentation Microsoft
This is a competition comparison table ppt powerpoint presentation microsoft. This is a seven stage process. The stages in this process are criteria, revenue, market share, number of employee, insert your text.
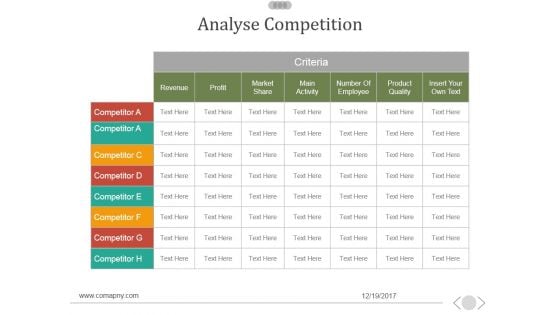
Analyse Competition Ppt PowerPoint Presentation Themes
This is a analyse competition ppt powerpoint presentation themes. This is a seven stage process. The stages in this process are profit, revenue, market share, main activity, number of employee.
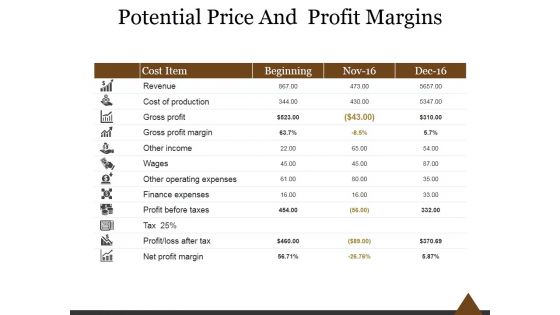
Potential Price And Profit Margins Ppt PowerPoint Presentation Infographics
This is a potential price and profit margins ppt powerpoint presentation infographics. This is a four stage process. The stages in this process are cost item, revenue, cost of production, gross profit, gross profit margin.
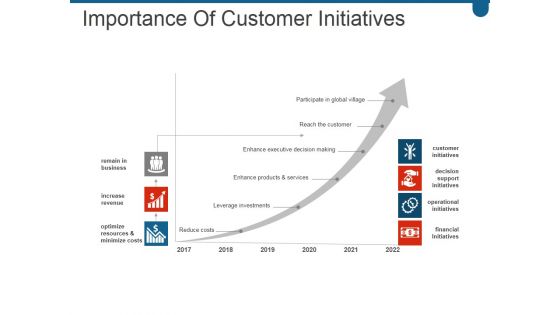
Importance Of Customer Initiatives Ppt PowerPoint Presentation Microsoft
This is a importance of customer initiatives ppt powerpoint presentation microsoft. This is a six stage process. The stages in this process are remain in business, increase revenue, optimize resources and minimize costs, customer initiatives, decision support initiatives.
Campaign Report Ppt PowerPoint Presentation Icon Visuals
This is a campaign report ppt powerpoint presentation icon visuals. This is a ten stage process. The stages in this process are email name, send date time, recipients, delivered, spam, opt out, revenue.
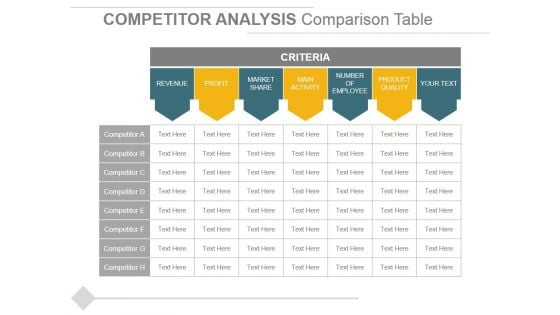
Competitor Analysis Comparison Table Ppt PowerPoint Presentation Outline Slides
This is a competitor analysis comparison table ppt powerpoint presentation outline slides. This is a two stage process. The stages in this process are revenue, profit, market share, main activity, number of employee, product quality.
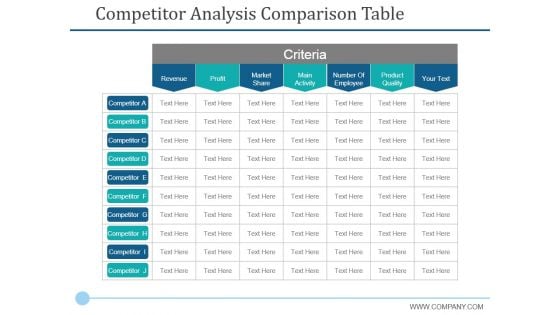
Competitor Analysis Comparison Table Ppt PowerPoint Presentation Infographic Template Graphics
This is a competitor analysis comparison table ppt powerpoint presentation infographic template graphics. This is a seven stage process. The stages in this process are profit, revenue, market share, main activity, criteria.

Calculating Customer Lifetime Value Clv Ppt Powerpoint Presentation Slides Aids
This is a calculating customer lifetime value clv ppt powerpoint presentation slides aids. This is a four stage process. The stages in this process are complete clv year, average acquisition cost, average customer revenue.
Calculating Customer Lifetime Value Clv Ppt PowerPoint Presentation Show Icon
This is a calculating customer lifetime value clv ppt powerpoint presentation show icon. This is a five stage process. The stages in this process are average acquisition cost, average customer revenue, average customer costs, average customer profit, customer retention rate.
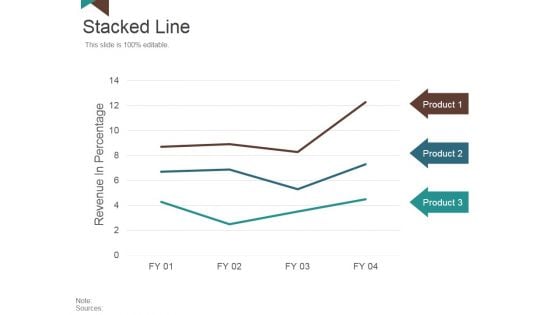
Stacked Line Ppt PowerPoint Presentation Professional Graphics
This is a stacked line ppt powerpoint presentation professional graphics. This is a three stage process. The stages in this process are revenue in percentage, product, business, marketing, success.
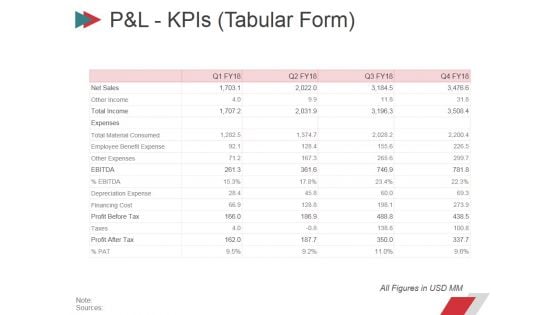
Pandl Kpis Tabular Form Ppt PowerPoint Presentation Summary Layout
This is a pandl kpis tabular form ppt powerpoint presentation summary layout. This is a four stage process. The stages in this process are revenue, cogs, operating profit, net profit.
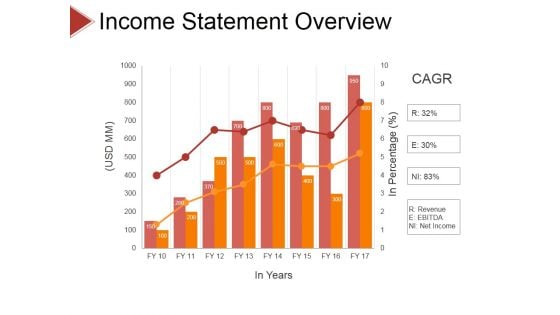
Income Statement Overview Ppt PowerPoint Presentation Slides Samples
This is a income statement overview ppt powerpoint presentation slides samples. This is a eight stage process. The stages in this process are business, strategy, analysis, pretention, revenue, ebitda, net income.
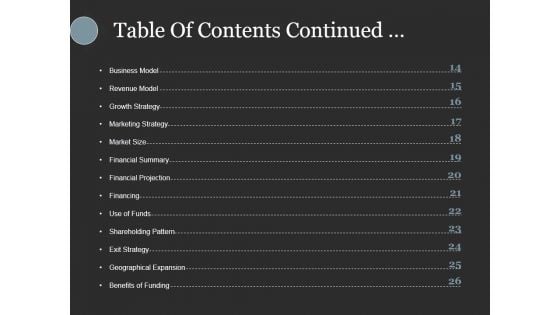
Table Of Contents Continued Ppt PowerPoint Presentation Inspiration Slides
This is a table of contents continued ppt powerpoint presentation inspiration slides. This is a fourteen stage process. The stages in this process are business model, revenue model, growth strategy, marketing strategy, market size.
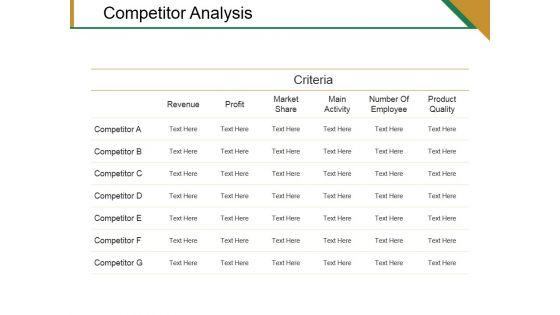
Competitor Analysis Ppt PowerPoint Presentation Pictures Designs Download
This is a competitor analysis ppt powerpoint presentation pictures designs download. This is a six stage process. The stages in this process are revenue, profit, market share, main activity, number of employee, product quality.
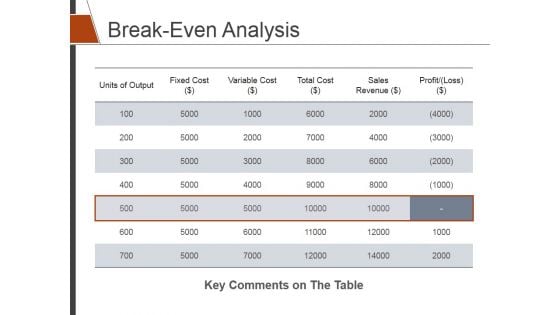
Break Even Analysis Ppt PowerPoint Presentation Summary Background Designs
This is a break even analysis ppt powerpoint presentation summary background designs. This is a five stage process. The stages in this process are units of output, fixed cost, variable cost, total cost, sales revenue.
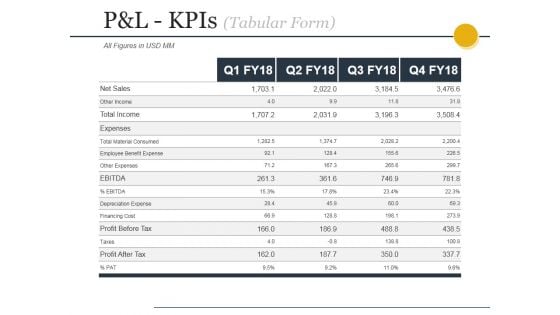
Pandl Kpis Tabular Form Ppt PowerPoint Presentation File Design Templates
This is a pandl kpis tabular form ppt powerpoint presentation file design templates. This is a four stage process. The stages in this process are revenue, cogs, operating profit, net profit.
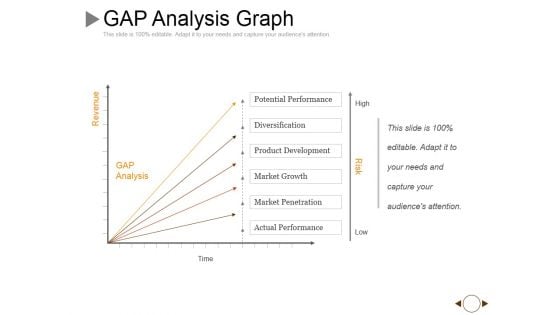
Gap Analysis Graph Ppt PowerPoint Presentation Slides Graphics Pictures
This is a gap analysis graph ppt powerpoint presentation slides graphics pictures. This is a five stage process. The stages in this process are revenue, time, high, low, risk.
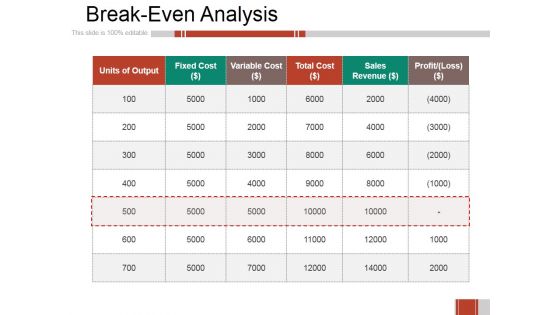
Breakeven Analysis Ppt PowerPoint Presentation Professional Design Templates
This is a breakeven analysis ppt powerpoint presentation professional design templates. This is a six stage process. The stages in this process are units of output, fixed cost, variable cost, total cost, sales revenue.
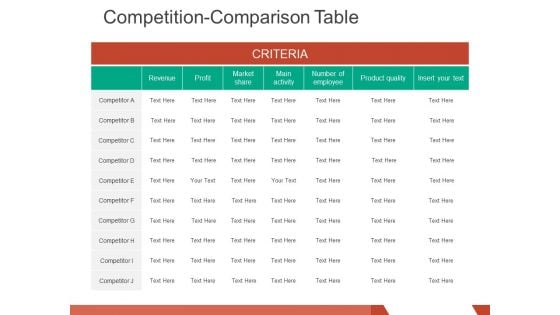
competition comparison table ppt powerpoint presentation infographics design inspiration
This is a competition comparison table ppt powerpoint presentation infographics design inspiration. This is a seven stage process. The stages in this process are revenue, profit, market share, main activity, number of employee.
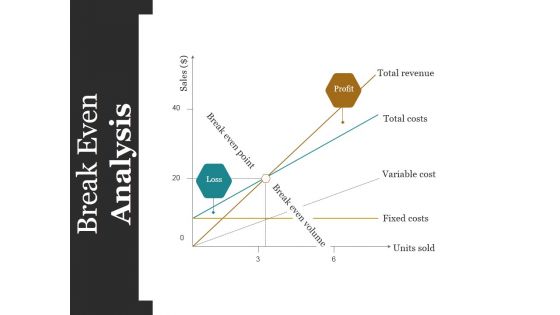
Break Even Analysis Ppt PowerPoint Presentation Inspiration Layouts
This is a break even analysis ppt powerpoint presentation inspiration layouts. This is a three stage process. The stages in this process are total revenue, total costs, variable cost, fixed costs, units sold.
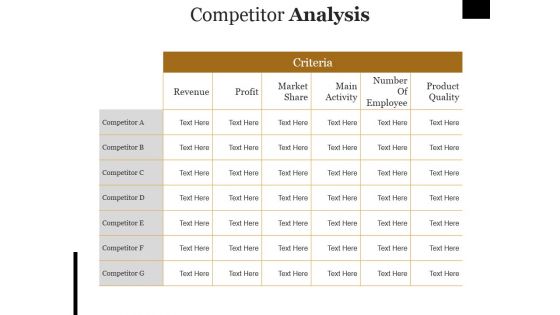
Competitor Analysis Ppt PowerPoint Presentation Outline Rules
This is a competitor analysis ppt powerpoint presentation outline rules. This is a seven stage process. The stages in this process are revenue, profit, market share, main activity, number of employee.
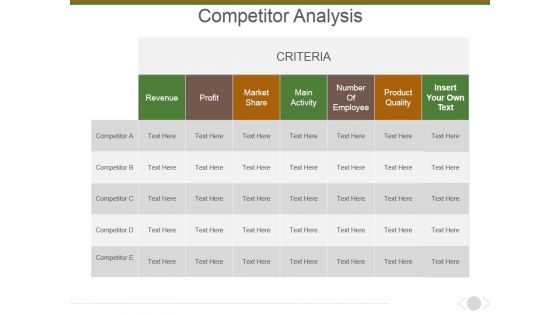
Competitor Analysis Ppt PowerPoint Presentation Layouts Background Image
This is a competitor analysis ppt powerpoint presentation layouts background image. This is a five stage process. The stages in this process are profit, revenue, market share, main activity, number of employee, product quality.
Competitor Analysis Ppt PowerPoint Presentation Ideas Icons
This is a competitor analysis ppt powerpoint presentation ideas icons. This is a seven stage process. The stages in this process are revenue, profit, market share, main activity, number of employee.
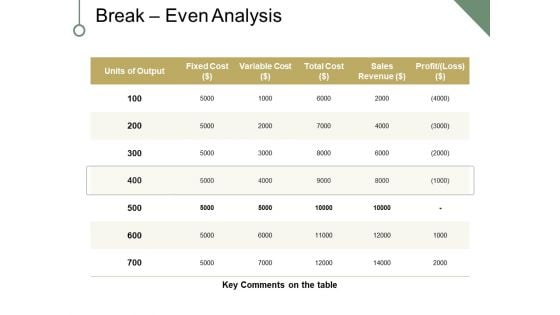
Break Even Analysis Ppt PowerPoint Presentation Portfolio Clipart
This is a break even analysis ppt powerpoint presentation portfolio clipart. This is a five stage process. The stages in this process are fixed cost, variable cost, sales revenue, profit, key comments on the table, units of output.
Comparison Based On Criteria Ppt PowerPoint Presentation Show Icon
This is a comparison based on criteria ppt powerpoint presentation show icon. This is a six stage process. The stages in this process are revenue, profit, market share, main activity, number of employee.
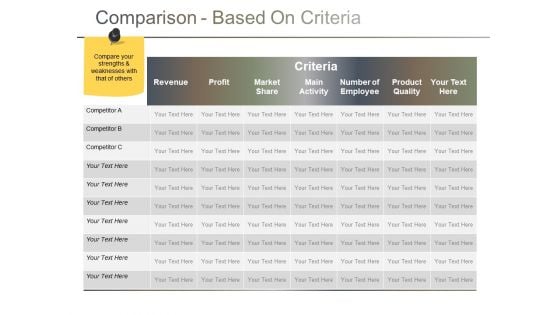
Comparison Based On Criteria Ppt PowerPoint Presentation Gallery Themes
This is a comparison based on criteria ppt powerpoint presentation gallery themes. This is a seven stage process. The stages in this process are revenue, profit, market share, main activity, product quality.

Comparison Based On Criteria Ppt PowerPoint Presentation Gallery Sample
This is a comparison based on criteria ppt powerpoint presentation gallery sample. This is a six stage process. The stages in this process are revenue, profit, market share, main activity, number of employee.

Comparison Based On Criteria Ppt PowerPoint Presentation Show File Formats
This is a comparison based on criteria ppt powerpoint presentation show file formats. This is a six stage process. The stages in this process are revenue, profit, market share, main activity, number of employee.
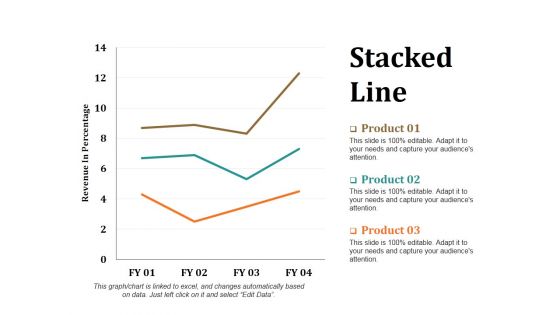
Stacked Line Ppt PowerPoint Presentation Layouts Portrait
This is a stacked line ppt powerpoint presentation layouts portrait. This is a three stage process. The stages in this process are revenue in percentage, stacked line, product, growth, success.
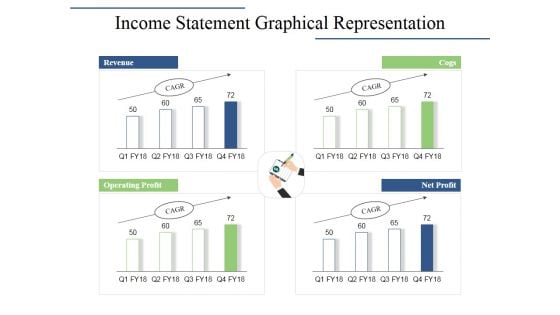
Income Statement Graphical Representation Ppt PowerPoint Presentation Infographics Layouts
This is a income statement graphical representation ppt powerpoint presentation infographics layouts. This is a four stage process. The stages in this process are revenue, cogs, operating profit, net profit.
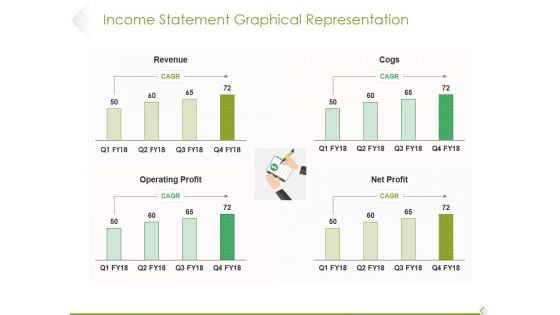
Income Statement Graphical Representation Ppt PowerPoint Presentation Infographic Template Influencers
This is a income statement graphical representation ppt powerpoint presentation infographic template influencers. This is a four stage process. The stages in this process are revenue, cogs, operating profit, profit.
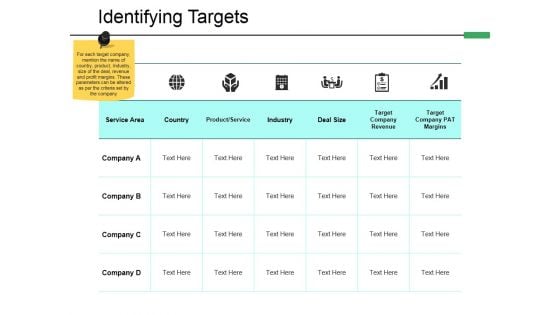
Identifying Targets Ppt PowerPoint Presentation File Templates
This is a identifying targets ppt powerpoint presentation file templates. This is a six stage process. The stages in this process are country, industry, deal size, target company revenue, product service.
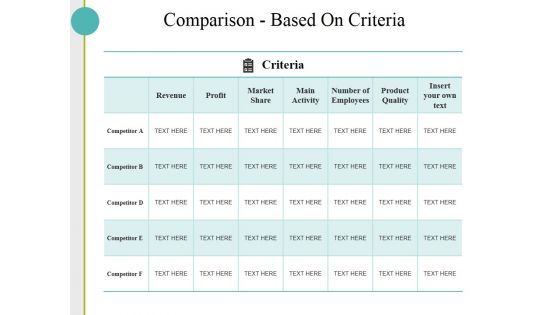
Comparison Based On Criteria Ppt PowerPoint Presentation Slides Skills
This is a comparison based on criteria ppt powerpoint presentation slides skills. This is a five stage process. The stages in this process are revenue, profit, market share, main activity, number of employees, product quality.
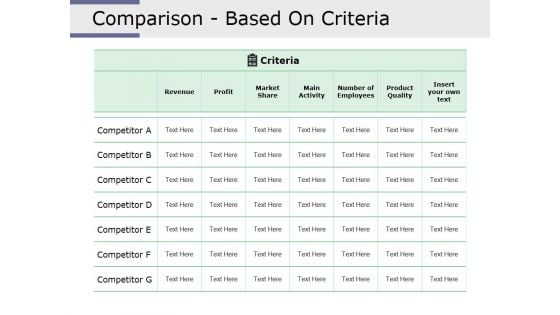
Comparison Based On Criteria Ppt PowerPoint Presentation Infographic Template Layout Ideas
This is a comparison based on criteria ppt powerpoint presentation infographic template layout ideas. This is a seven stage process. The stages in this process are revenue, profit, market share, main activity, number of employees, product quality.
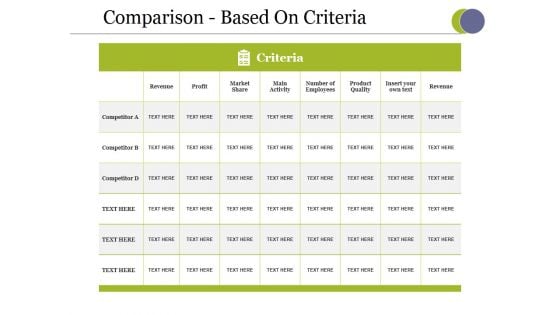
Comparison Based On Criteria Ppt PowerPoint Presentation Styles Designs
This is a comparison based on criteria ppt powerpoint presentation styles designs. This is a three stage process. The stages in this process are revenue, profit, market share, main activity, number of employees, product quality.
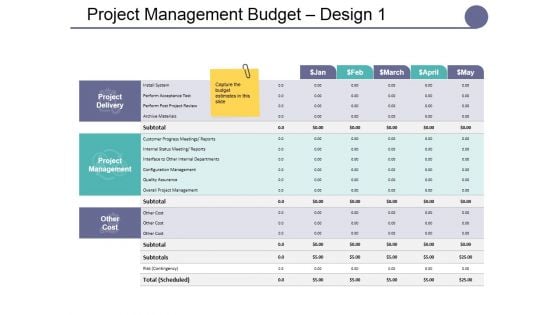
Project Management Budget Design Template 1 Ppt PowerPoint Presentation Show Model
This is a project management budget design template 1 ppt powerpoint presentation show model. This is a four stage process. The stages in this process are internal funding, department budget, existing revenue streams, government grants, itemized income.
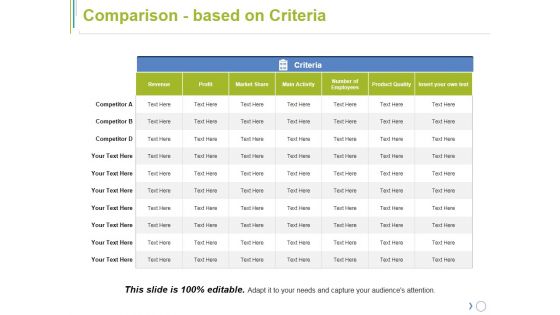
Comparison Based On Criteria Ppt PowerPoint Presentation Model Inspiration
This is a comparison based on criteria ppt powerpoint presentation model inspiration. This is a seven stage process. The stages in this process are revenue, profit, market share, number of employees, product quality.
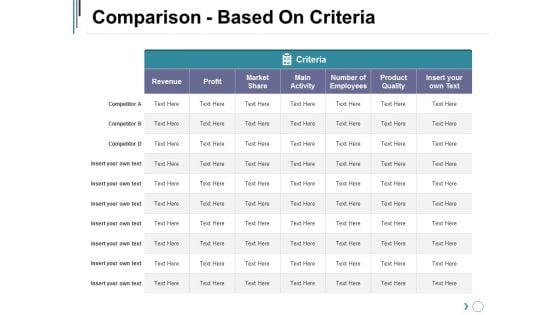
Comparison Based On Criteria Ppt PowerPoint Presentation Show Background Image
This is a comparison based on criteria ppt powerpoint presentation show background image. This is a seven stage process. The stages in this process are revenue, market share, main activity, number of employees, product quality, insert your own text.
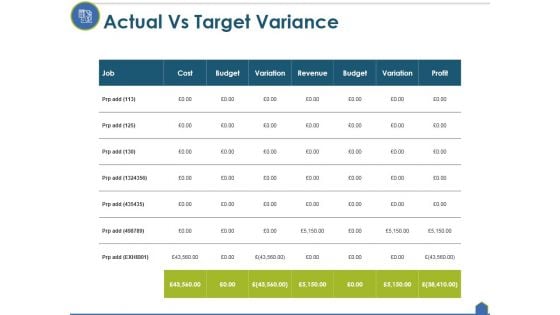
Actual Vs Target Variance Ppt PowerPoint Presentation Professional Clipart Images
This is a actual vs target variance ppt powerpoint presentation professional clipart images. This is a seven stage process. The stages in this process are cost, budget, variation, revenue, profit.
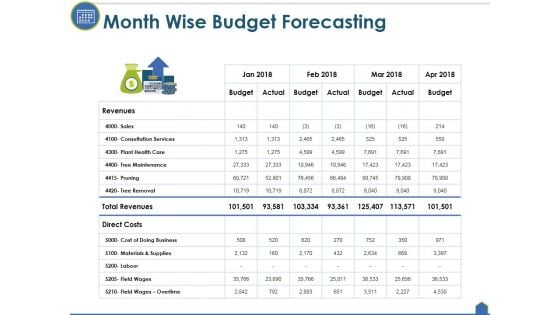
Month Wise Budget Forecasting Ppt PowerPoint Presentation Slides Format
This is a month wise budget forecasting ppt powerpoint presentation slides format. This is a four stage process. The stages in this process are budget, actual, revenues, direct costs.
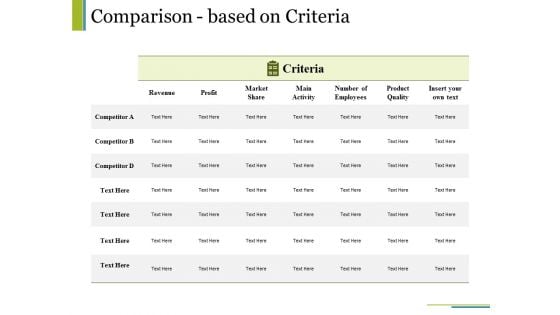
Comparison Based On Criteria Ppt PowerPoint Presentation File Templates
This is a comparison based on criteria ppt powerpoint presentation file templates. This is a seven stage process. The stages in this process are revenue, market share, main activity, number of employees, product quality, insert your own text.
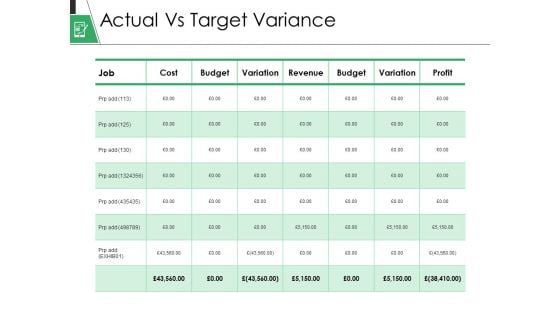
Actual Vs Target Variance Ppt PowerPoint Presentation Gallery Background
This is a actual vs target variance ppt powerpoint presentation gallery background. This is a eight stage process. The stages in this process are Cost, Budget, Variation, Revenue, Budget.
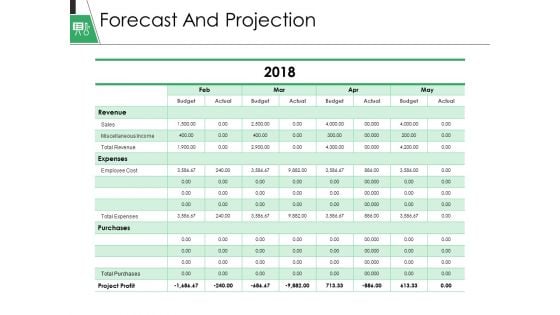
Forecast And Projection Ppt PowerPoint Presentation Gallery Display
This is a forecast and projection ppt powerpoint presentation gallery display. This is a four stage process. The stages in this process are revenue, expenses, purchases, project profit, budget.
Income Statement Overview Ppt PowerPoint Presentation Infographic Template Icon
This is a income statement overview ppt powerpoint presentation infographic template icon. This is a five stage process. The stages in this process are revenue, profit margin, operating profit margin.
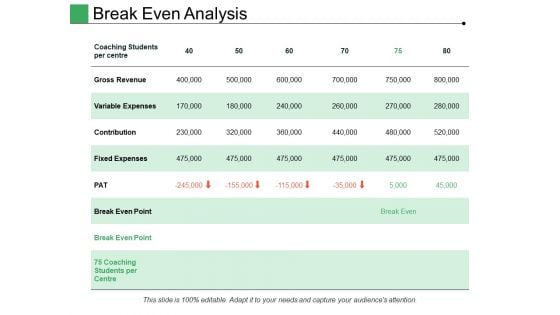
Break Even Analysis Ppt PowerPoint Presentation Inspiration Example Introduction
This is a break even analysis ppt powerpoint presentation inspiration example introduction. This is a four stage process. The stages in this process are gross revenue, variable expenses, contribution, break even point, pat.
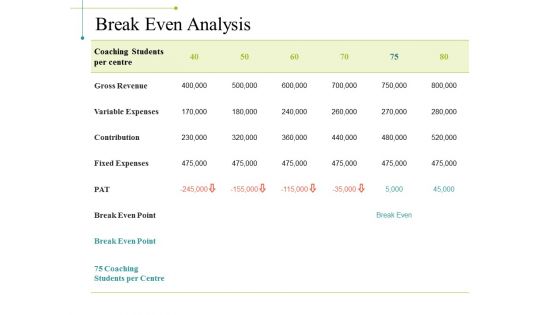
Break Even Analysis Ppt PowerPoint Presentation Model Example File
This is a break even analysis ppt powerpoint presentation model example file. This is a six stage process. The stages in this process are gross revenue, variable expenses, contribution, fixed expenses, break even point.

Comparison Based On Criteria Ppt PowerPoint Presentation Infographic Template Graphic Tips
This is a comparison based on criteria ppt powerpoint presentation infographic template graphic tips. This is a seven stage process. The stages in this process are revenue, market share, main activity, number of employee, product quality.

Executive Summary Ppt PowerPoint Presentation Outline Diagrams
This is a executive summary ppt powerpoint presentation outline diagrams. This is a two stage process. The stages in this process are revenue, profits, operational cost, total customers, marketing channels.
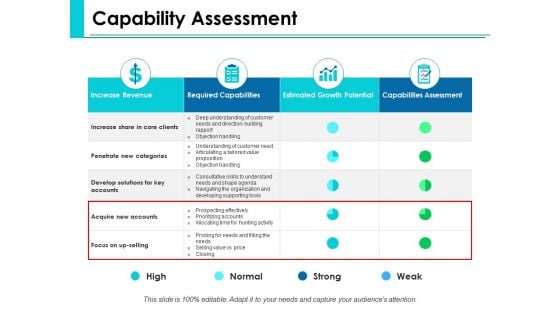
Capability Assessment Ppt PowerPoint Presentation Infographics Clipart
This is a capability assessment ppt powerpoint presentation infographics clipart. This is a four stage process. The stages in this process are increase revenue, required capabilities, estimated growth potential, capabilities assessment.

Capability Assessment Ppt PowerPoint Presentation Slides Themes
This is a capability assessment ppt powerpoint presentation slides themes. This is a four stage process. The stages in this process are increase revenue, required capabilities, estimated growth potential, capabilities assessment.
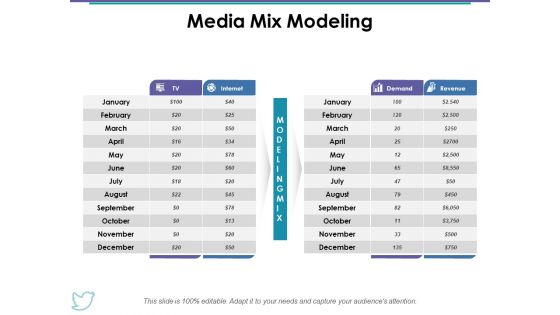
Media Mix Modeling Ppt PowerPoint Presentation Gallery Example
This is a media mix modeling ppt powerpoint presentation gallery example. This is a two stage process. The stages in this process are media mix modeling, demand, revenue, business, table.
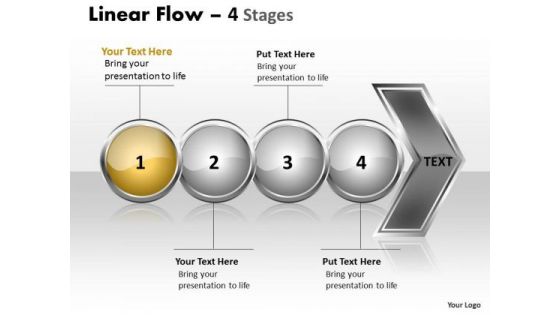
Business Ppt Background Circular Flow Of 4 Stages Time Management PowerPoint 1 Graphic
We present our Business PPT Background circular Flow of 4 stages time management PowerPoint 1 Graphic. Use our Spheres PowerPoint Templates because, are the Tools of the Trade. Use our Business PowerPoint Templates because, you have the moves to sway the market. Use our Arrows PowerPoint Templates because, you have good reasons to back up the strength of your belief. Use our Symbol PowerPoint Templates because, you have it all down to a nicety, slice by slice, layer by layer. Use our Process and Flows PowerPoint Templates because; amplify on this basic corporate concept and forefront the benefits of overlapping processes to arrive at common goals. Use these PowerPoint slides for presentations relating to Abstract, Arrow, Blank, Business, Chart, Circular, Circulation, Concept, Conceptual, Design, Diagram, Executive, Icon, Idea, Illustration, Linear, Flow, Management, Model, Numbers, Organization, Procedure, Process, Progression, Resource, Sequence, Sequential, Stages, Steps, Strategy. The prominent colors used in the PowerPoint template are Yellow, Gray, and Black Design goals with our Business Ppt Background Circular Flow Of 4 Stages Time Management PowerPoint 1 Graphic. Download without worries with our money back guaranteee.


 Continue with Email

 Home
Home


