Financial Planning Process
Bar Chart Ppt PowerPoint Presentation Infographics Icon
This is a bar chart ppt powerpoint presentation infographics icon. This is a three stage process. The stages in this process are product, bar graph, success, business, growth.
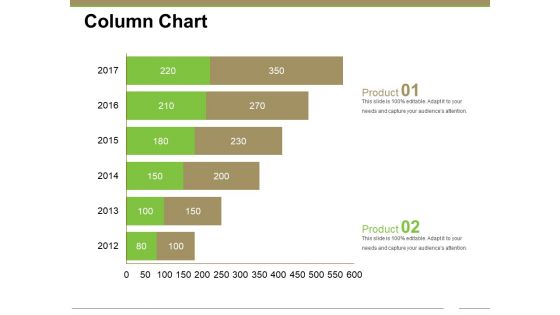
Column Chart Ppt PowerPoint Presentation Gallery Styles
This is a column chart ppt powerpoint presentation gallery styles. This is a two stage process. The stages in this process are years, graph, business, marketing, finance.
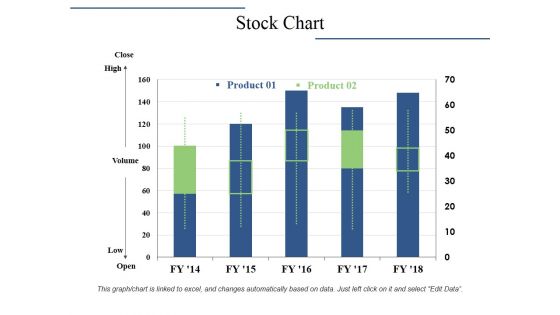
Stock Chart Ppt PowerPoint Presentation Model Grid
This is a stock chart ppt powerpoint presentation model grid. This is a two stage process. The stages in this process are close, high, volume, low, open, product.
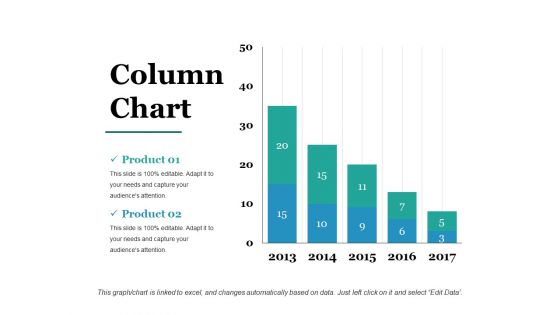
Column Chart Ppt PowerPoint Presentation Styles Picture
This is a column chart ppt powerpoint presentation styles picture. This is a five stage process. The stages in this process are years, business, marketing, graph, finance.
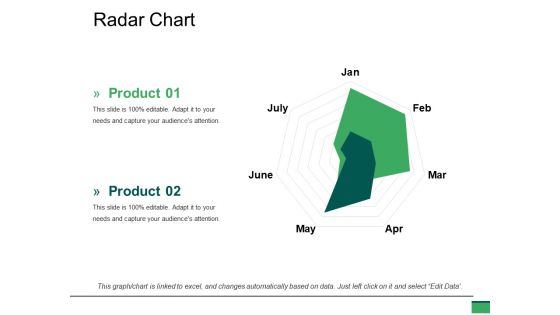
Radar Chart Ppt PowerPoint Presentation Summary Slides
This is a radar chart ppt powerpoint presentation summary slides. This is a two stage process. The stages in this process are marketing, finance, radar, business, marketing.
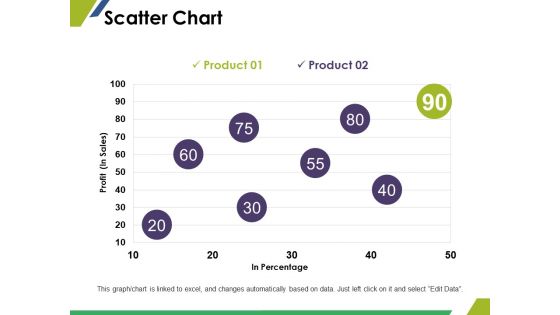
Scatter Chart Ppt PowerPoint Presentation Styles Images
This is a scatter chart ppt powerpoint presentation styles images. This is a two stage process. The stages in this process are in percentage, profit, finance, marketing, business.
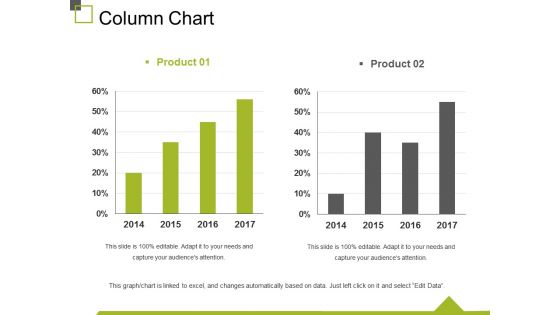
Column Chart Ppt PowerPoint Presentation Summary Slides
This is a column chart ppt powerpoint presentation summary slides. This is a two stage process. The stages in this process are finance, marketing, business, graph, years.
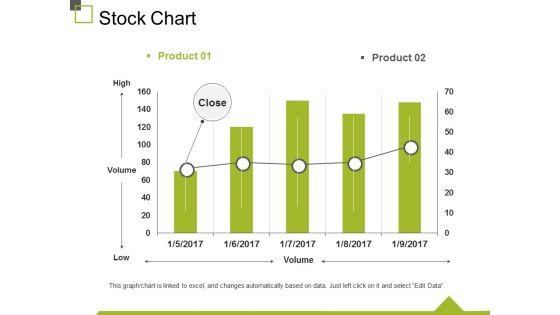
Stock Chart Ppt PowerPoint Presentation Summary Graphics
This is a stock chart ppt powerpoint presentation summary graphics. This is a two stage process. The stages in this process are High, Volume, Low, Business, Marketing.
Radar Chart Ppt PowerPoint Presentation Slides Icon
This is a radar chart ppt powerpoint presentation slides icon. This is a two stage process. The stages in this process are business, marketing, growth, success, radar.
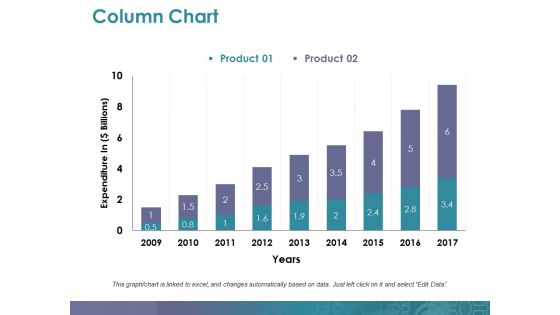
Column Chart Ppt PowerPoint Presentation Summary Deck
This is a column chart ppt powerpoint presentation summary deck. This is a two stage process. The stages in this process are expenditure in, years, business, marketing, graph.
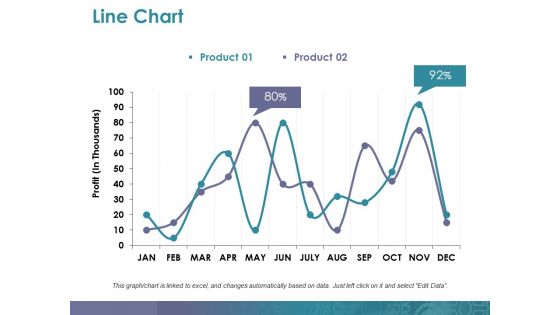
Line Chart Ppt PowerPoint Presentation Summary Rules
This is a line chart ppt powerpoint presentation summary rules. This is a two stage process. The stages in this process are profit, business, marketing, graph, finance.
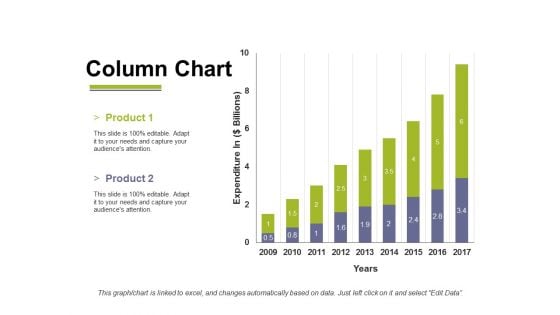
Column Chart Ppt PowerPoint Presentation File Inspiration
This is a column chart ppt powerpoint presentation file inspiration. This is a two stage process. The stages in this process are business, marketing, years, expenditure in, graph.
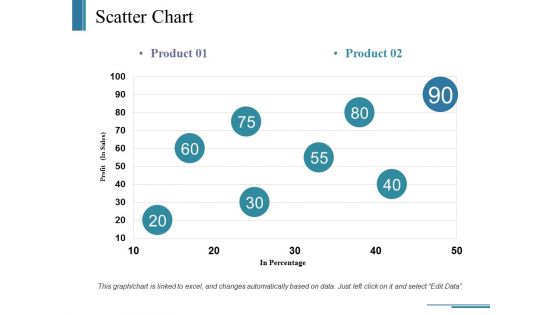
Scatter Chart Ppt PowerPoint Presentation Ideas Example
This is a scatter chart ppt powerpoint presentation ideas example. This is a two stage process. The stages in this process are business, in percentage, profit, marketing, graph.
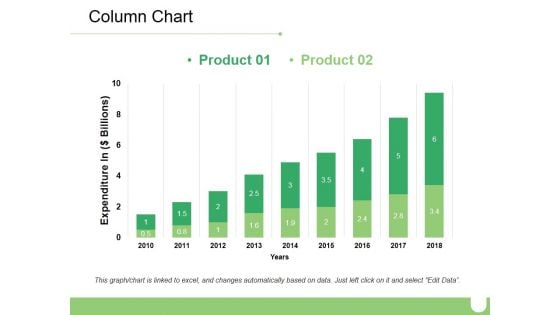
Column Chart Ppt PowerPoint Presentation Show Example
This is a column chart ppt powerpoint presentation show example. This is a two stage process. The stages in this process are business, marketing, expenditure in, finance, years.

Column Chart Ppt PowerPoint Presentation Ideas Deck
This is a column chart ppt powerpoint presentation ideas deck. This is a two stage process. The stages in this process are business, marketing, dollars, in years, graph.
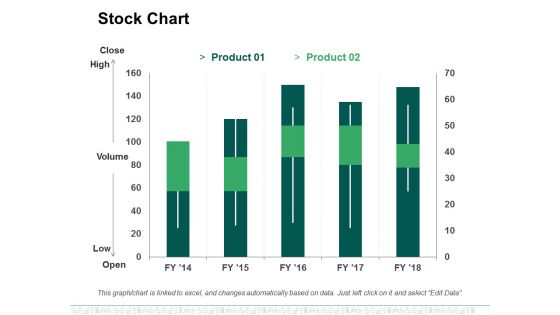
Stock Chart Ppt PowerPoint Presentation Show
This is a stock chart ppt powerpoint presentation show. This is a two stage process. The stages in this process are high, volume, low, business, marketing.
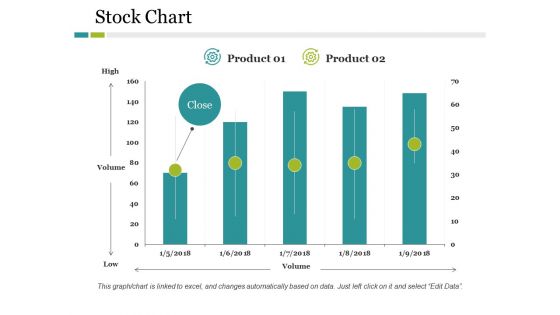
Stock Chart Ppt PowerPoint Presentation Layouts Portfolio
This is a stock chart ppt powerpoint presentation layouts portfolio. This is a two stage process. The stages in this process are business, marketing, high, volume, low, finance.
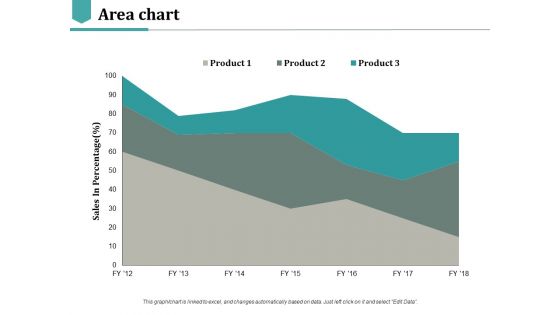
Area Chart Ppt PowerPoint Presentation Styles Ideas
This is a area chart ppt powerpoint presentation styles ideas. This is a three stage process. The stages in this process are percentage, product, business.
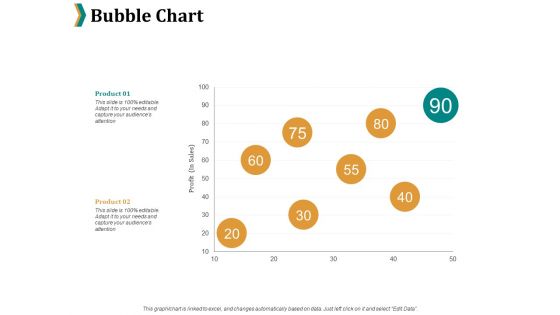
Bubble Chart Ppt PowerPoint Presentation Background Designs
This is a bubble chart ppt powerpoint presentation background designs. This is a two stage process. The stages in this process are product, percentage, marketing, business.
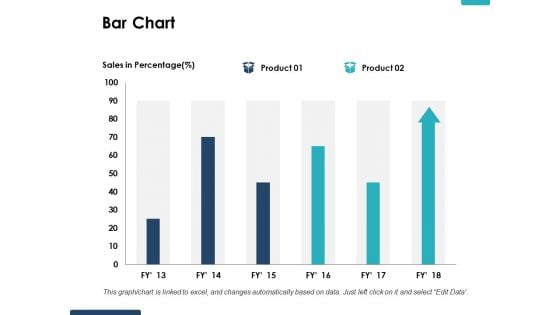
Bar Chart Ppt PowerPoint Presentation Show Deck
This is a bar chart ppt powerpoint presentation show deck. This is a two stage process. The stages in this process are percentage, product, business, marketing.
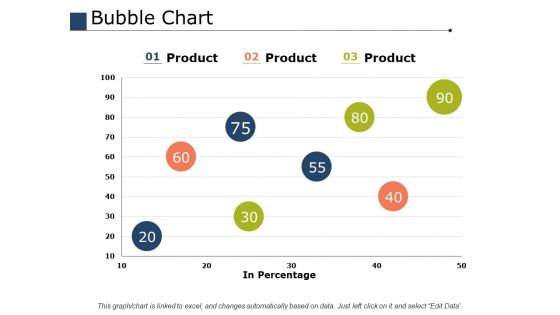
Bubble Chart Ppt PowerPoint Presentation Ideas Images
This is a bubble chart ppt powerpoint presentation ideas images. This is a three stage process. The stages in this process are percentage, product, marketing, business.
Area Chart Ppt PowerPoint Presentation Icon Smartart
This is a area chart ppt powerpoint presentation icon smartart. This is a two stage process. The stages in this process are percentage, product, business, marketing.
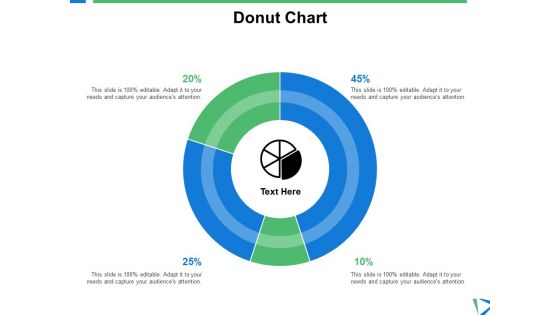
Donut Chart Investment Ppt PowerPoint Presentation Shapes
This is a donut chart investment ppt powerpoint presentation shapes. This is a four stage process. The stages in this process are finance, analysis, business, investment, marketing.
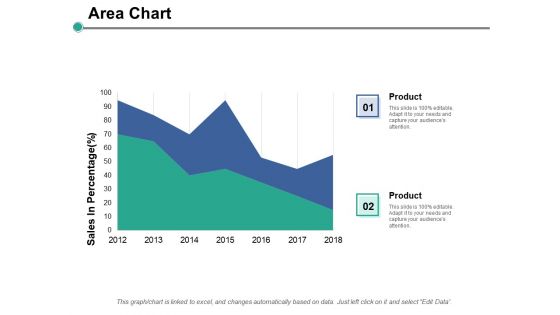
Area Chart Finance Ppt PowerPoint Presentation Gallery Elements
This is a area chart finance ppt powerpoint presentation gallery elements. This is a two stage process. The stages in this process are finance, marketing, management, investment, analysis.
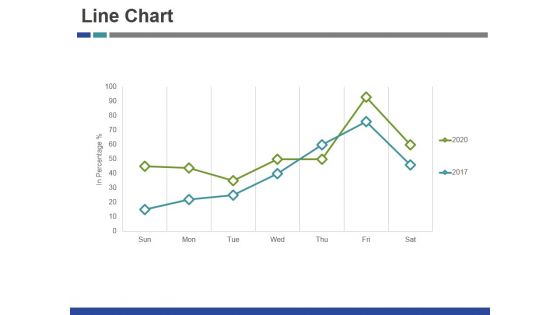
Line Chart Ppt PowerPoint Presentation Gallery Summary
This is a line chart ppt powerpoint presentation gallery summary. This is a two stage process. The stages in this process are finance, graph, business, management, marketing.
Area Chart Ppt PowerPoint Presentation Summary Icon
This is a area chart ppt powerpoint presentation summary icon. This is a two stage process. The stages in this process are finance, marketing, management, investment, analysis.
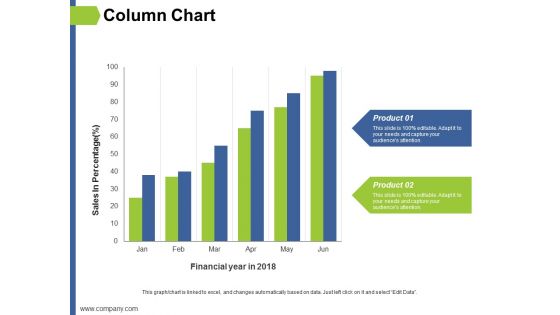
Column Chart Ppt PowerPoint Presentation Slides Format
This is a column chart ppt powerpoint presentation slides format. This is a two stage process. The stages in this process are finance, marketing, management, investment, analysis.
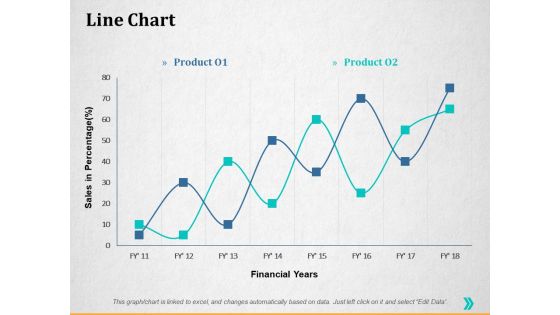
Line Chart Ppt PowerPoint Presentation Summary Guidelines
This is a line chart ppt powerpoint presentation summary guidelines. This is a two stage process. The stages in this process are percentage, product, business, management, marketing.
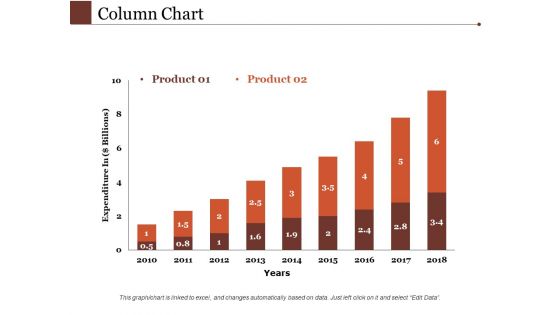
Column Chart Ppt PowerPoint Presentation Gallery Templates
This is a column chart ppt powerpoint presentation gallery templates. This is a two stage process. The stages in this process are management, marketing, business, percentage.
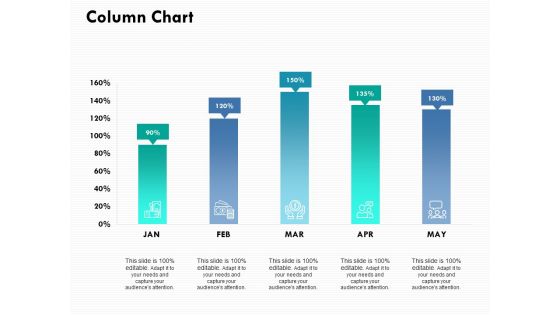
Column Chart Ppt PowerPoint Presentation Ideas Example
This is a column chart ppt powerpoint presentation ideas example. This is a five stage process. The stages in this process are percentage, product, management, marketing.
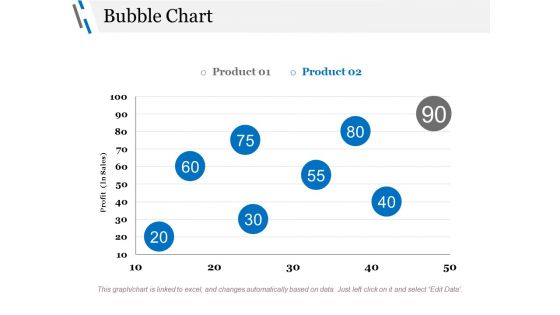
Bubble Chart Ppt PowerPoint Presentation Styles Objects
This is a bubble chart ppt powerpoint presentation styles objects. This is a two stage process. The stages in this process are profit, business, marketing, finance, chart.
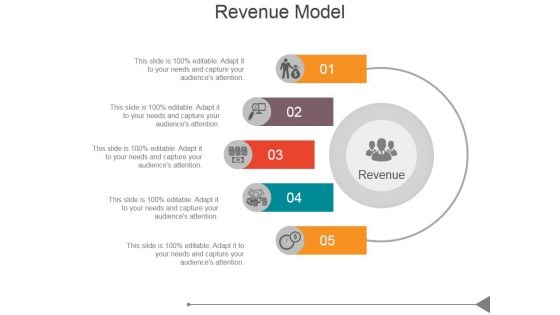
Revenue Model Ppt PowerPoint Presentation Inspiration
This is a revenue model ppt powerpoint presentation inspiration. This is a five stage process. The stages in this process are revenue, business, process, success, marketing.
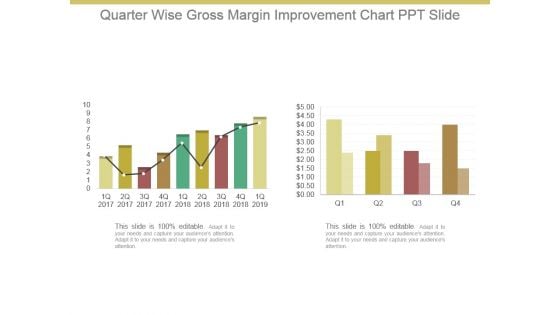
Quarter Wise Gross Margin Improvement Chart Ppt Slide
This is a quarter wise gross margin improvement chart ppt slide. This is a two stage process. The stages in this process are graph, business, growth, marketing.
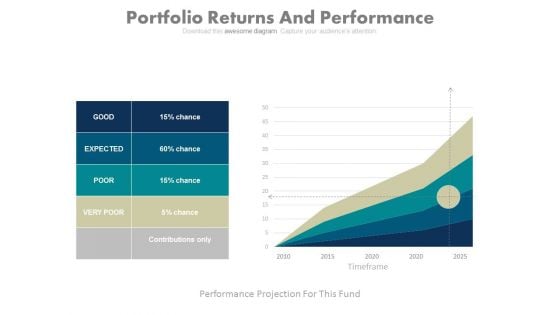
Portfolio Returns And Performance Chart Ppt Slides
This is a portfolio returns and performance chart ppt slides. This is a five stage process. The stages in this process are business, finance, marketing.
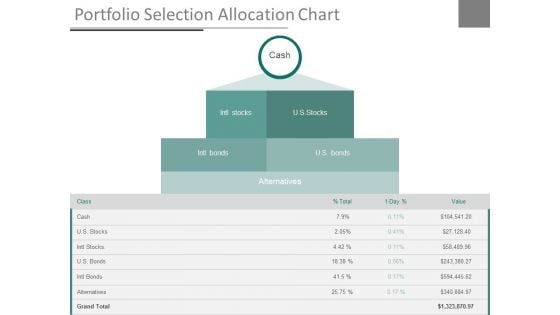
Portfolio Selection Allocation Chart Ppt Slides
This is a portfolio selection allocation chart ppt slides. This is a one stage process. The stages in this process are business, finance, marketing.
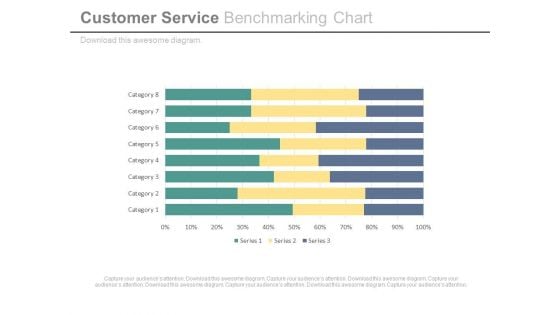
Customer Service Benchmarking Chart Ppt Slides
This is a customer service benchmarking chart ppt slides. This is a eight stage process. The stages in this process are finance, business, marketing.
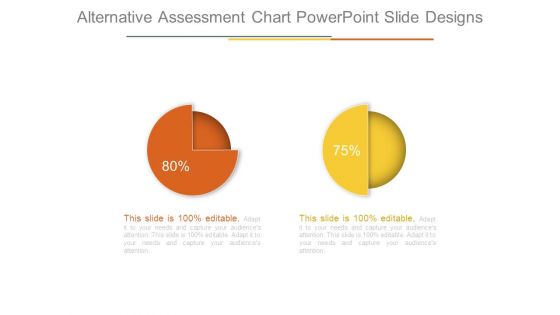
Alternative Assessment Chart Powerpoint Slide Designs
This is a alternative assessment chart powerpoint slide designs. This is a two stage process. The stages in this process are business, marketing, percentage, finance, success.
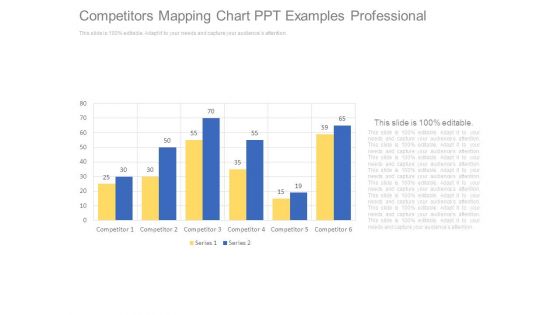
Competitors Mapping Chart Ppt Examples Professional
This is a competitors mapping chart ppt examples professional. This is a six stage process. The stages in this process are competitor, series.
Operating Expenses Analysis Pie Chart Ppt Icon
This is a operating expenses analysis pie chart ppt icon. This is a seven stage process. The stages in this process are finance, success, business, marketing, percentage.
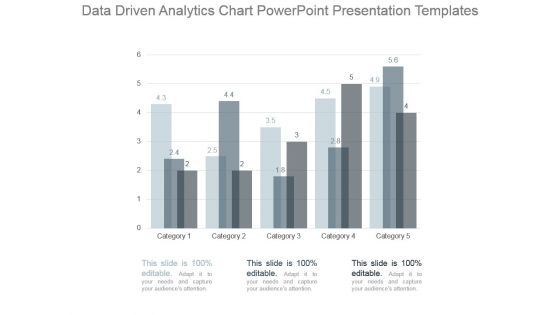
Data Driven Analytics Chart Powerpoint Presentation Templates
This is a data driven analytics chart powerpoint presentation templates. This is a five stage process. The stages in this process are category.
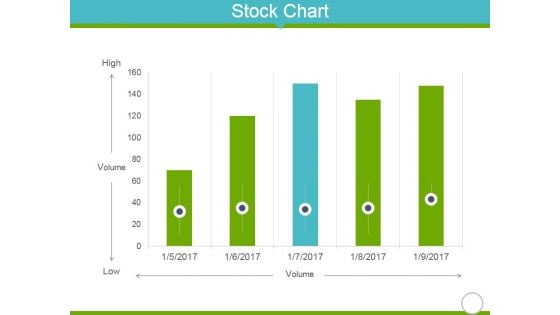
Stock Chart Ppt PowerPoint Presentation Portfolio Infographics
This is a stock chart ppt powerpoint presentation portfolio infographics. This is a five stage process. The stages in this process are high, volume, low, finance, business.
Stock Chart Ppt PowerPoint Presentation Icon Microsoft
This is a stock chart ppt powerpoint presentation icon microsoft. This is a five stage process. The stages in this process are product, high, volume, low.
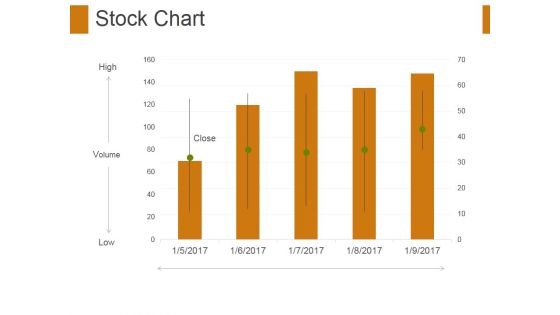
Stock Chart Ppt PowerPoint Presentation Gallery Files
This is a stock chart ppt powerpoint presentation gallery files. This is a five stage process. The stages in this process are high, volume, low, close.
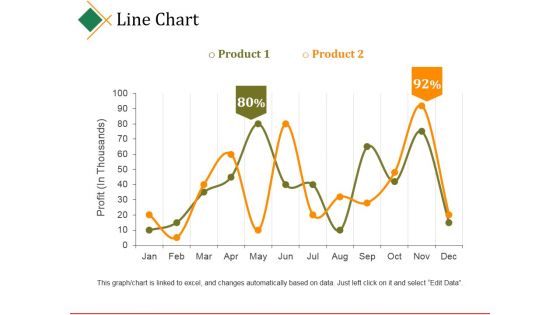
Line Chart Ppt PowerPoint Presentation Portfolio Shapes
This is a line chart ppt powerpoint presentation portfolio shapes. This is a two stage process. The stages in this process are profit, product, business, marketing, graph.

Rader Chart Ppt PowerPoint Presentation Professional Pictures
This is a rader chart ppt powerpoint presentation professional pictures. This is a two stage process. The stages in this process are product, finance, business, marketing.
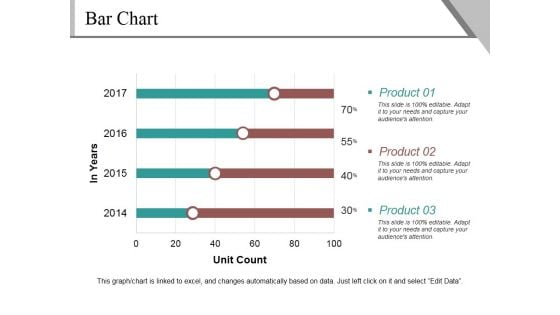
Bar Chart Ppt PowerPoint Presentation Summary Pictures
This is a bar chart ppt powerpoint presentation summary pictures. This is a four stage process. The stages in this process are product, unit count, finance, percentage, business.
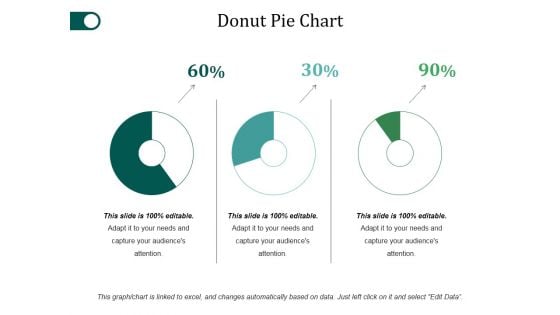
Donut Pie Chart Ppt PowerPoint Presentation Examples
This is a donut pie chart ppt powerpoint presentation examples. This is a three stage process. The stages in this process are percentage, finance, donut, business.
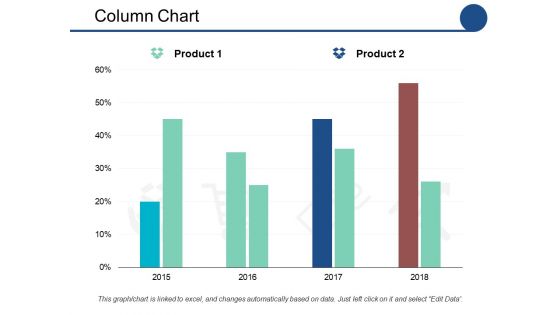
Column Chart Ppt PowerPoint Presentation Show Outfit
This is a column chart ppt powerpoint presentation show outfit. This is a two stage process. The stages in this process are product, percentage, marketing.
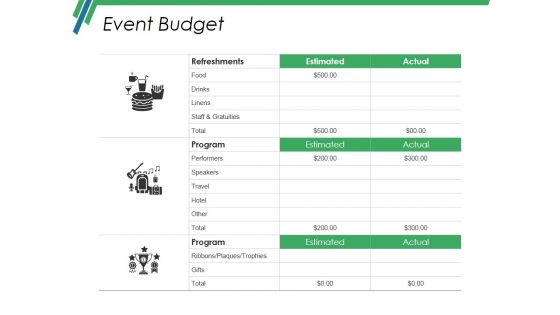
Event Budget Ppt PowerPoint Presentation Gallery Information
This is a event budget ppt powerpoint presentation gallery information. This is a three stage process. The stages in this process are refreshments, program, actual, estimated, event budget.
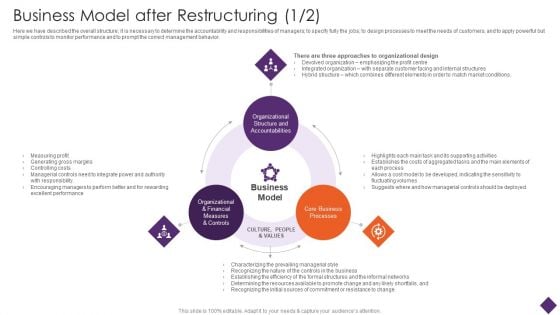
Business Restructuring Business Model After Restructuring Ppt Styles Graphics Design PDF
Here we have described the overall structure, it is necessary to determine the accountability and responsibilities of managers, to specify the jobs, to design processes to meet the needs of customer, and to apply powerful but simple controls to monitor performance and to prompt the correct management behavior. Presenting Business Restructuring Business Model After Restructuring Ppt Styles Graphics Design PDF to provide visual cues and insights. Share and navigate important information on three stages that need your due attention. This template can be used to pitch topics like Organizational Structure Accountabilities, Organizational Financial Measures, Core Business Processes. In addtion, this PPT design contains high resolution images, graphics, etc, that are easily editable and available for immediate download.
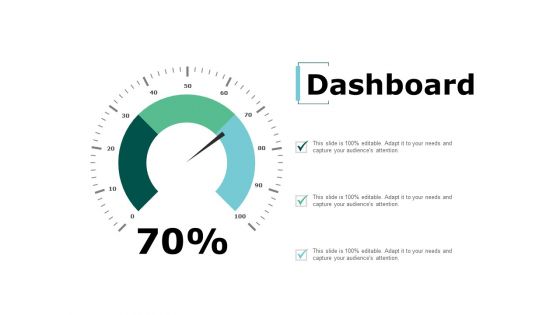
Dashboard Management Ppt Powerpoint Presentation Inspiration Model
This is a dashboard management ppt powerpoint presentation inspiration model. This is a three stage process. The stages in this process are dashboard, marketing, management, analysis, strategy.
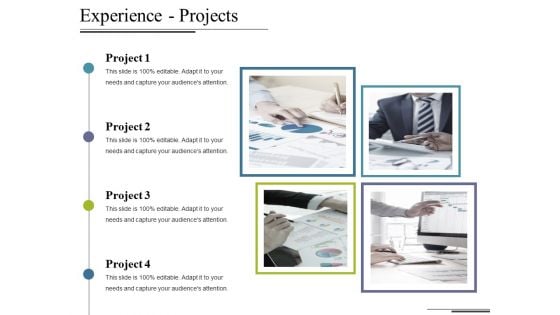
Experience Projects Ppt PowerPoint Presentation Summary Slide Download
This is a experience projects ppt powerpoint presentation summary slide download. This is a four stage process. The stages in this process are marketing, finance, business, management, strategy.
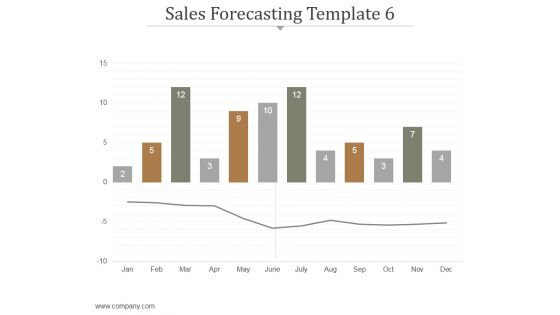
Sales Forecasting Template 6 Ppt PowerPoint Presentation Influencers
This is a sales forecasting template 6 ppt powerpoint presentation influencers. This is a six stage process. The stages in this process are business, marketing, management, strategy, analysis.
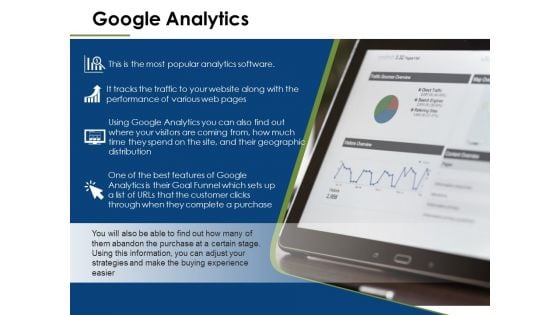
Google Analytics Ppt PowerPoint Presentation Slides Shapes
This is a google analytics ppt powerpoint presentation slides shapes. This is a one stage process. The stages in this process are marketing, management, business, strategy, business.
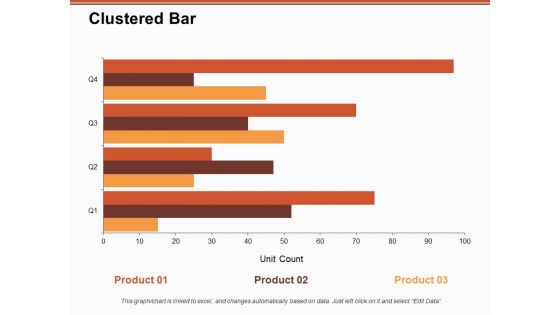
Clustered Bar Product Ppt PowerPoint Presentation Inspiration Templates
This is a clustered bar product ppt powerpoint presentation inspiration templates. This is a three stage process. The stages in this process are business, management, strategy, marketing, sales.
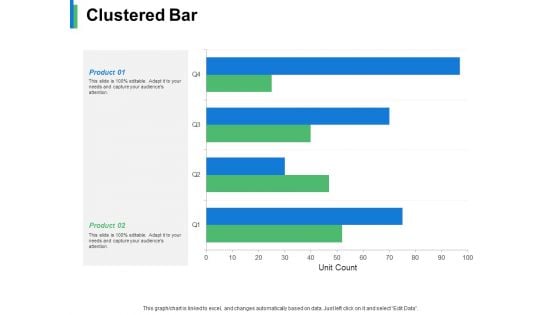
Clustered Bar Product Ppt PowerPoint Presentation Slides Examples
This is a clustered bar product ppt powerpoint presentation slides examples. This is a two stage process. The stages in this process are business, management, strategy, marketing, sales.
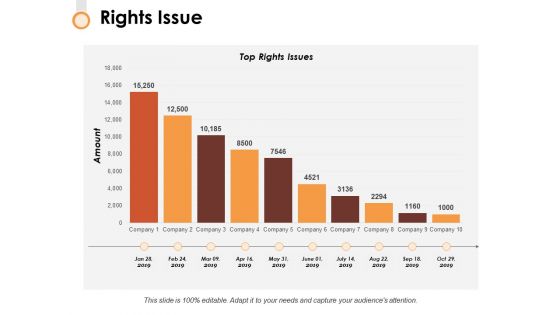
Rights Issue Ppt PowerPoint Presentation Infographics Rules
This is a rights issue ppt powerpoint presentation infographics rules. This is a three stage process. The stages in this process are finance, strategy, marketing, management, business.
Comparison Female Male Ppt Powerpoint Presentation Icon Slides
This is a comparison female male ppt powerpoint presentation icon slides. This is a two stage process. The stages in this process are comparison, male, female, marketing, strategy.
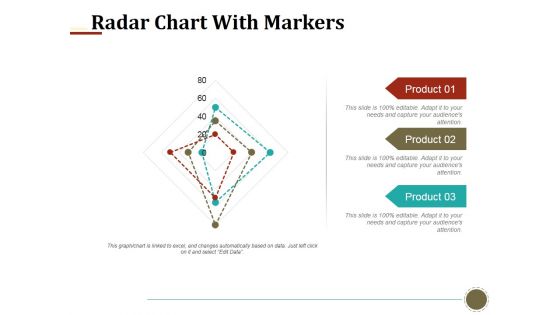
Radar Chart With Markers Ppt PowerPoint Presentation Portfolio Slides
This is a radar chart with markers ppt powerpoint presentation portfolio slides. This is a three stage process. The stages in this process are radar chart, markers, product.
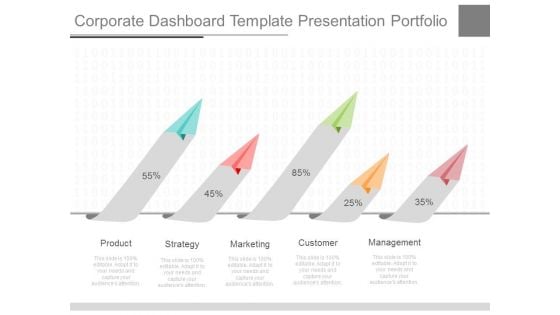
Corporate Dashboard Template Presentation Portfolio
This is a corporate dashboard template presentation portfolio. This is a five stage process. The stages in this process are product, strategy, marketing, customer, management.


 Continue with Email

 Home
Home


