Financial Planning
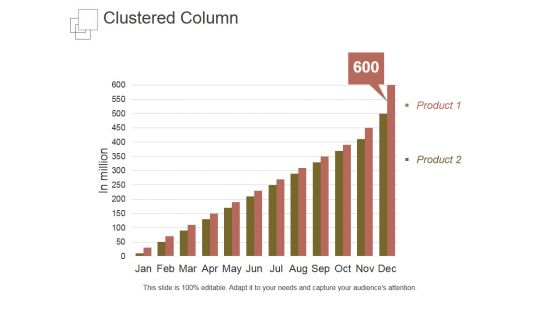
Clustered Column Template 1 Ppt PowerPoint Presentation Pictures
This is a clustered column template 1 ppt powerpoint presentation pictures. This is a one stage process. The stages in this process are product, business, marketing, management, strategy.
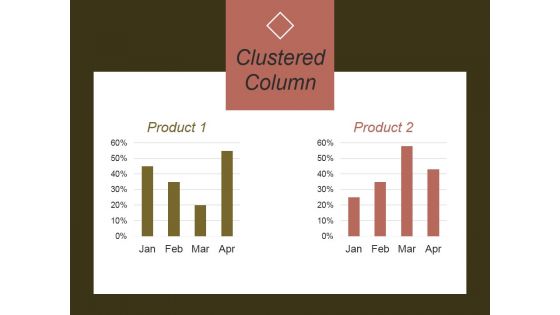
Clustered Column Template 2 Ppt PowerPoint Presentation Example
This is a clustered column template 2 ppt powerpoint presentation example. This is a two stage process. The stages in this process are product, business, marketing, management, strategy.
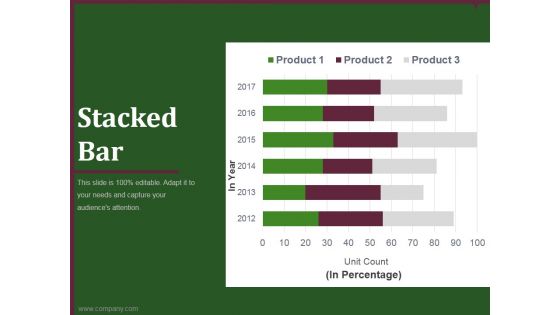
Stacked Bar Template 1 Ppt PowerPoint Presentation Inspiration
This is a stacked bar template 1 ppt powerpoint presentation inspiration. This is a six stage process. The stages in this process are bar, graph, business, marketing, strategy.
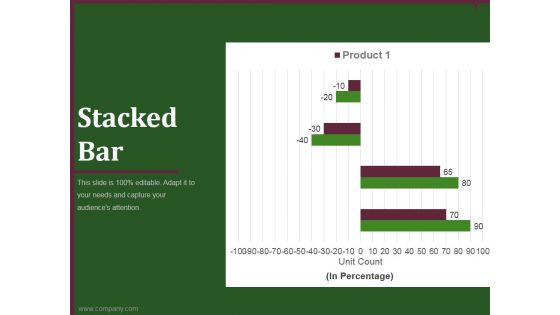
Stacked Bar Template 2 Ppt PowerPoint Presentation Themes
This is a stacked bar template 2 ppt powerpoint presentation themes. This is a four stage process. The stages in this process are bar, graph, business, marketing, strategy.
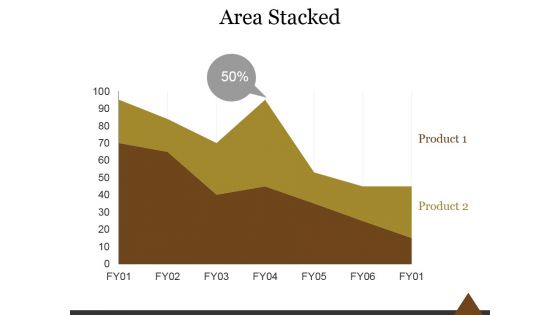
Area Stacked Ppt PowerPoint Presentation Show
This is a area stacked ppt powerpoint presentation show. This is a two stage process. The stages in this process are area, stacked, success, strategy, marketing, management.
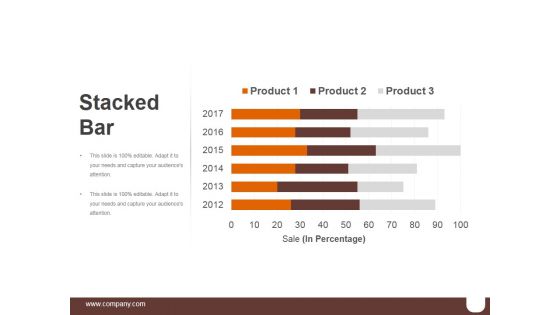
Stacked Bar Ppt PowerPoint Presentation Model
This is a stacked bar ppt powerpoint presentation model. This is a six stage process. The stages in this process are finance, analysis, business, marketing, strategy.
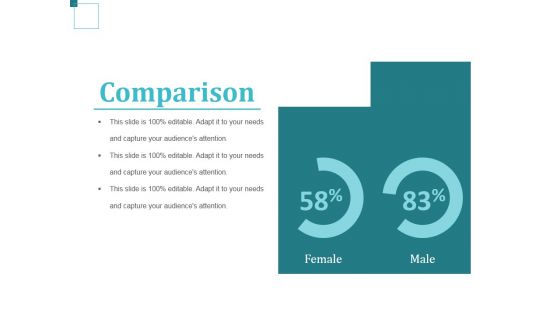
Comparison Ppt PowerPoint Presentation Styles File Formats
This is a comparison ppt powerpoint presentation styles file formats. This is a two stage process. The stages in this process are business, strategy, analysis, marketing, comparison.
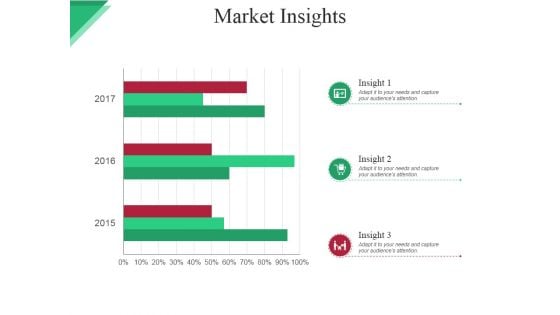
Market Insights Ppt PowerPoint Presentation Infographics Graphics
This is a market insights ppt powerpoint presentation infographics graphics. This is a three stage process. The stages in this process are icons, business, bar, marketing, strategy.
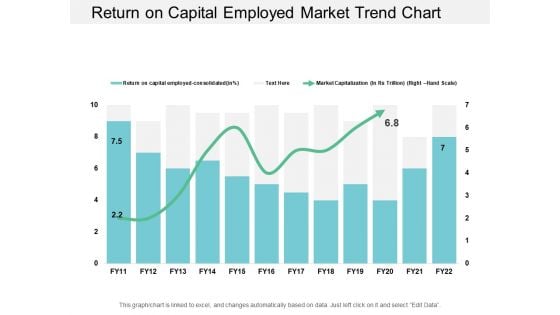
Return On Capital Employed Market Trend Chart Ppt PowerPoint Presentation Styles Examples
This is a return on capital employed market trend chart ppt powerpoint presentation styles examples. This is a two stage process. The stages in this process are accounting ratio, roce, return on capital employed.
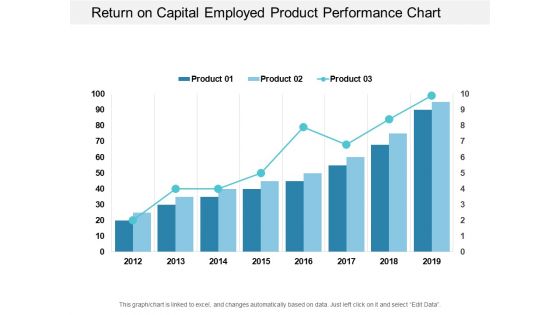
Return On Capital Employed Product Performance Chart Ppt PowerPoint Presentation Portfolio Visuals
This is a return on capital employed product performance chart ppt powerpoint presentation portfolio visuals. This is a three stage process. The stages in this process are accounting ratio, roce, return on capital employed.
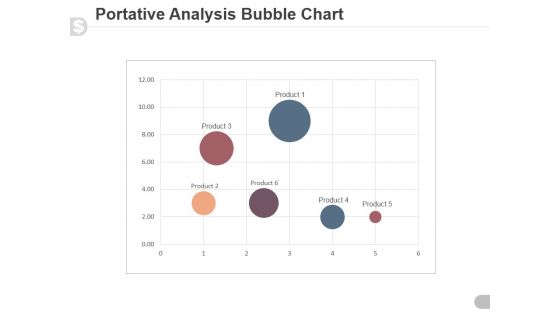
Portative Analysis Bubble Chart Ppt PowerPoint Presentation Slide
This is a portative analysis bubble chart ppt powerpoint presentation slide. This is a six stage process. The stages in this process are portative, analysis, business, graph, bubble chart.
Scatter Bubble Chart Ppt PowerPoint Presentation Icon Templates
This is a scatter bubble chart ppt powerpoint presentation icon templates. This is a eight stage process. The stages in this process are business, finance, management, scatter chart, marketing.
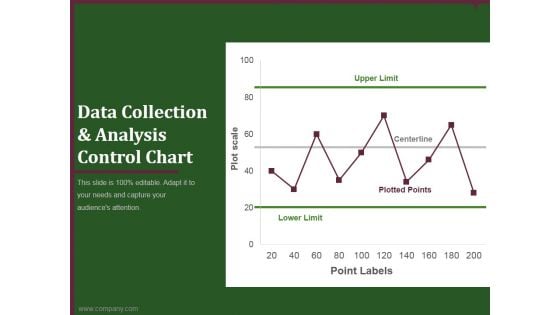
data collection and analysis control chart ppt powerpoint presentation styles
This is a data collection and analysis control chart ppt powerpoint presentation styles. This is a one stage process. The stages in this process are upper limit, centerline, plotted points, lower limit, point labels.
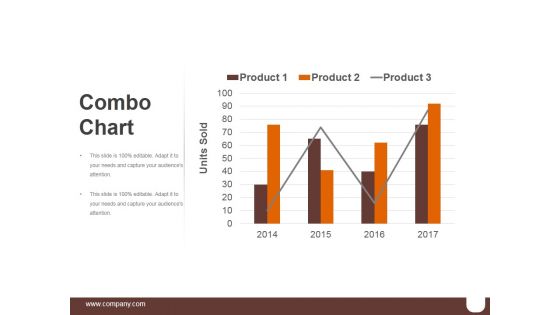
Combo Chart Template 1 Ppt PowerPoint Presentation Themes
This is a combo chart template 1 ppt powerpoint presentation themes. This is a four stage process. The stages in this process are business, marketing, finance, timeline, management.
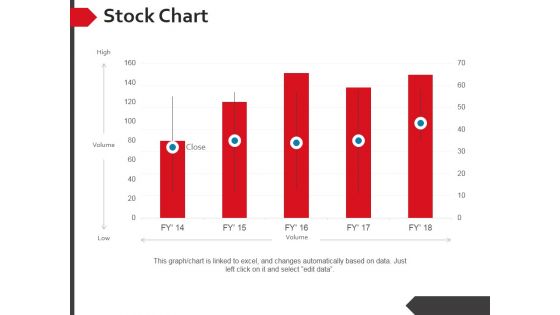
Stock Chart Ppt PowerPoint Presentation Summary Background Designs
This is a stock chart ppt powerpoint presentation summary background designs. This is a five stage process. The stages in this process are high, volume, low.
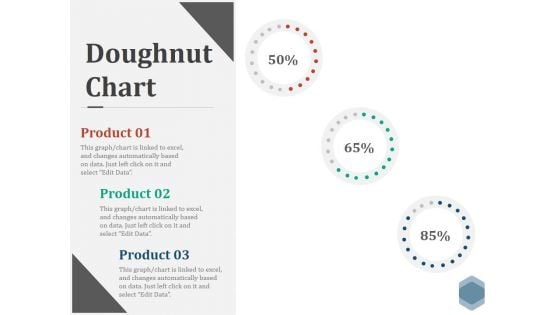
Doughnut Chart Ppt PowerPoint Presentation Visual Aids Files
This is a doughnut chart ppt powerpoint presentation visual aids files. This is a three stage process. The stages in this process are finance, donut, percentage, business, marketing.
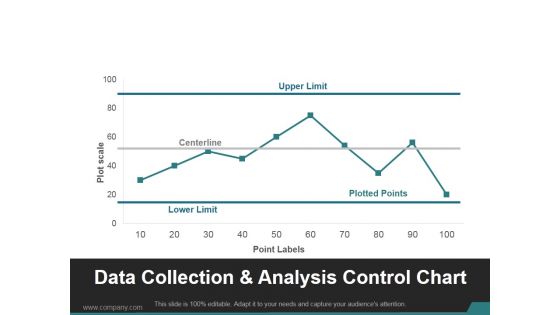
Data Collection And Analysis Control Chart Ppt PowerPoint Presentation Visuals
This is a data collection and analysis control chart ppt powerpoint presentation visuals. This is a ten stage process. The stages in this process are upper limit, centerline, lower limit, plotted points.
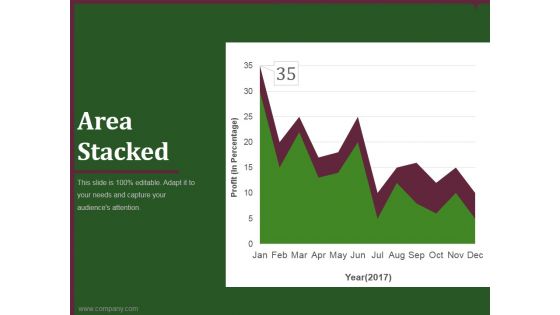
area stacked ppt powerpoint presentation information
This is a area stacked ppt powerpoint presentation information. This is a one stage process. The stages in this process are business, marketing, area chart, analysis, techniques.
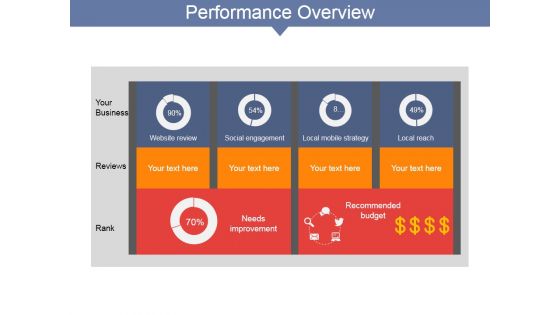
Performance Overview Ppt PowerPoint Presentation Layouts Graphics Design
This is a performance overview ppt powerpoint presentation layouts graphics design. This is a four stage process. The stages in this process are your business, reviews, rank, website review, social engagement, local mobile strategy.
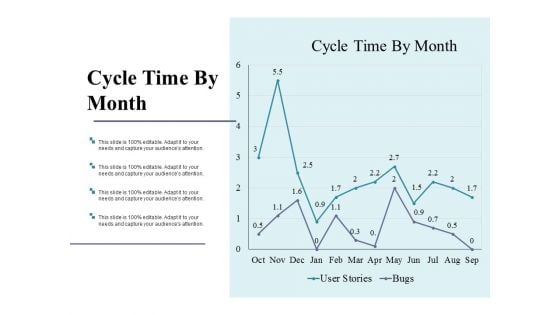
Cycle Time By Month Ppt PowerPoint Presentation Summary Templates
This is a cycle time by month ppt powerpoint presentation summary templates. This is a two stage process. The stages in this process are business, marketing, strategy, finance, analysis.
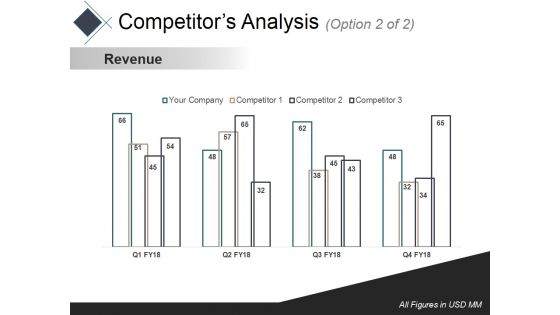
Competitors Analysis 2 Ppt PowerPoint Presentation Slides Gallery
This is a competitors analysis 2 ppt powerpoint presentation slides gallery. This is a four stage process. The stages in this process are revenue, business, marketing, bar, success.
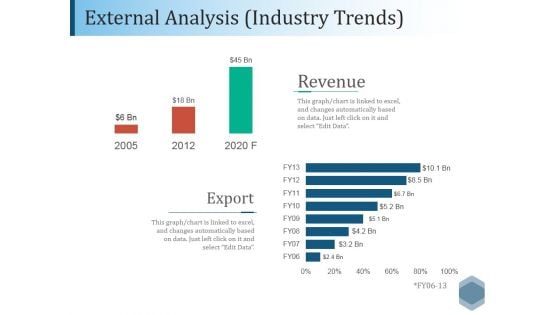
External Analysis Industry Trends Ppt PowerPoint Presentation File Outfit
This is a external analysis industry trends ppt powerpoint presentation file outfit. This is a two stage process. The stages in this process are revenue, export, bar, finance, analysis.
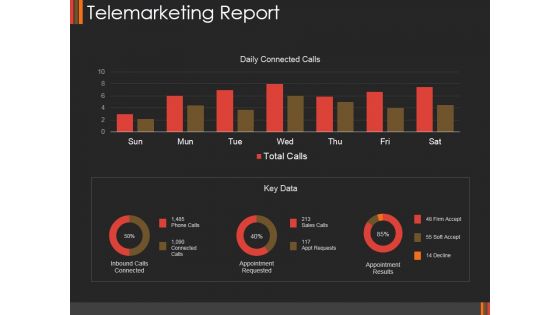
Telemarketing Report Template 1 Ppt PowerPoint Presentation Professional Skills
This is a telemarketing report template 1 ppt powerpoint presentation professional skills. This is a two stage process. The stages in this process are daily connected calls, inbound calls connected, appointment requested appointment results.
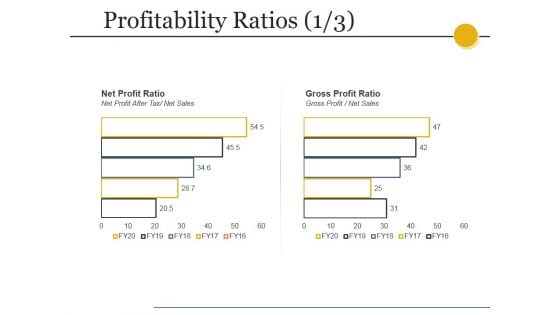
Profitability Ratios Template Ppt PowerPoint Presentation Styles Slide
This is a profitability ratios template ppt powerpoint presentation styles slide. This is a two stage process. The stages in this process are net profit ratio, net profit after tax net sales, gross profit ratio, gross profit net sales.
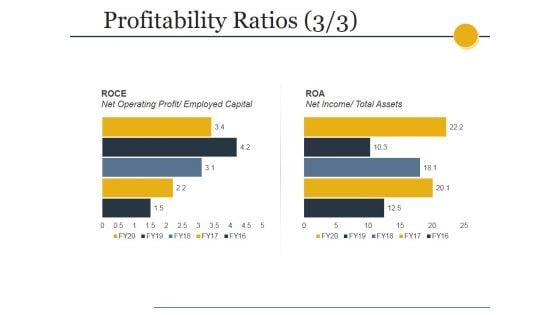
Profitability Ratios Template 3 Ppt PowerPoint Presentation Show Graphics Download
This is a profitability ratios template 3 ppt powerpoint presentation show graphics download. This is a two stage process. The stages in this process are roce, net operating profit, employed capital, roa, net income, total assets.
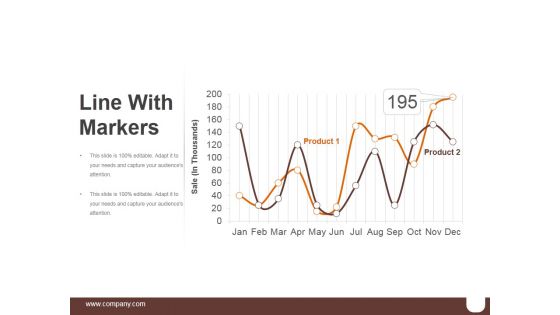
Line With Markers Ppt PowerPoint Presentation Microsoft
This is a line with markers ppt powerpoint presentation microsoft. This is a two stage process. The stages in this process are business, marketing, line chart, finance, management.
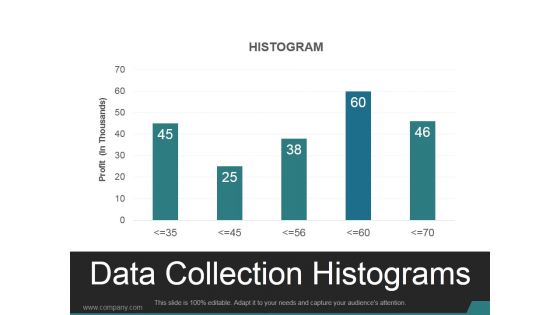
Data Collection Histograms Ppt PowerPoint Presentation Design Templates
This is a data collection histograms ppt powerpoint presentation design templates. This is a five stage process. The stages in this process are histogram, business, marketing, analysis, chart.
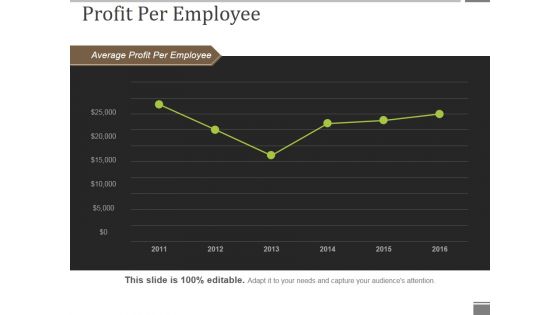
Profit Per Employee Ppt PowerPoint Presentation Show Portfolio
This is a profit per employee ppt powerpoint presentation show portfolio. This is a six stage process. The stages in this process are average profit per employee, line chart, business, marketing, success.
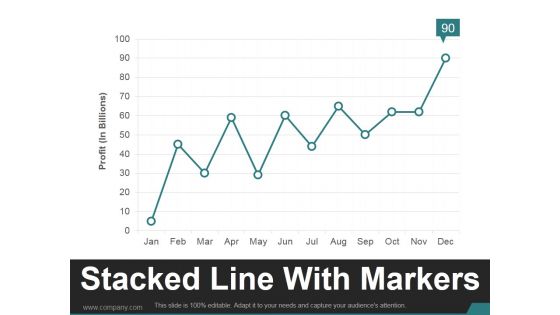
Stacked Line With Markers Ppt PowerPoint Presentation Sample
This is a stacked line with markers ppt powerpoint presentation sample. This is a one stage process. The stages in this process are business, marketing, growth, management, line chart.
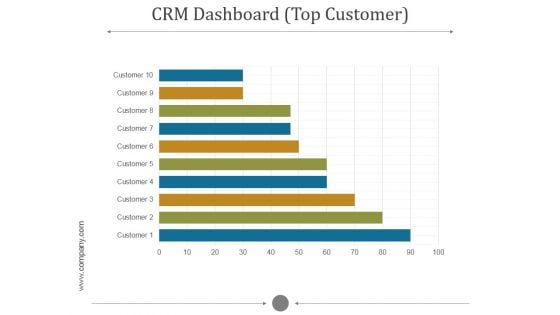
Crm Dashboard Top Customer Ppt PowerPoint Presentation Ideas
This is a crm dashboard top customer ppt powerpoint presentation ideas. This is a five stage process. The stages in this process are customer.
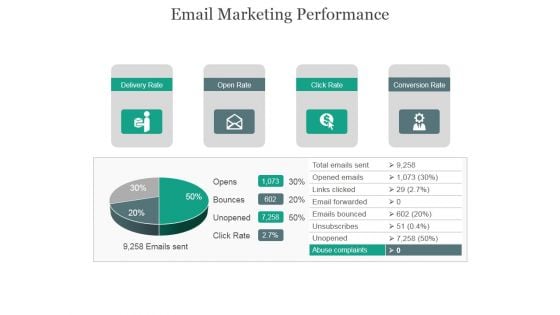
Email Marketing Performance Ppt PowerPoint Presentation Layouts
This is a email marketing performance ppt powerpoint presentation layouts. This is a four stage process. The stages in this process are delivery rate, open rate, click rate, conversion rate.
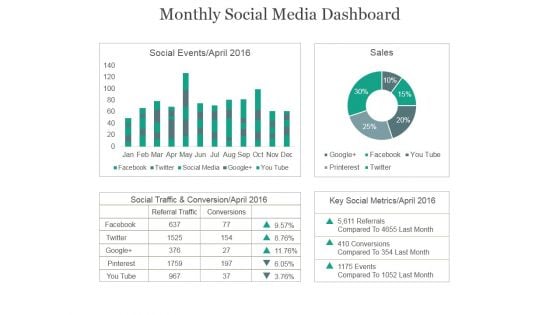
Monthly Social Media Dashboard Ppt PowerPoint Presentation Example 2015
This is a monthly social media dashboard ppt powerpoint presentation example 2015. This is a four stage process. The stages in this process are social events, sales, social traffic, conservation, key social metrics.
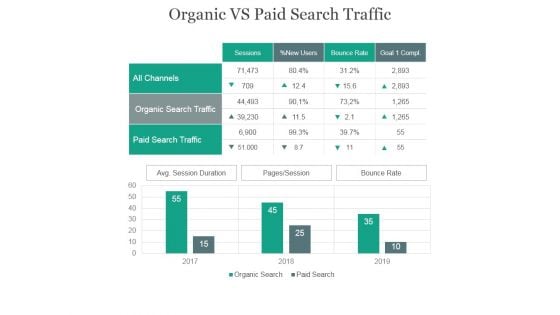
Organic Vs Paid Search Traffic Ppt PowerPoint Presentation Show
This is a organic vs paid search traffic ppt powerpoint presentation show. This is a four stage process. The stages in this process are all channels, organic search traffic, paid search traffic, sessions.
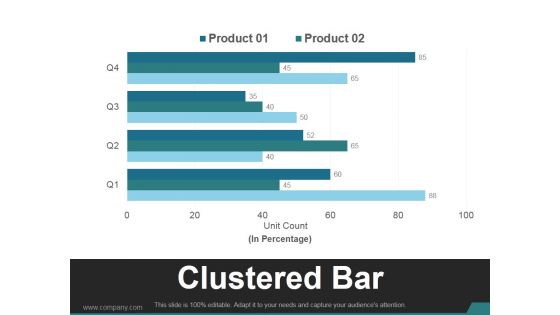
Clustered Bar Ppt PowerPoint Presentation Gallery
This is a clustered bar ppt powerpoint presentation gallery. This is a four stage process. The stages in this process are business, marketing, clustered bar, product, finance.
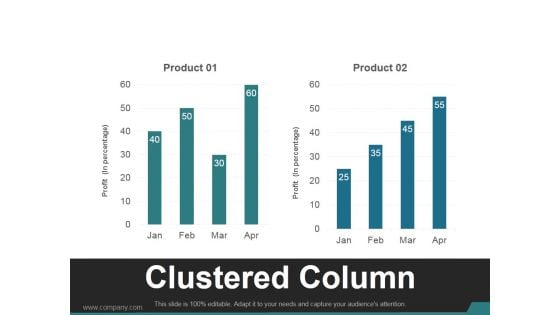
Clustered Column Ppt PowerPoint Presentation Deck
This is a clustered column ppt powerpoint presentation deck. This is a two stage process. The stages in this process are business, marketing, clustered column, product, finance.
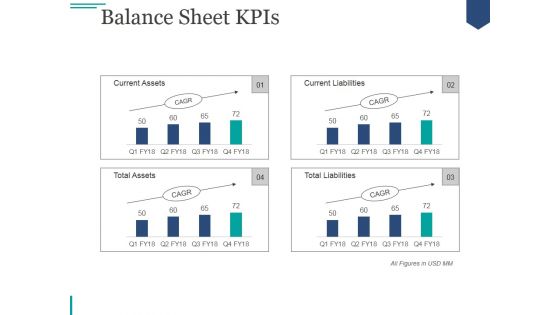
Balance Sheet Kpis Ppt PowerPoint Presentation Professional
This is a balance sheet kpis ppt powerpoint presentation professional. This is a four stage process. The stages in this process are current assets, current liabilities, total assets, total liabilities.
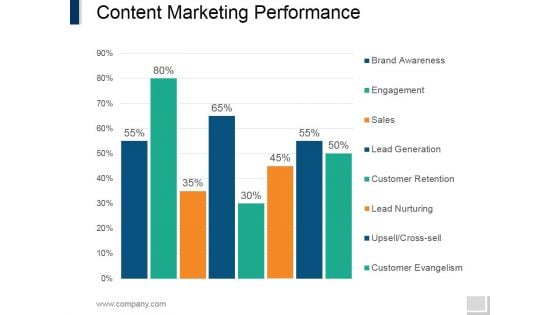
Content Marketing Performance Template 1 Ppt PowerPoint Presentation Infographics Graphics Example
This is a content marketing performance template 1 ppt powerpoint presentation infographics graphics example. This is a eight stage process. The stages in this process are brand awareness, engagement, sales, lead generation, customer retention lead nurturing, upsell.
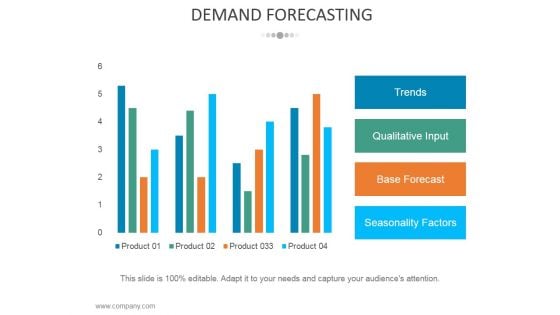
Demand Forecasting Template 1 Ppt PowerPoint Presentation Styles Gridlines
This is a demand forecasting template 1 ppt powerpoint presentation styles gridlines. This is a four stage process. The stages in this process are trends, qualitative input, base forecast, seasonality factors.
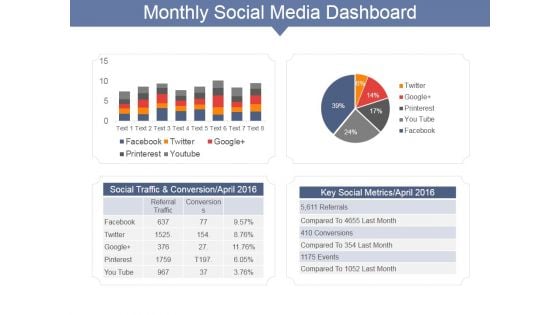
Monthly Social Media Dashboard Ppt PowerPoint Presentation Gallery Show
This is a monthly social media dashboard ppt powerpoint presentation gallery show. This is a two stage process. The stages in this process are social traffic and conversion april, key social metrics april, facebook, twitter.

Monthly Traffic Source Overview Ppt PowerPoint Presentation Portfolio Format Ideas
This is a monthly traffic source overview ppt powerpoint presentation portfolio format ideas. This is a three stage process. The stages in this process are direct traffic, referring sites, search engines, sources, keywords.
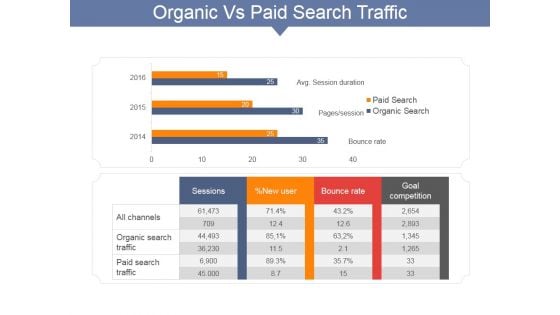
Organic Vs Paid Search Traffic Ppt PowerPoint Presentation Portfolio Master Slide
This is a organic vs paid search traffic ppt powerpoint presentation portfolio master slide. This is a two stage process. The stages in this process are sessions, all channels, organic search traffic, paid search traffic, bounce rate.
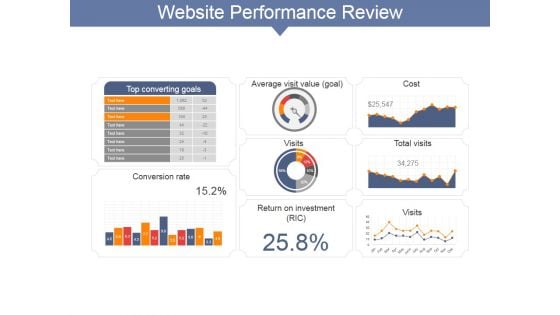
Website Performance Review Template Ppt PowerPoint Presentation Information
This is a website performance review template ppt powerpoint presentation information. This is a six stage process. The stages in this process are site consumption time, online transaction, top keywords non branded visits, average visit time.
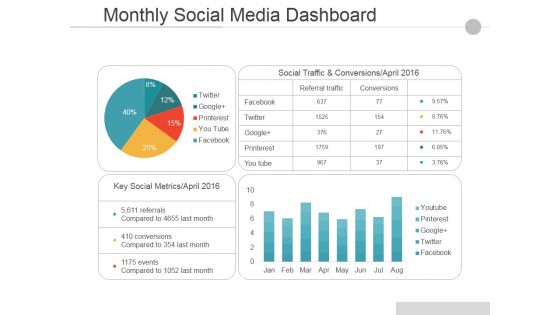
Monthly Social Media Dashboard Ppt PowerPoint Presentation Pictures Guide
This is a monthly social media dashboard ppt powerpoint presentation pictures guide. This is a two stage process. The stages in this process are social traffic and conversions april, key social metrics april, facebook, twitter, google.
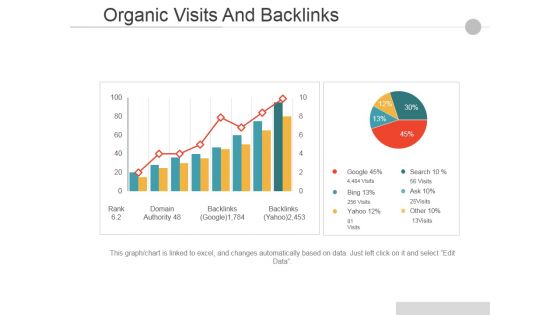
Organic Visits And Backlinks Ppt PowerPoint Presentation Inspiration Example Introduction
This is a Organic Visits And Backlinks Ppt PowerPoint Presentation Inspiration Example Introduction. This is a two stage process. The stages in this process are Business, Marketing, Finance, Success, Growth.
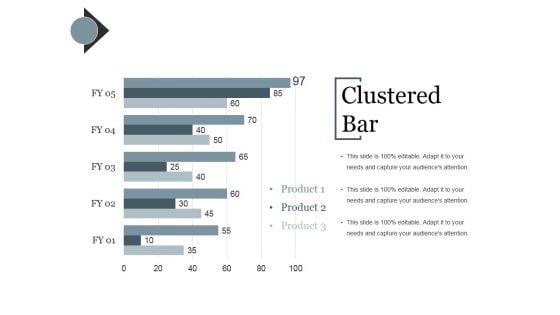
Clustered Bar Ppt PowerPoint Presentation Inspiration Objects
This is a clustered bar ppt powerpoint presentation inspiration objects. This is a five stage process. The stages in this process are business, graph, bar, finance, analysis.
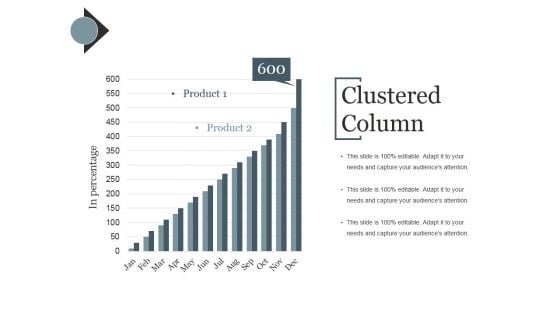
Clustered Column Template Ppt PowerPoint Presentation Portfolio Deck
This is a clustered column template ppt powerpoint presentation portfolio deck. This is a two stage process. The stages in this process are business, graph, bar, finance, analysis.
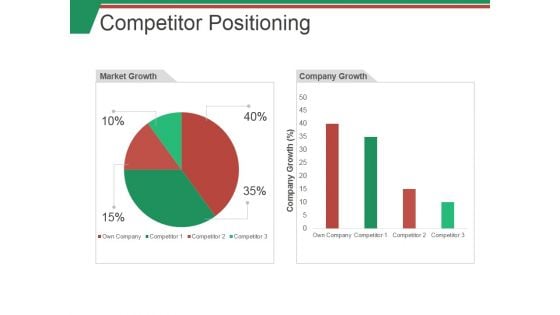
Competitor Positioning Ppt PowerPoint Presentation Show Example Introduction
This is a competitor positioning ppt powerpoint presentation show example introduction. This is a two stage process. The stages in this process are market growth, company growth, business, finance, percentage.
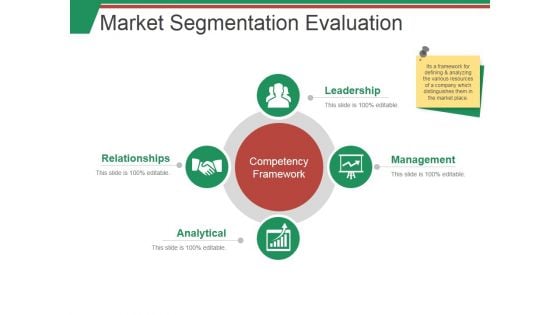
Market Segmentation Evaluation Template 1 Ppt PowerPoint Presentation Summary Smartart
This is a market segmentation evaluation template 1 ppt powerpoint presentation summary smartart. This is a two stage process. The stages in this process are market sales, net profit, beverages, milk product, nutrition.
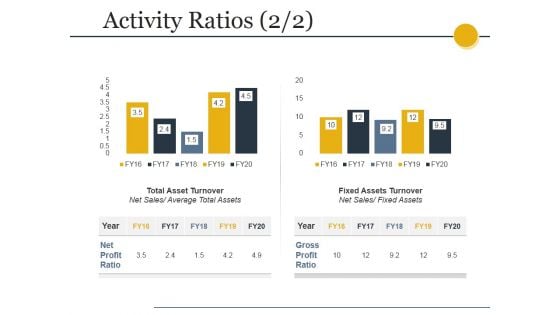
Activity Ratios Template 3 Ppt PowerPoint Presentation Professional Example
This is a activity ratios template 3 ppt powerpoint presentation professional example. This is a two stage process. The stages in this process are total asset turnover, net sales, fixed assets turnover, fixed assets.
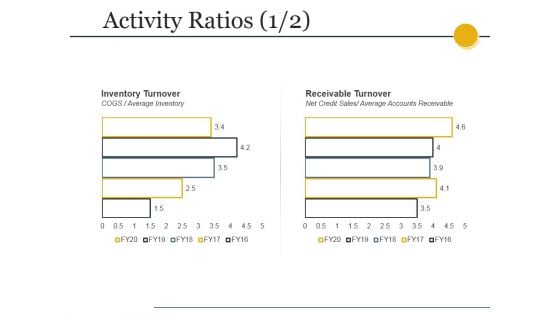
Activity Ratios Template Ppt PowerPoint Presentation Summary Slides
This is a activity ratios template ppt powerpoint presentation summary slides. This is a two stage process. The stages in this process are total asset turnover, net sales, fixed assets turnover, fixed assets.
Activity Ratios Ppt PowerPoint Presentation Icon Themes
This is a activity ratios ppt powerpoint presentation icon themes. This is a two stage process. The stages in this process are inventory turnover, cogs, average inventory, receivable turnover, net credit sales, average accounts receivable .
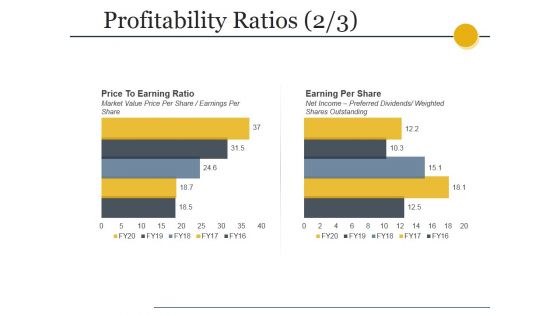
Profitability Ratios Template 2 Ppt PowerPoint Presentation Gallery Designs
This is a profitability ratios template 2 ppt powerpoint presentation gallery designs. This is a two stage process. The stages in this process are price to earning ratio, market value price per share earnings per share, earning per share, net income preferred dividends, weighted shares outstanding.
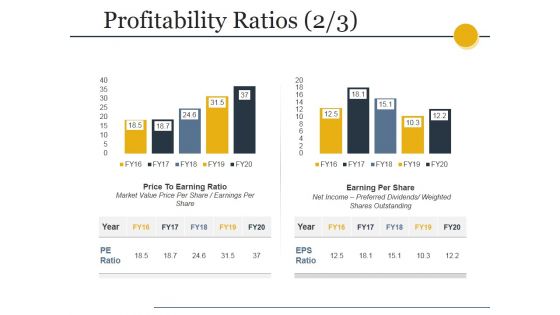
Profitability Ratios Template 4 Ppt PowerPoint Presentation Professional Deck
This is a profitability ratios template 4 ppt powerpoint presentation professional deck. This is a two stage process. The stages in this process are price to earning ratio, market value price per share earnings per share, earning per share, net income preferred dividends, weighted shares outstanding.
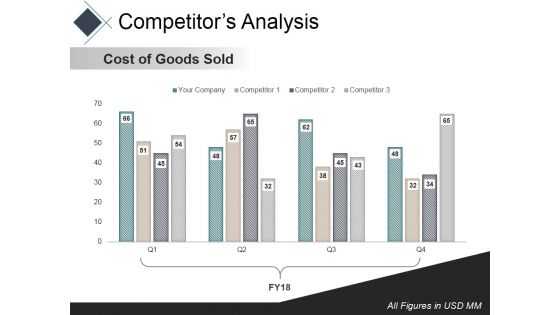
Competitors Analysis Template Ppt PowerPoint Presentation Infographic Template Rules
This is a competitors analysis template ppt powerpoint presentation infographic template rules. This is a four stage process. The stages in this process are net profit margin, finance, marketing, bar, success.
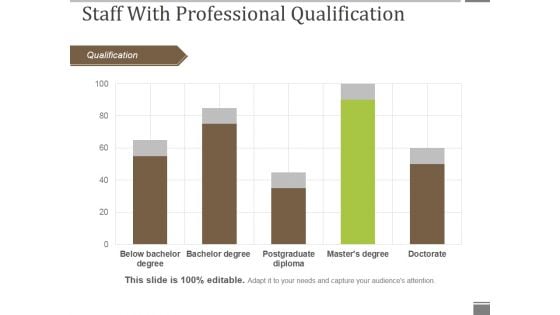
Staff With Professional Qualification Ppt PowerPoint Presentation Gallery Graphics Pictures
This is a staff with professional qualification ppt powerpoint presentation gallery graphics pictures. This is a five stage process. The stages in this process are qualification, bar graph, business, marketing, success.
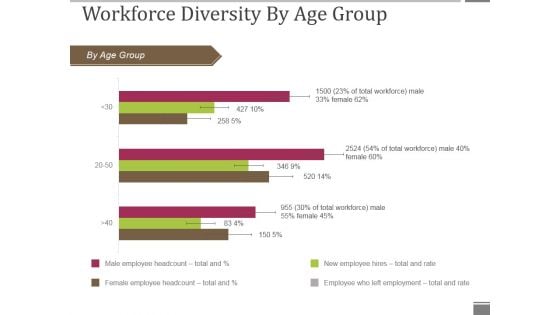
Workforce Diversity By Age Group Ppt PowerPoint Presentation Visual Aids Gallery
This is a workforce diversity by age group ppt powerpoint presentation visual aids gallery. This is a three stage process. The stages in this process are by age group, bar graph, business, marketing, presentation.
Workforce Diversity By Region Ppt PowerPoint Presentation Icon Graphics Pictures
This is a workforce diversity by region ppt powerpoint presentation icon graphics pictures. This is a four stage process. The stages in this process are by region, bar graph, business, presentation, marketing.
Area Chart Ppt PowerPoint Presentation Icon Microsoft
This is a area chart ppt powerpoint presentation icon microsoft. This is a two stage process. The stages in this process are business, strategy, analysis, planning, area chart.
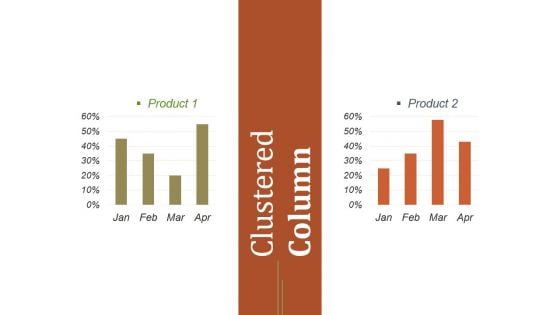
Clustered Column Ppt PowerPoint Presentation Example
This is a clustered column ppt powerpoint presentation example. This is a two stage process. The stages in this process are product, clustered column, business, planning, marketing.
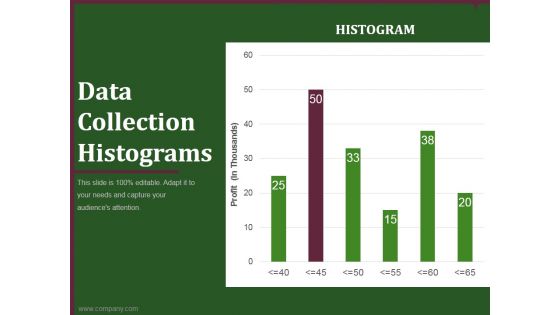
data collection histograms ppt powerpoint presentation example
This is a data collection histograms ppt powerpoint presentation example. This is a six stage process. The stages in this process are business, planning, marketing, histograms, graph.


 Continue with Email

 Home
Home


