Financial Snapshot

Loyalty Program Performance Dashboard Ppt Powerpoint Presentation Professional Templates
This is a loyalty program performance dashboard ppt powerpoint presentation professional templates. This is a six stage process. The stages in this process are finance, marketing, management, investment, analysis.

Marketing Management Dashboard Marketing Ppt PowerPoint Presentation Slides Graphics
This is a marketing management dashboard marketing ppt powerpoint presentation slides graphics. This is a three stage process. The stages in this process are finance, marketing, management, investment, analysis.
Marketing Management Dashboard Planning Ppt PowerPoint Presentation Layouts Icons
This is a marketing management dashboard planning ppt powerpoint presentation layouts icons. This is a four stage process. The stages in this process are finance, marketing, management, investment, analysis.
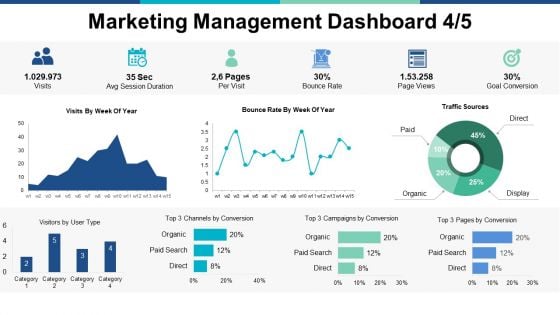
Marketing Management Dashboard Stratgegy Ppt PowerPoint Presentation Summary Samples
This is a marketing management dashboard stratgegy ppt powerpoint presentation summary samples. This is a four stage process. The stages in this process are finance, marketing, management, investment, analysis.
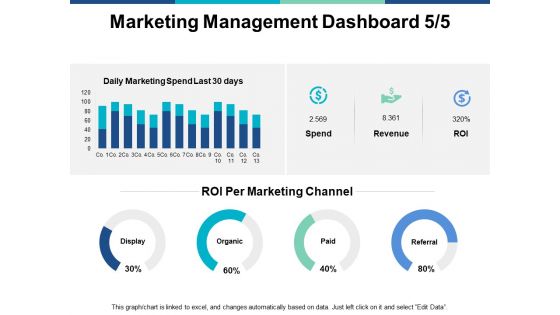
Marketing Management Dashboard Ppt PowerPoint Presentation Portfolio Layout Ideas
This is a marketing management dashboard ppt powerpoint presentation portfolio layout ideas. This is a four stage process. The stages in this process are finance, marketing, management, investment, analysis.

Inventory And Logistics Dashboard Ppt PowerPoint Presentation Gallery Clipart
This is a inventory and logistics dashboard ppt powerpoint presentation gallery clipart. This is a four stage process. The stages in this process are finance, marketing, management, investment, analysis.
Inventory Delivery On Time Dashboards Ppt PowerPoint Presentation Icon Template
This is a inventory delivery on time dashboards ppt powerpoint presentation icon template. This is a three stage process. The stages in this process are finance, marketing, management, investment, analysis.
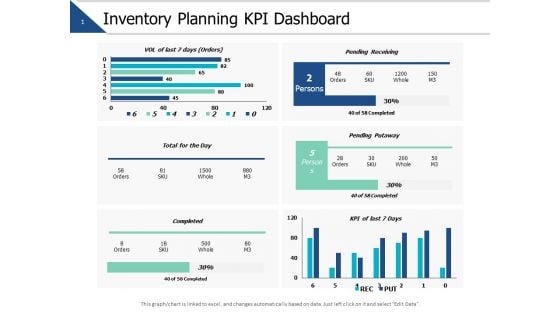
Inventory Planning Kpi Dashboard Ppt PowerPoint Presentation Model Show
This is a inventory planning kpi dashboard ppt powerpoint presentation model show. This is a four stage process. The stages in this process are finance, marketing, management, investment, analysis.
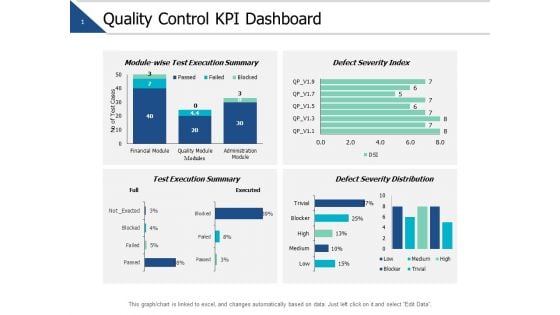
Quality Control Kpi Dashboard Ppt PowerPoint Presentation Show Portrait
This is a quality control kpi dashboard ppt powerpoint presentation show portrait. This is a four stage process. The stages in this process are finance, marketing, management, investment, analysis.
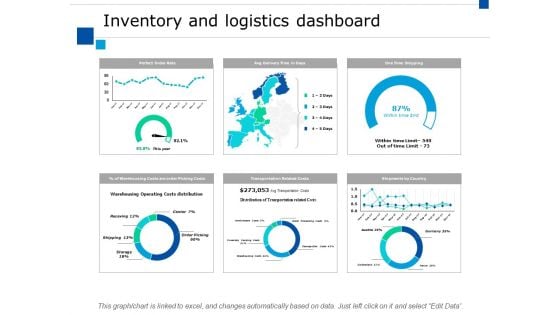
Inventory And Logistics Dashboard Ppt PowerPoint Presentation Professional Styles
This is a inventory and logistics dashboard ppt powerpoint presentation professional styles. This is a four stage process. The stages in this process are finance, marketing, management, investment, analysis.
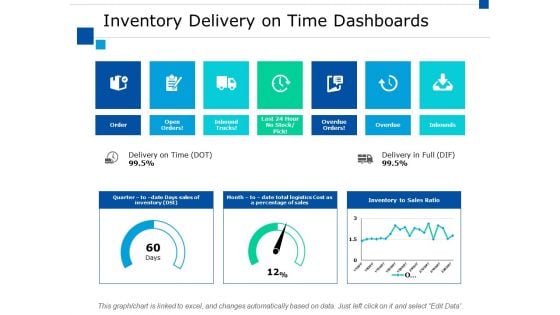
Inventory Delivery On Time Dashboards Ppt PowerPoint Presentation Slides Download
This is a inventory delivery on time dashboards ppt powerpoint presentation slides download. This is a seven stage process. The stages in this process are finance, marketing, management, investment, analysis.
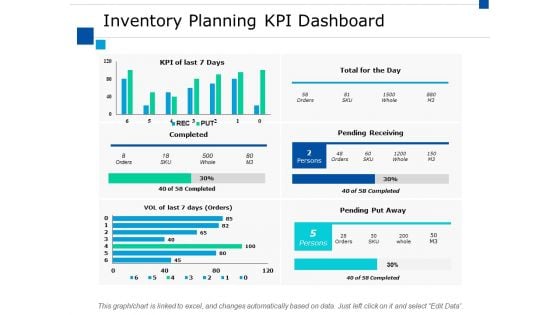
Inventory Planning Kpi Dashboard Ppt PowerPoint Presentation Summary Layout Ideas
This is a inventory planning kpi dashboard ppt powerpoint presentation summary layout ideas. This is a two stage process. The stages in this process are finance, marketing, management, investment, analysis.
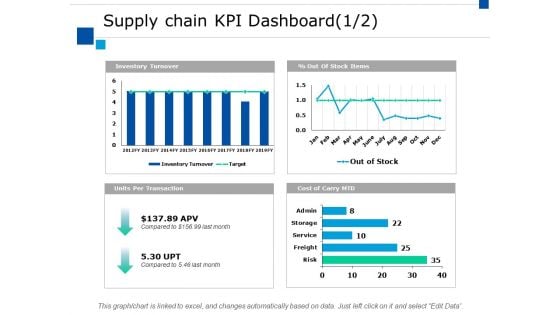
Supply Chain Kpi Dashboard Ppt PowerPoint Presentation Styles Clipart
This is a supply chain kpi dashboard ppt powerpoint presentation styles clipart. This is a four stage process. The stages in this process are finance, marketing, analysis, investment, million.
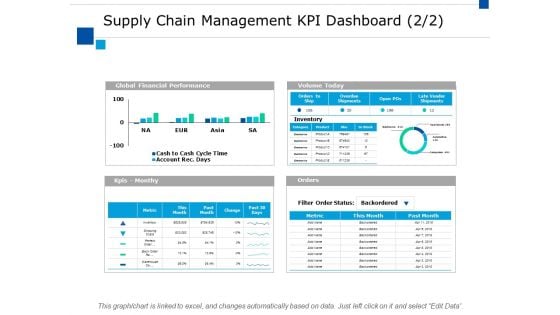
Supply Chain Management Kpi Dashboard Ppt PowerPoint Presentation File Slides
This is a supply chain management kpi dashboard ppt powerpoint presentation file slides. This is a four stage process. The stages in this process are finance, marketing, analysis, investment, million.

Loyalty Program Performance Dashboard Ppt Powerpoint Presentation Gallery Inspiration
This is a loyalty program performance dashboard ppt powerpoint presentation gallery inspiration. This is a six stage process. The stages in this process are finance, marketing, analysis, investment, strategy.
Customer Deal Tracking In Sales Pipeline Dashboard Topics PDF
This slide covers information regarding dashboard for tracking various customer deals in sales pipeline. Presenting Customer Deal Tracking In Sales Pipeline Dashboard Topics PDF to provide visual cues and insights. Share and navigate important information on four stages that need your due attention. This template can be used to pitch topics like Customer Conversion, Average, Customer Deal Tracking. In addtion, this PPT design contains high resolution images, graphics, etc, that are easily editable and available for immediate download.
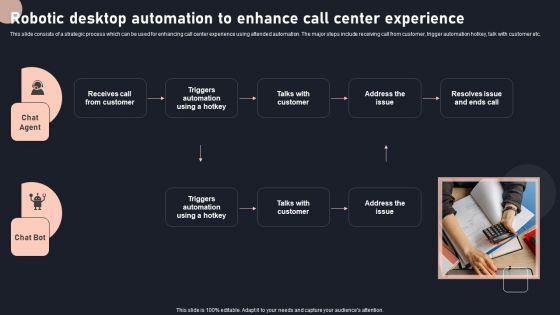
Robotic Desktop Automation To Enhance Call Center Experience Diagrams PDF
This slide consists of a strategic process which can be used for enhancing call center experience using attended automation. The major steps include receiving call from customer, trigger automation hotkey, talk with customer etc. Presenting Robotic Desktop Automation To Enhance Call Center Experience Diagrams PDF to dispense important information. This template comprises two stages. It also presents valuable insights into the topics including Chat Agent, Chat Bot, Customer. This is a completely customizable PowerPoint theme that can be put to use immediately. So, download it and address the topic impactfully.
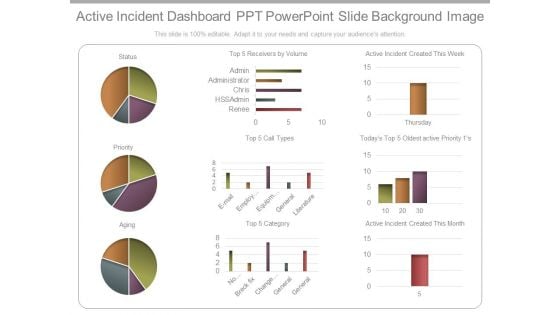
Active Incident Dashboard Ppt Powerpoint Slide Background Image
This is a active incident dashboard ppt powerpoint slide background image. This is a three stage process. The stages in this process are status, priority, aging, receivers by volume, renee, hssadmin, chris, administrator, admin, category, email, employee setup, equipment, general, literature, no category, breck fix, change management, general, active incident created this week, oldest active priority, active incident created this month, thursday.
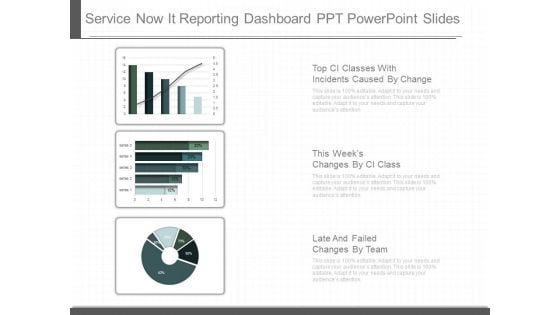
Service Now It Reporting Dashboard Ppt Powerpoint Slides
This is a service now it reporting dashboard ppt powerpoint slides. This is a three stage process. The stages in this process are top ci classes with incidents caused by change, this weeks changes by ci class, late and failed changes by team.
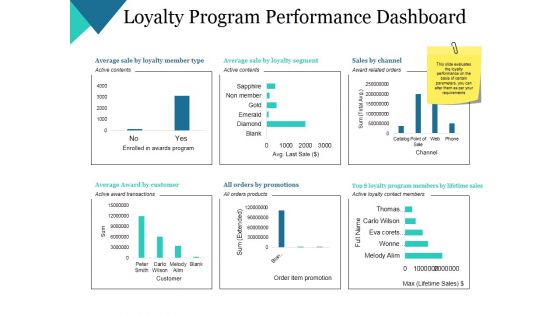
Loyalty Program Performance Dashboard Ppt PowerPoint Presentation Summary Grid
This is a loyalty program performance dashboard ppt powerpoint presentation summary grid. This is a six stage process. The stages in this process are average sale by loyalty member type, average award by customer, all orders by promotions, average sale by loyalty segment, sales by channel.
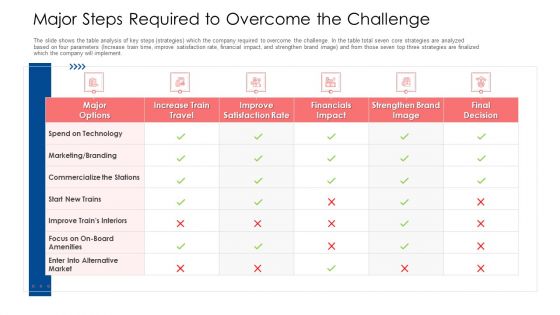
Major Steps Required To Overcome The Challenge Ppt Pictures Guidelines PDF
The slide shows the table analysis of key steps strategies which the company required to overcome the challenge. In the table total seven core strategies are analyzed based on four parameters Increase train time, improve satisfaction rate, financial impact, and strengthen brand image and from those seven top three strategies are finalized which the company will implement. Deliver an awe inspiring pitch with this creative major steps required to overcome the challenge ppt pictures guidelines pdf bundle. Topics like improve satisfaction rate, financials impact, technology can be discussed with this completely editable template. It is available for immediate download depending on the needs and requirements of the user.
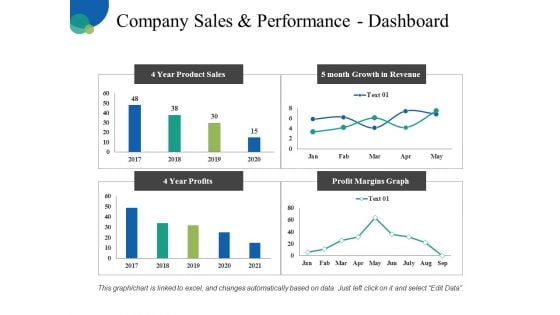
Company Sales And Performance Dashboard Ppt PowerPoint Presentation Pictures Infographic Template
This is a company sales and performance dashboard ppt powerpoint presentation pictures infographic template. This is a four stage process. The stages in this process are business, finance, analysis, management, marketing.
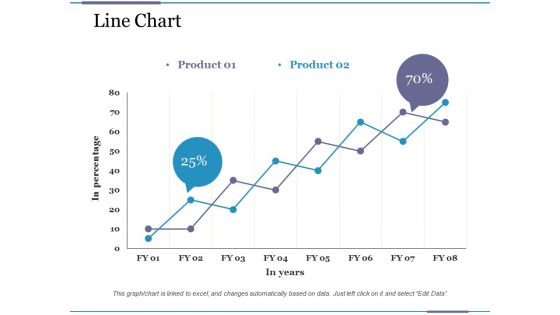
Line Chart Ppt PowerPoint Presentation Pictures File Formats
This is a line chart ppt powerpoint presentation pictures file formats. This is a two stage process. The stages in this process are business, financial, in percentage, in years, graph.
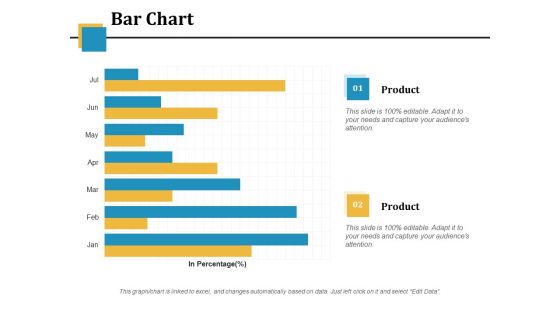
Bar Chart Ppt PowerPoint Presentation Infographic Template Picture
This is a bar chart ppt powerpoint presentation infographic template picture. This is a two stage process. The stages in this process are financial, in percentage, business, marketing, bar chart.

Retail KPI Dashboard Showing Revenue Vs Units Sold Ppt PowerPoint Presentation Professional Smartart
This is a retail kpi dashboard showing revenue vs units sold ppt powerpoint presentation professional smartart. This is a four stage process. The stages in this process are finance, analysis, business, investment, marketing.
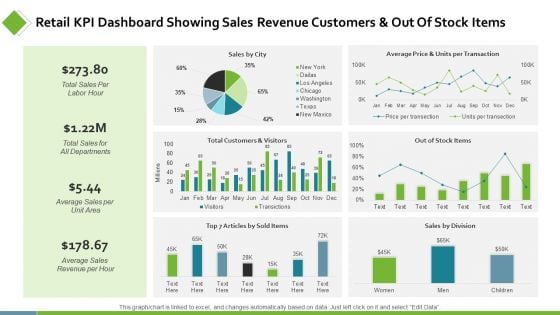
Retail KPI Dashboard Showing Sales Revenue Customers Ppt PowerPoint Presentation Show Background Designs
This is a retail kpi dashboard showing sales revenue customers ppt powerpoint presentation show background designs. This is a six stage process. The stages in this process are finance, analysis, business, investment, marketing.

Toolkit For Data Science And Analytics Transition Business Requirements For Data Analytics Project Designs PDF
The slide specifies the key requirements for data analytics project covering the business, data, application and technology aspects. Do you have to make sure that everyone on your team knows about any specific topic I yes, then you should give Toolkit For Data Science And Analytics Transition Business Requirements For Data Analytics Project Designs PDF a try. Our experts have put a lot of knowledge and effort into creating this impeccable Toolkit For Data Science And Analytics Transition Business Requirements For Data Analytics Project Designs PDF. You can use this template for your upcoming presentations, as the slides are perfect to represent even the tiniest detail. You can download these templates from the Slidegeeks website and these are easy to edit. So grab these today.
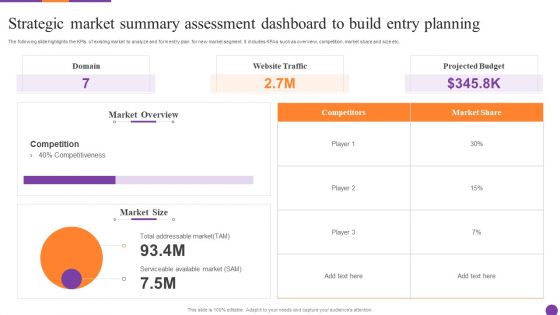
Strategic Market Summary Assessment Dashboard To Build Entry Planning Ppt Layouts Background Image PDF
The following slide highlights the KPIs of existing market to analyze and form entry plan for new market segment. It includes KPAs such as overview, competition, market share and size etc. Persuade your audience using this Strategic Market Summary Assessment Dashboard To Build Entry Planning Ppt Layouts Background Image PDF. This PPT design covers one stages, thus making it a great tool to use. It also caters to a variety of topics including Market Overview, Website Traffic, Projected Budget. Download this PPT design now to present a convincing pitch that not only emphasizes the topic but also showcases your presentation skills.
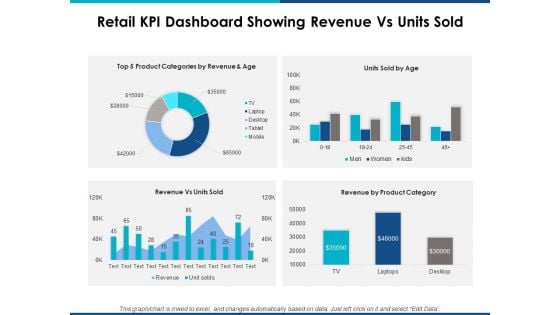
Retail Kpi Dashboard Showing Revenue Vs Units Sold Ppt Powerpoint Presentation Layouts Show
This is a retail kpi dashboard showing revenue vs units sold ppt powerpoint presentation layouts show. This is a four stage process. The stages in this process are finance, marketing, management, investment, analysis.
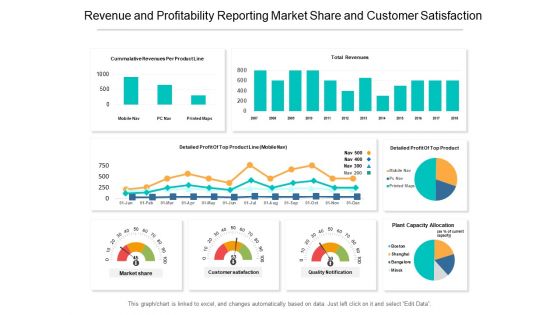
Revenue And Profitability Reporting Market Share And Customer Satisfaction Ppt PowerPoint Presentation Styles Format Ideas
This is a revenue and profitability reporting market share and customer satisfaction ppt powerpoint presentation styles format ideas. This is a four stage process. The stages in this process are business analytics, ba, organizations data.
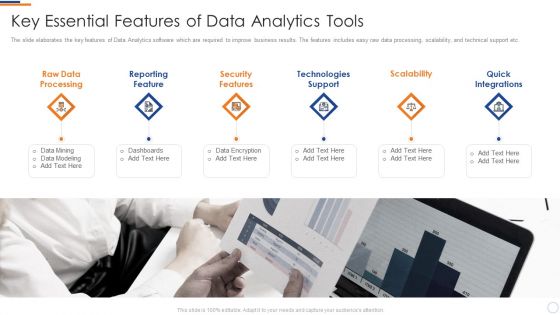
Business Intelligence And Big Key Essential Features Of Data Analytics Tools Topics PDF
The slide elaborates the key features of Data Analytics software which are required to improve business results. The features includes easy raw data processing, scalability, and technical support etc. This is a business intelligence and big key essential features of data analytics tools topics pdf template with various stages. Focus and dispense information on six stages using this creative set, that comes with editable features. It contains large content boxes to add your information on topics like raw data processing, reporting feature, security features, technologies support, scalability quick integrations. You can also showcase facts, figures, and other relevant content using this PPT layout. Grab it now.
Business Performance Assessment Dashboard Of Business Ppt PowerPoint Presentation Icon Influencers PDF
Presenting this set of slides with name business performance assessment dashboard of business ppt powerpoint presentation icon influencers pdf. This is a three stage process. The stages in this process are business performance assessment dashboard of business. This is a completely editable PowerPoint presentation and is available for immediate download. Download now and impress your audience.
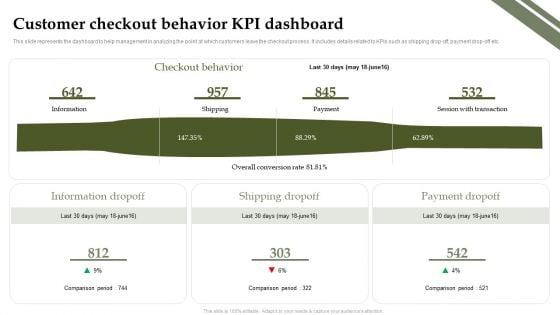
Analyzing And Deploying Effective CMS Customer Checkout Behavior KPI Dashboard Elements PDF
This slide represents the dashboard to help management in analyzing the point at which customers leave the checkout process. It includes details related to KPIs such as shipping drop off, payment drop off etc. If you are looking for a format to display your unique thoughts, then the professionally designed Analyzing And Deploying Effective CMS Customer Checkout Behavior KPI Dashboard Elements PDF is the one for you. You can use it as a Google Slides template or a PowerPoint template. Incorporate impressive visuals, symbols, images, and other charts. Modify or reorganize the text boxes as you desire. Experiment with shade schemes and font pairings. Alter, share or cooperate with other people on your work. Download Analyzing And Deploying Effective CMS Customer Checkout Behavior KPI Dashboard Elements PDF and find out how to give a successful presentation. Present a perfect display to your team and make your presentation unforgettable.
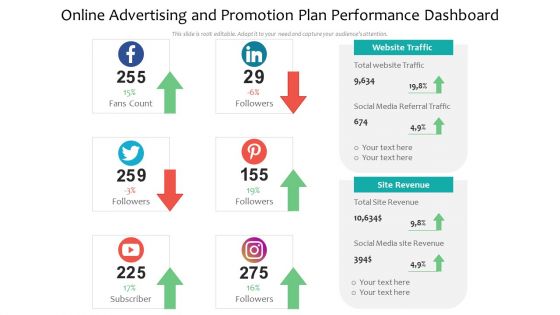
Online Advertising And Promotion Plan Performance Dashboard Ppt PowerPoint Presentation Ideas Maker PDF
Presenting online advertising and promotion plan performance dashboard ppt powerpoint presentation ideas maker pdf to dispense important information. This template comprises six stages. It also presents valuable insights into the topics including revenue, social media, online advertising and promotion plan performance dashboard. This is a completely customizable PowerPoint theme that can be put to use immediately. So, download it and address the topic impactfully.
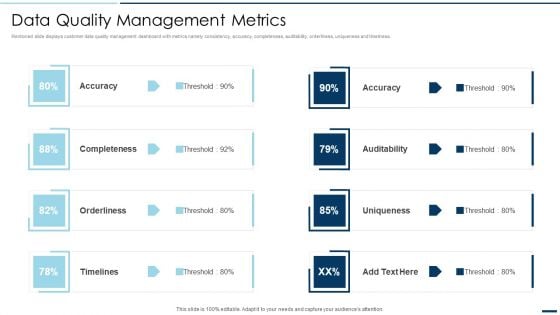
QA Plan Set 2 Data Quality Management Metrics Ppt PowerPoint Presentation Gallery Background Image PDF
Mentioned slide displays customer data quality management dashboard with metrics namely consistency, accuracy, completeness, auditability, orderliness, uniqueness and timeliness. Presenting QA Plan Set 2 Data Quality Management Metrics Ppt PowerPoint Presentation Gallery Background Image PDF to provide visual cues and insights. Share and navigate important information on eight stages that need your due attention. This template can be used to pitch topics like Accuracy Completeness, Orderliness Timelines. In addtion, this PPT design contains high resolution images, graphics, etc, that are easily editable and available for immediate download.
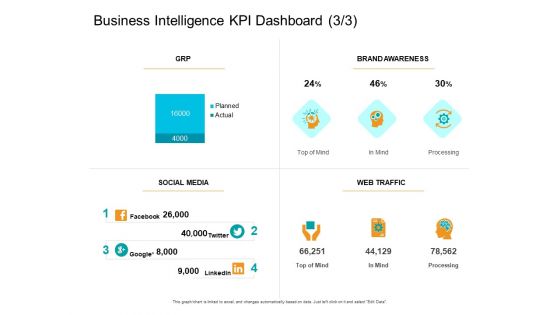
Facts Assessment Business Intelligence KPI Dashboard Processing Ppt PowerPoint Presentation Summary Graphics Template PDF
Presenting this set of slides with name facts assessment business intelligence kpi dashboard processing ppt powerpoint presentation summary graphics template pdf. This is a one stage process. The stages in this process are brand awareness, web traffic, social media, grp, mind, processing. This is a completely editable PowerPoint presentation and is available for immediate download. Download now and impress your audience.
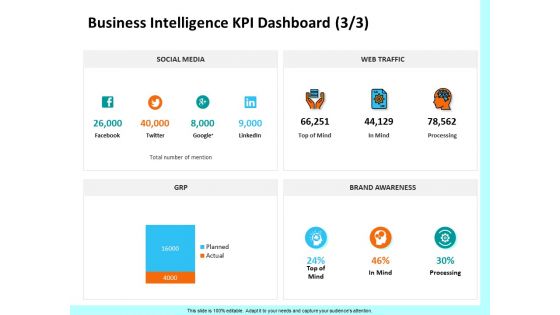
Firm Productivity Administration Business Intelligence KPI Dashboard Mind Ppt PowerPoint Presentation Outline Graphics PDF
Presenting this set of slides with name firm productivity administration business intelligence kpi dashboard mind ppt powerpoint presentation outline graphics pdf. This is a four stage process. The stages in this process are social media, web traffic, grp, brand awareness, mind, processing. This is a completely editable PowerPoint presentation and is available for immediate download. Download now and impress your audience.
Data Analytics Plan For Product Pricing Decisions Icon Professional PDF
Presenting Data Analytics Plan For Product Pricing Decisions Icon Professional PDF to dispense important information. This template comprises three stages. It also presents valuable insights into the topics including Data Analytics Plan, Product Pricing, Decisions Icon. This is a completely customizable PowerPoint theme that can be put to use immediately. So, download it and address the topic impactfully.
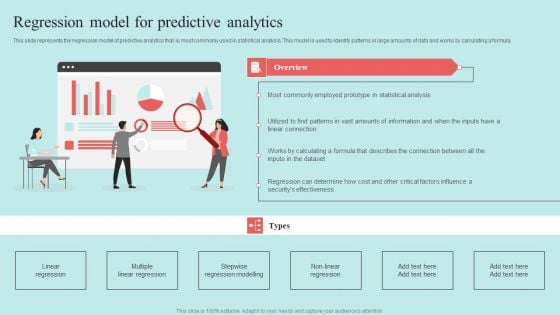
Predictive Data Model Regression Model For Predictive Analytics Sample PDF
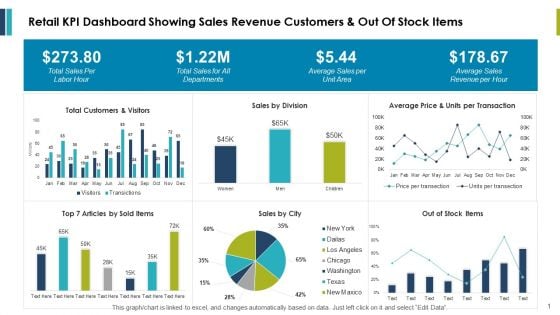
Retail Kpi Dashboard Showing Sales Revenue Customers And Out Of Stock Items Ppt PowerPoint Presentation Outline Example
This is a retail kpi dashboard showing sales revenue customers and out of stock items ppt powerpoint presentation outline example. This is a three stage process. The stages in this process are finance, marketing, management, investment, analysis.
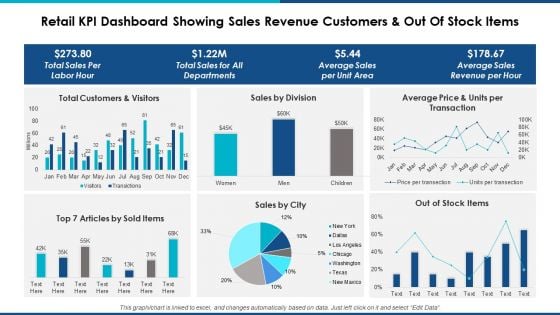
Retail Kpi Dashboard Showing Sales Revenue Customers And Out Of Stock Items Ppt Powerpoint Presentation Professional Background Designs
This is a retail kpi dashboard showing sales revenue customers and out of stock items ppt powerpoint presentation professional background designs. This is a six stage process. The stages in this process are finance, marketing, management, investment, analysis.
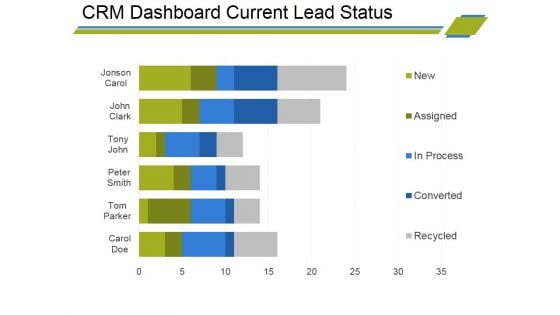
Crm Dashboard Current Lead Status Ppt PowerPoint Presentation Infographic Template Visual Aids
This is a crm dashboard current lead status ppt powerpoint presentation infographic template visual aids. This is a six stage process. The stages in this process are bar graph, finance, marketing, strategy, business, analysis.
Crm Dashboard Deals By Expected Close Date Ppt PowerPoint Presentation Portfolio Icons
This is a crm dashboard deals by expected close date ppt powerpoint presentation portfolio icons. This is a three stage process. The stages in this process are bar graph, finance, marketing, strategy, business, analysis, growth.
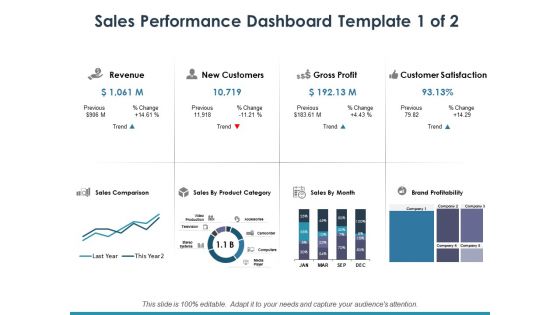
Sales Performance Dashboard Template 1 Ppt PowerPoint Presentation Infographic Template Maker
This is a sales performance dashboard template 1 ppt powerpoint presentation infographic template maker. This is a eight stage process. The stages in this process are dollar, business, finance, marketing.
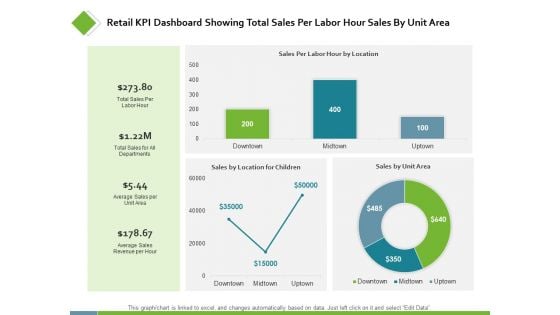
Retail KPI Dashboard Showing Total Sales Per Labor Ppt PowerPoint Presentation Styles Examples
This is a retail kpi dashboard showing total sales per labor ppt powerpoint presentation styles examples. This is a three stage process. The stages in this process are finance, analysis, business, investment, marketing.
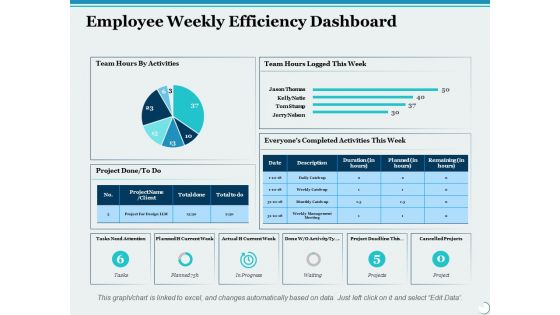
Employee Weekly Efficiency Dashboard Ppt PowerPoint Presentation Infographic Template Graphic Images
This is a employee weekly efficiency dashboard ppt powerpoint presentation infographic template graphic images. This is a six stage process. The stages in this process are percentage, product, business, management, marketing.
Online Competitors Assessment Dashboard Vector Icon Ppt PowerPoint Presentation Outline Layout Ideas PDF
Presenting this set of slides with name online competitors assessment dashboard vector icon ppt powerpoint presentation outline layout ideas pdf. This is a three stage process. The stages in this process are online competitors assessment dashboard vector icon. This is a completely editable PowerPoint presentation and is available for immediate download. Download now and impress your audience.
Information Analysis Web Dashboard Vector Icon Ppt PowerPoint Presentation File Model PDF
Presenting information analysis web dashboard vector icon ppt powerpoint presentation file model pdf to dispense important information. This template comprises three stages. It also presents valuable insights into the topics including information analysis web dashboard vector icon. This is a completely customizable PowerPoint theme that can be put to use immediately. So, download it and address the topic impactfully.
Dashboard Showing Stock Market Trends Vector Icon Ppt PowerPoint Presentation File Icons PDF
Presenting dashboard showing stock market trends vector icon ppt powerpoint presentation file icons pdf to dispense important information. This template comprises three stages. It also presents valuable insights into the topics including dashboard showing stock market trends vector icon. This is a completely customizable PowerPoint theme that can be put to use immediately. So, download it and address the topic impactfully.
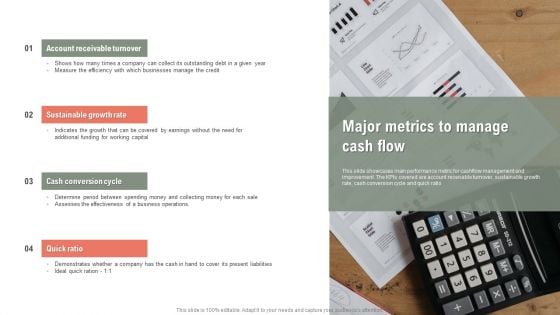
Major Metrics To Manage Cash Flow Ppt Infographics Portfolio PDF
This slide showcases main performance metric for cashflow management and improvement. The KPIs covered are account receivable turnover, sustainable growth rate, cash conversion cycle and quick ratio. Presenting Major Metrics To Manage Cash Flow Ppt Infographics Portfolio PDF to dispense important information. This template comprises four stages. It also presents valuable insights into the topics including Account Receivable Turnover, Sustainable Growth Rate, Cash Conversion Cycle. This is a completely customizable PowerPoint theme that can be put to use immediately. So, download it and address the topic impactfully.
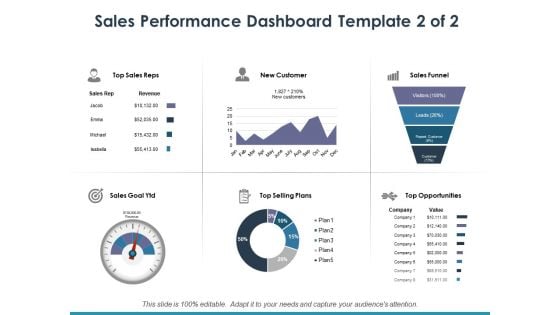
Sales Performance Dashboard Template 2 Ppt PowerPoint Presentation Infographic Template Clipart
This is a sales performance dashboard template 2 ppt powerpoint presentation infographic template clipart. This is a six stage process. The stages in this process are top sales reps, new customer, sales funnel, top selling plans, top opportunities.
Dashboard Low Medium Ppt Powerpoint Presentation Infographics Icons Ppt Powerpoint Presentation Layouts Format
This is a dashboard low medium ppt powerpoint presentation infographics icons ppt powerpoint presentation layouts format. This is a three stage process. The stages in this process are finance, marketing, management, investment, analysis.

Project Management Monthly Growth Dashboard Marketing Ppt PowerPoint Presentation Model Slide Download
This is a project management monthly growth dashboard marketing ppt powerpoint presentation model slide download. This is a four stage process. The stages in this process are finance, marketing, management, investment, analysis.
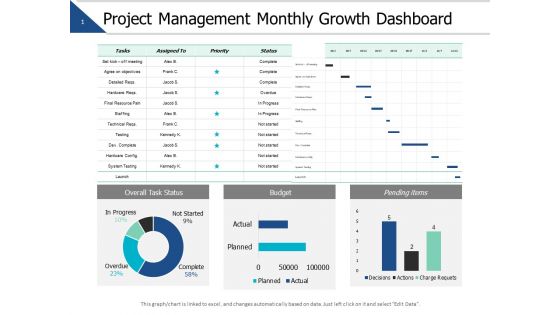
Project Management Monthly Growth Dashboard Ppt PowerPoint Presentation Slides Master Slide
This is a project management monthly growth dashboard ppt powerpoint presentation slides master slide. This is a three stage process. The stages in this process are finance, marketing, management, investment, analysis.
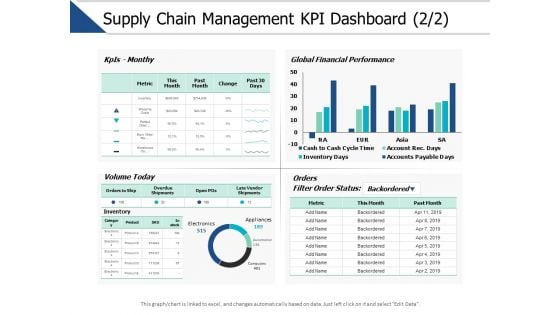
Supply Chain Management Kpi Dashboard Marketing Ppt PowerPoint Presentation File Tips
This is a supply chain management kpi dashboard marketing ppt powerpoint presentation file tips. This is a three stage process. The stages in this process are finance, marketing, management, investment, analysis.
Executive Summary Dashboard Icon To Develop Effective Marketing Strategy Themes PDF
Persuade your audience using this executive summary dashboard icon to develop effective marketing strategy themes pdf. This PPT design covers four stages, thus making it a great tool to use. It also caters to a variety of topics including executive summary dashboard icon to develop effective marketing strategy. Download this PPT design now to present a convincing pitch that not only emphasizes the topic but also showcases your presentation skills.
Personal Job Assignment Management Dashboard Icon Ppt Infographic Template Vector PDF
Persuade your audience using this Personal Job Assignment Management Dashboard Icon Ppt Infographic Template Vector PDF. This PPT design covers four stages, thus making it a great tool to use. It also caters to a variety of topics including Personal Job Assignment, Management Dashboard, Icon. Download this PPT design now to present a convincing pitch that not only emphasizes the topic but also showcases your presentation skills.
Service Level Agreement KPI Dashboard With Graph And Analytics Icon Inspiration PDF
Persuade your audience using this Service Level Agreement KPI Dashboard With Graph And Analytics Icon Inspiration PDF. This PPT design covers three stages, thus making it a great tool to use. It also caters to a variety of topics including Service Level, Agreement KPI Dashboard, Graph And Analytics, Icon. Download this PPT design now to present a convincing pitch that not only emphasizes the topic but also showcases your presentation skills.
CRM Pipeline Administration Customer Deal Tracking In Sales Pipeline Dashboard Ppt Inspiration Template PDF
This slide covers information regarding dashboard for tracking various customer deals in sales pipeline. From laying roadmaps to briefing everything in detail, our templates are perfect for you. You can set the stage with your presentation slides. All you have to do is download these easy-to-edit and customizable templates. CRM Pipeline Administration Customer Deal Tracking In Sales Pipeline Dashboard Ppt Inspiration Template PDF will help you deliver an outstanding performance that everyone would remember and praise you for. Do download this presentation today.
Naas Architectural Framework Network As A Service Performance Tracking Dashboard Icons PDF
This slide represents the performance tracking dashboard for Naas, covering service availability, inventory details, software compliance status, service level agreement, alert notifications, number of changes and incidents. Here you can discover an assortment of the finest PowerPoint and Google Slides templates. With these templates, you can create presentations for a variety of purposes while simultaneously providing your audience with an eye-catching visual experience. Download Naas Architectural Framework Network As A Service Performance Tracking Dashboard Icons PDF to deliver an impeccable presentation. These templates will make your job of preparing presentations much quicker, yet still, maintain a high level of quality. Slidegeeks has experienced researchers who prepare these templates and write high-quality content for you. Later on, you can personalize the content by editing the Naas Architectural Framework Network As A Service Performance Tracking Dashboard Icons PDF.


 Continue with Email

 Home
Home


