Financial Snapshot
Product Data Analytics Icon Showcasing Business Revenue Growth Structure Pdf
Showcasing this set of slides titled Product Data Analytics Icon Showcasing Business Revenue Growth Structure Pdf. The topics addressed in these templates are Product Data Analytics, Icon Showcasing Business, Revenue Growth. All the content presented in this PPT design is completely editable. Download it and make adjustments in color, background, font etc. as per your unique business setting. Our Product Data Analytics Icon Showcasing Business Revenue Growth Structure Pdf are topically designed to provide an attractive backdrop to any subject. Use them to look like a presentation pro.
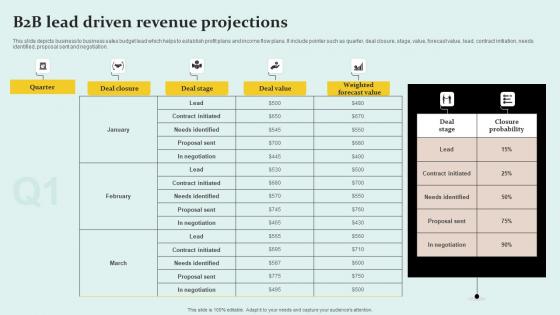
B2B Lead Driven Revenue Projections Pictures Pdf
This slide depicts business to business sales budget lead which helps to establish profit plans and income flow plans. It include pointer such as quarter, deal closure, stage, value, forecast value, lead, contract initiation, needs identified, proposal sent and negotiation. Pitch your topic with ease and precision using this B2B Lead Driven Revenue Projections Pictures Pdf This layout presents information on Quarter, Weighted Forecast Value, Contract Initiated It is also available for immediate download and adjustment. So, changes can be made in the color, design, graphics or any other component to create a unique layout. This slide depicts business to business sales budget lead which helps to establish profit plans and income flow plans. It include pointer such as quarter, deal closure, stage, value, forecast value, lead, contract initiation, needs identified, proposal sent and negotiation.
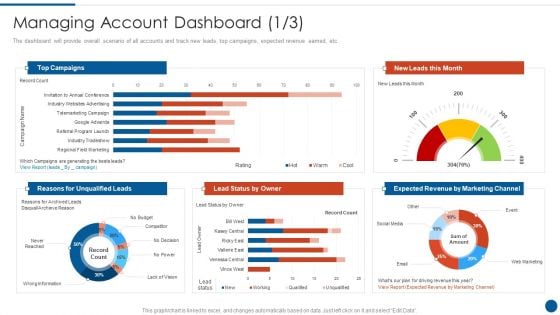
Business Development And Promotion Orchestration For Customer Profile Nurturing Managing Account Dashboard Leads Designs PDF
The dashboard will provide overall scenario of all accounts and track new leads, top campaigns, expected revenue earned, etc. Deliver an awe inspiring pitch with this creative business development and promotion orchestration for customer profile nurturing managing account dashboard leads designs pdf bundle. Topics like managing account dashboard can be discussed with this completely editable template. It is available for immediate download depending on the needs and requirements of the user.

Consumer Segmentation And Monitoring Dashboard Mockup Pdf
This slide showcases a dashboard for customer segmentation based on recency, frequency and monetary analysis. It includes key segments such as loyalist, potential, churn, lost and potential. Showcasing this set of slides titled Consumer Segmentation And Monitoring Dashboard Mockup Pdf. The topics addressed in these templates are Consumer Segmentation, Monitoring Dashboard, Potential, Churn. All the content presented in this PPT design is completely editable. Download it and make adjustments in color, background, font etc. as per your unique business setting. This slide showcases a dashboard for customer segmentation based on recency, frequency and monetary analysis. It includes key segments such as loyalist, potential, churn, lost and potential.
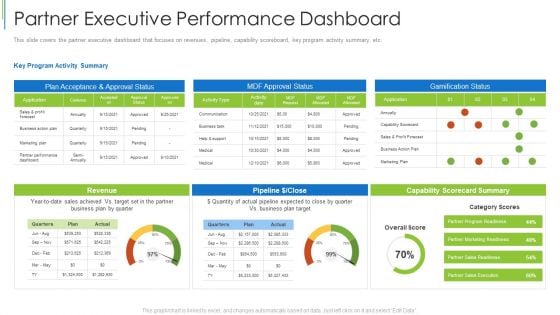
Partner Executive Performance Dashboard Ppt Styles PDF
This slide covers the partner executive dashboard that focuses on revenues, pipeline, capability scoreboard, key program activity summary, etc. Deliver an awe inspiring pitch with this creative partner executive performance dashboard ppt styles pdf bundle. Topics like business action plan, marketing plan, dashboard can be discussed with this completely editable template. It is available for immediate download depending on the needs and requirements of the user.

Global Data Security Industry Report Pestle Analysis Of Global Cybersecurity Industry IR SS V
The slide depicts PESTLE analysis which companies can use to evaluate the external factors that impact the industrys growth and profitability. It enables companies to make informed decisions and strategic planning in a dynamic business environment. Key components include political, legal, economic, social, technological and environmental aspects. This Global Data Security Industry Report Pestle Analysis Of Global Cybersecurity Industry IR SS V is perfect for any presentation, be it in front of clients or colleagues. It is a versatile and stylish solution for organizing your meetings. The Global Data Security Industry Report Pestle Analysis Of Global Cybersecurity Industry IR SS V features a modern design for your presentation meetings. The adjustable and customizable slides provide unlimited possibilities for acing up your presentation. Slidegeeks has done all the homework before launching the product for you. So, do not wait, grab the presentation templates today The slide depicts PESTLE analysis which companies can use to evaluate the external factors that impact the industrys growth and profitability. It enables companies to make informed decisions and strategic planning in a dynamic business environment. Key components include political, legal, economic, social, technological and environmental aspects.
Customer Satisfaction Template 1 Ppt PowerPoint Presentation Icon Outline
This is a customer satisfaction template 1 ppt powerpoint presentation icon outline. This is a three stage process. The stages in this process are overall satisfaction with service, satisfaction with value for money, overall satisfaction with relationship, dashboard business.

Actual And Planned Partner Executive Performance Dashboard Ppt Show Outline PDF
This slide covers the partner executive dashboard that focuses on revenues, pipeline, capability scoreboard, along with actual and planned values quarterly. Deliver an awe inspiring pitch with this creative actual and planned partner executive performance dashboard ppt show outline pdf bundle. Topics like actual and planned partner executive performance dashboard can be discussed with this completely editable template. It is available for immediate download depending on the needs and requirements of the user.
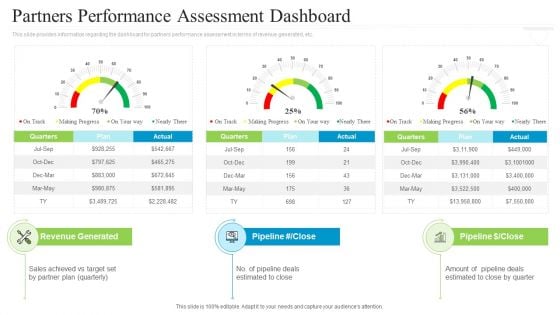
Collaborative Marketing To Attain New Customers Partners Performance Assessment Dashboard Microsoft PDF
This slide provides information regarding the dashboard for partners performance assessment in terms of revenue generated, etc. Deliver and pitch your topic in the best possible manner with this collaborative marketing to attain new customers partners performance assessment dashboard microsoft pdf. Use them to share invaluable insights on partners performance assessment dashboard and impress your audience. This template can be altered and modified as per your expectations. So, grab it now.
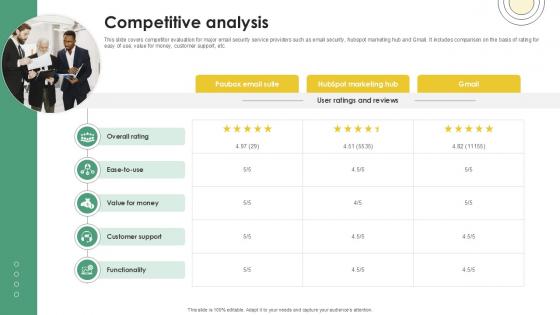
Competitive Analysis Email And Data Protection Platform Capital Funding Pitch Deck PPT Example
This slide covers competitor evaluation for major email security service providers such as email security, hubspot marketing hub and Gmail. It includes comparison on the basis of rating for easy of use, value for money, customer support, etc. Do you have to make sure that everyone on your team knows about any specific topic I yes, then you should give Competitive Analysis Email And Data Protection Platform Capital Funding Pitch Deck PPT Example a try. Our experts have put a lot of knowledge and effort into creating this impeccable Competitive Analysis Email And Data Protection Platform Capital Funding Pitch Deck PPT Example. You can use this template for your upcoming presentations, as the slides are perfect to represent even the tiniest detail. You can download these templates from the Slidegeeks website and these are easy to edit. So grab these today This slide covers competitor evaluation for major email security service providers such as email security, hubspot marketing hub and Gmail. It includes comparison on the basis of rating for easy of use, value for money, customer support, etc.
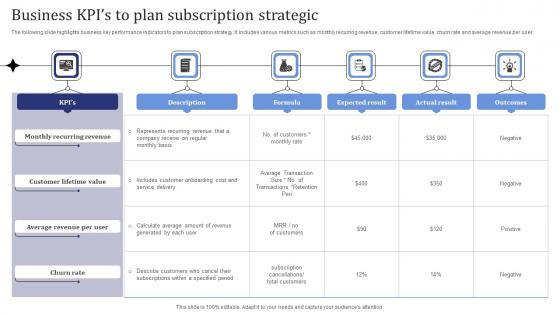
Business Kpis To Plan Subscription Strategic Pictures Pdf
The following slide highlights business key performance indicators to plan subscription strategy. It includes various metrics such as monthly recurring revenue, customer lifetime value, churn rate and average revenue per user. Showcasing this set of slides titled Business Kpis To Plan Subscription Strategic Pictures Pdf. The topics addressed in these templates are Monthly Recurring Revenue, Customer Lifetime Value, Churn Rate. All the content presented in this PPT design is completely editable. Download it and make adjustments in color, background, font etc. as per your unique business setting. The following slide highlights business key performance indicators to plan subscription strategy. It includes various metrics such as monthly recurring revenue, customer lifetime value, churn rate and average revenue per user.
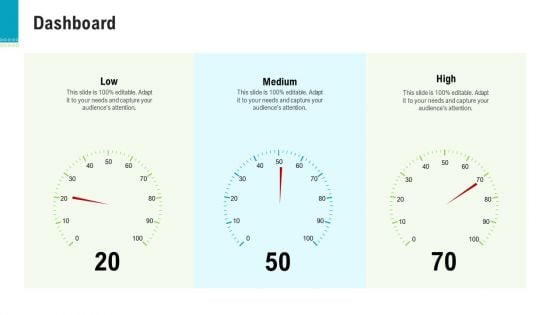
Investor Pitch Deck To Generate Capital From Pre Seed Round Dashboard Introduction PDF
Presenting investor pitch deck to generate capital from pre seed round dashboard introduction pdf to provide visual cues and insights. Share and navigate important information on three stages that need your due attention. This template can be used to pitch topics like low, medium, high. In addtion, this PPT design contains high resolution images, graphics, etc, that are easily editable and available for immediate download.

Food And Beverages Capital Raising Pitch Deck Competitive Landscape For Food Startup Pictures PDF
Mentioned slide will help the company to show the investors or audience a complete view of its competitive landscape based on financials.Deliver an awe inspiring pitch with this creative food and beverages capital raising pitch deck competitive landscape for food startup pictures pdf bundle. Topics like competitive landscape for food startup can be discussed with this completely editable template. It is available for immediate download depending on the needs and requirements of the user.
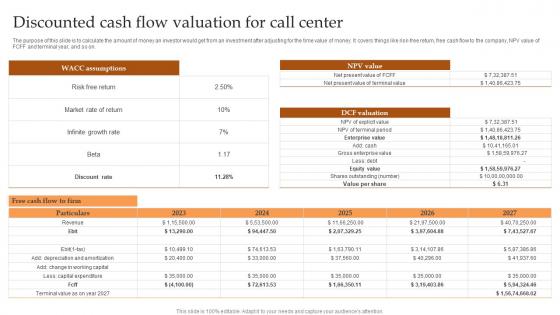
Discounted Cash Flow Valuation For Call Center IT And Tech Support Business Topics Pdf
The purpose of this slide is to calculate the amount of money an investor would get from an investment after adjusting for the time value of money. It covers things like risk-free return, free cash flow to the company, NPV value of FCFF and terminal year, and so on. Explore a selection of the finest Discounted Cash Flow Valuation For Call Center IT And Tech Support Business Topics Pdf here. With a plethora of professionally designed and pre-made slide templates, you can quickly and easily find the right one for your upcoming presentation. You can use our Discounted Cash Flow Valuation For Call Center IT And Tech Support Business Topics Pdf to effectively convey your message to a wider audience. Slidegeeks has done a lot of research before preparing these presentation templates. The content can be personalized and the slides are highly editable. Grab templates today from Slidegeeks. The purpose of this slide is to calculate the amount of money an investor would get from an investment after adjusting for the time value of money. It covers things like risk-free return, free cash flow to the company, NPV value of FCFF and terminal year, and so on.
Magnifying Glass With Tax Report Ppt PowerPoint Presentation Gallery Design Templates PDF
Presenting magnifying glass with tax report ppt powerpoint presentation gallery design templates pdf to dispense important information. This template comprises three stages. It also presents valuable insights into the topics including magnifying glass with tax report. This is a completely customizable PowerPoint theme that can be put to use immediately. So, download it and address the topic impactfully.

Quarterly Report To Analyze Marketing Revenue Quarterly Report Ppt Sample
This slide highlights key revenue sources, including data access fees and product sales, alongside detailed expense allocations, with seminars and staff compensation leading costs. If your project calls for a presentation, then Slidegeeks is your go-to partner because we have professionally designed, easy-to-edit templates that are perfect for any presentation. After downloading, you can easily edit Quarterly Report To Analyze Marketing Revenue Quarterly Report Ppt Sample and make the changes accordingly. You can rearrange slides or fill them with different images. Check out all the handy templates This slide highlights key revenue sources, including data access fees and product sales, alongside detailed expense allocations, with seminars and staff compensation leading costs.
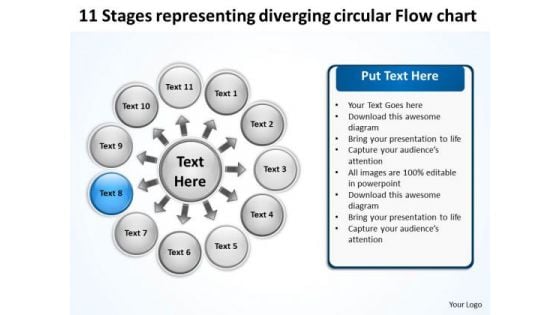
11 Stages Representing Diverging Circular Flow Chart Cycle Layout Network PowerPoint Slides
We present our 11 stages representing diverging circular flow chart Cycle Layout Network PowerPoint Slides.Download and present our Arrows PowerPoint Templates because this helps you to chart the path ahead to arrive at your destination and acheive the goal. Present our Flow charts PowerPoint Templates because your business and plans for its growth consist of processes that are highly co-related. Use our Business PowerPoint Templates because this diagram can set an example to enthuse your team with the passion and fervour of your ideas. Download and present our Process and Flows PowerPoint Templates because it is in your DNA to analyse possible causes to the minutest detail. Present our Circle charts PowerPoint Templates because your marketing strategies can funnel down to the cone, stage by stage, refining as you go along.Use these PowerPoint slides for presentations relating to Assess, assessment, background, benefit, business, chart, circle, company, concept, control, cost, crisis, data, diagram, drawing, explanation, finance, financial, flow, flowchart, graph, graphic, idea, identify, illustration, information, invest, investment, manage, management, model, office, organization, organization, plan, presentation, process, profit, reduce, schema, sketch, strategy, success. The prominent colors used in the PowerPoint template are Green lime, Black, White. You can be sure our 11 stages representing diverging circular flow chart Cycle Layout Network PowerPoint Slides will help them to explain complicated concepts. Presenters tell us our company PowerPoint templates and PPT Slides are Romantic. We assure you our 11 stages representing diverging circular flow chart Cycle Layout Network PowerPoint Slides are Luxurious. Customers tell us our concept PowerPoint templates and PPT Slides are Stylish. Presenters tell us our 11 stages representing diverging circular flow chart Cycle Layout Network PowerPoint Slides are Luxuriant. You can be sure our background PowerPoint templates and PPT Slides are Royal. Our 11 Stages Representing Diverging Circular Flow Chart Cycle Layout Network PowerPoint Slides have a chrismatic effect. The audience will attest to your brilliance.
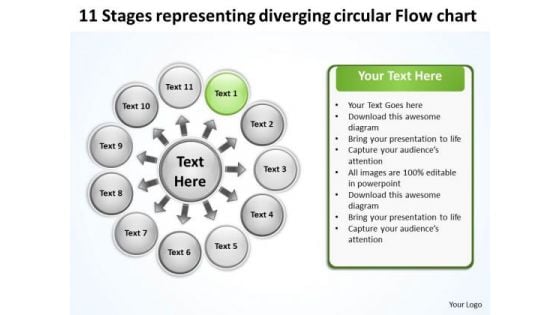
11 Stages Representing Diverging Circular Flow Chart Target Network PowerPoint Templates
We present our 11 stages representing diverging circular flow chart Target Network PowerPoint templates.Download our Arrows PowerPoint Templates because you can Enlighten them with your brilliant understanding of mental health. Use our Flow charts PowerPoint Templates because this an appropriate template to get your ideas across to your target audience. Download our Business PowerPoint Templates because this is Aesthetically designed to make a great first impression this template highlights . Use our Process and Flows PowerPoint Templates because you know the path so show the way. Present our Circle charts PowerPoint Templates because watching them will strengthen your companys sinews.Use these PowerPoint slides for presentations relating to Assess, assessment, background, benefit, business, chart, circle, company, concept, control, cost, crisis, data, diagram, drawing, explanation, finance, financial, flow, flowchart, graph, graphic, idea, identify, illustration, information, invest, investment, manage, management, model, office, organization, organization, plan, presentation, process, profit, reduce, schema, sketch, strategy, success. The prominent colors used in the PowerPoint template are Blue, Gray, White. You can be sure our 11 stages representing diverging circular flow chart Target Network PowerPoint templates are Delightful. Presenters tell us our business PowerPoint templates and PPT Slides are Wistful. We assure you our 11 stages representing diverging circular flow chart Target Network PowerPoint templates effectively help you save your valuable time. Customers tell us our business PowerPoint templates and PPT Slides are Gorgeous. Presenters tell us our 11 stages representing diverging circular flow chart Target Network PowerPoint templates are Glamorous. You can be sure our circle PowerPoint templates and PPT Slides will make the presenter successul in his career/life. Our 11 Stages Representing Diverging Circular Flow Chart Target Network PowerPoint Templates give expression to your drive. They emit the essence of your determination.

Global Data Security Industry Report Key Considerations Assumptions Of Cybersecurity Industry Report IR SS V
The slide represents key considerations and limitations while building the cybersecurity industry report. The purpose of this slide is to provide framework and context for analysis and projections in addition to acknowledging uncertainties and potential risks in the future. Make sure to capture your audiences attention in your business displays with our gratis customizable Global Data Security Industry Report Key Considerations Assumptions Of Cybersecurity Industry Report IR SS V. These are great for business strategies, office conferences, capital raising or task suggestions. If you desire to acquire more customers for your tech business and ensure they stay satisfied, create your own sales presentation with these plain slides. The slide represents key considerations and limitations while building the cybersecurity industry report. The purpose of this slide is to provide framework and context for analysis and projections in addition to acknowledging uncertainties and potential risks in the future.
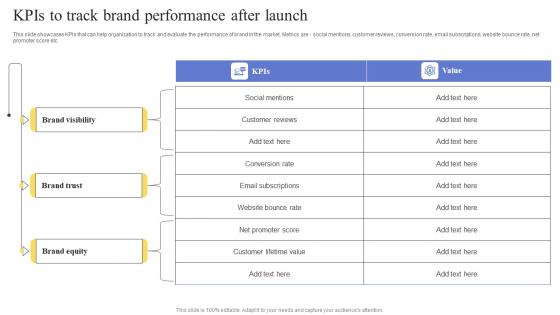
KPIS To Track Brand Performance After Launch Maximizing Revenue Using Demonstration Pdf
This slide showcases KPIs that can help organization to track and evaluate the performance of brand in the market. Metrics are - social mentions, customer reviews, conversion rate, email subscriptions, website bounce rate, net promoter score etc. The KPIS To Track Brand Performance After Launch Maximizing Revenue Using Demonstration Pdf is a compilation of the most recent design trends as a series of slides. It is suitable for any subject or industry presentation, containing attractive visuals and photo spots for businesses to clearly express their messages. This template contains a variety of slides for the user to input data, such as structures to contrast two elements, bullet points, and slides for written information. Slidegeeks is prepared to create an impression. This slide showcases KPIs that can help organization to track and evaluate the performance of brand in the market. Metrics are - social mentions, customer reviews, conversion rate, email subscriptions, website bounce rate, net promoter score etc.
Apparel Retail Management Sales Dashboard Professional Pdf
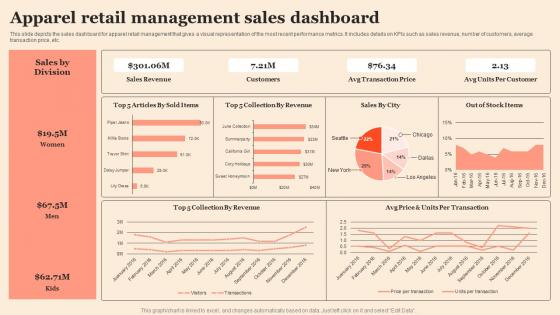
This slide depicts the sales dashboard for apparel retail management that gives a visual representation of the most recent performance metrics. It includes details on KPIs such as sales revenue, number of customers, average transaction price, etc.Pitch your topic with ease and precision using this Apparel Retail Management Sales Dashboard Professional Pdf This layout presents information on Sales Revenue, Transaction Price, Units Per Customer It is also available for immediate download and adjustment. So, changes can be made in the color, design, graphics or any other component to create a unique layout. This slide depicts the sales dashboard for apparel retail management that gives a visual representation of the most recent performance metrics. It includes details on KPIs such as sales revenue, number of customers, average transaction price, etc.
Market Potential Beauty Brand Capital Raising Pitch Deck Pictures Pdf
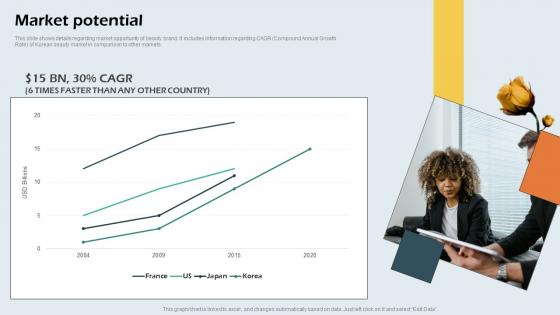
This slide shows details regarding market opportunity of beauty brand. It includes information regarding CAGR Compound Annual Growth Rate of Korean beauty market in comparison to other markets. Are you in need of a template that can accommodate all of your creative concepts This one is crafted professionally and can be altered to fit any style. Use it with Google Slides or PowerPoint. Include striking photographs, symbols, depictions, and other visuals. Fill, move around, or remove text boxes as desired. Test out color palettes and font mixtures. Edit and save your work, or work with colleagues. Download Market Potential Beauty Brand Capital Raising Pitch Deck Pictures Pdf and observe how to make your presentation outstanding. Give an impeccable presentation to your group and make your presentation unforgettable. This slide shows details regarding market opportunity of beauty brand. It includes information regarding CAGR Compound Annual Growth Rate of Korean beauty market in comparison to other markets.
Value Proposition Paubox Capital Funding Pitch Deck Pictures Pdf
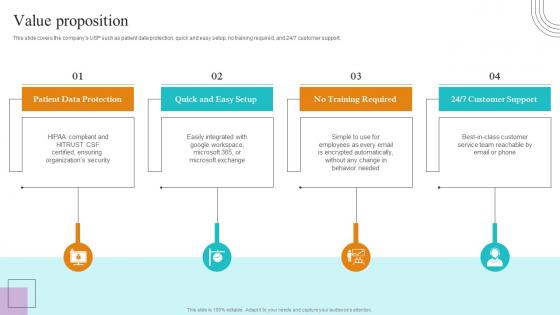
This slide covers the companys USP such as patient data protection, quick and easy setup, no training required, and 24 7 customer support. Slidegeeks has constructed Value Proposition Paubox Capital Funding Pitch Deck Pictures Pdf after conducting extensive research and examination. These presentation templates are constantly being generated and modified based on user preferences and critiques from editors. Here, you will find the most attractive templates for a range of purposes while taking into account ratings and remarks from users regarding the content. This is an excellent jumping off point to explore our content and will give new users an insight into our top notch PowerPoint Templates. This slide covers the companys USP such as patient data protection, quick and easy setup, no training required, and 24 7 customer support.
Sustainable Economic Advantages Of Green Cloud Computing
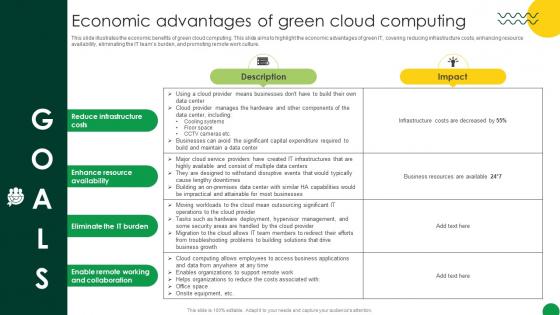
This slide illustrates the economic benefits of green cloud computing. This slide aims to highlight the economic advantages of green IT, covering reducing infrastructure costs, enhancing resource availability, eliminating the IT teams burden, and promoting remote work culture. This modern and well-arranged Sustainable Economic Advantages Of Green Cloud Computing provides lots of creative possibilities. It is very simple to customize and edit with the Powerpoint Software. Just drag and drop your pictures into the shapes. All facets of this template can be edited with Powerpoint, no extra software is necessary. Add your own material, put your images in the places assigned for them, adjust the colors, and then you can show your slides to the world, with an animated slide included. This slide illustrates the economic benefits of green cloud computing. This slide aims to highlight the economic advantages of green IT, covering reducing infrastructure costs, enhancing resource availability, eliminating the IT teams burden, and promoting remote work culture.

Green Computing Economic Advantages Of Green Cloud Computing
This slide illustrates the economic benefits of green cloud computing. This slide aims to highlight the economic advantages of green IT, covering reducing infrastructure costs, enhancing resource availability, eliminating the IT teams burden, and promoting remote work culture. Slidegeeks is here to make your presentations a breeze with Green Computing Economic Advantages Of Green Cloud Computing With our easy-to-use and customizable templates, you can focus on delivering your ideas rather than worrying about formatting. With a variety of designs to choose from, you are sure to find one that suits your needs. And with animations and unique photos, illustrations, and fonts, you can make your presentation pop. So whether you are giving a sales pitch or presenting to the board, make sure to check out Slidegeeks first This slide illustrates the economic benefits of green cloud computing. This slide aims to highlight the economic advantages of green IT, covering reducing infrastructure costs, enhancing resource availability, eliminating the IT teams burden, and promoting remote work culture.

Economic Advantages Of Green Cloud Computing Eco Friendly Computing IT
This slide illustrates the economic benefits of green cloud computing. This slide aims to highlight the economic advantages of green IT, covering reducing infrastructure costs, enhancing resource availability, eliminating the IT teams burden, and promoting remote work culture.Slidegeeks is here to make your presentations a breeze with Economic Advantages Of Green Cloud Computing Eco Friendly Computing IT With our easy-to-use and customizable templates, you can focus on delivering your ideas rather than worrying about formatting. With a variety of designs to choose from, you are sure to find one that suits your needs. And with animations and unique photos, illustrations, and fonts, you can make your presentation pop. So whether you are giving a sales pitch or presenting to the board, make sure to check out Slidegeeks first This slide illustrates the economic benefits of green cloud computing. This slide aims to highlight the economic advantages of green IT, covering reducing infrastructure costs, enhancing resource availability, eliminating the IT teams burden, and promoting remote work culture.
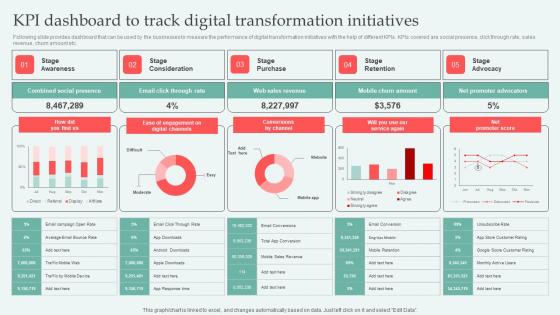
KPI Dashboard To Track Digital Approaches To Increase Business Growth Professional Pdf
Following slide provides dashboard that can be used by the businesses to measure the performance of digital transformation initiatives with the help of different KPIs. KPIs covered are social presence, click through rate, sales revenue, churn amount etc. If your project calls for a presentation, then Slidegeeks is your go to partner because we have professionally designed, easy to edit templates that are perfect for any presentation. After downloading, you can easily edit KPI Dashboard To Track Digital Approaches To Increase Business Growth Professional Pdf and make the changes accordingly. You can rearrange slides or fill them with different images. Check out all the handy templates Following slide provides dashboard that can be used by the businesses to measure the performance of digital transformation initiatives with the help of different KPIs. KPIs covered are social presence, click through rate, sales revenue, churn amount etc.
Dashboard Ppt PowerPoint Presentation Icon
This is a dashboard ppt powerpoint presentation icon. This is a three stage process. The stages in this process are revenue, units sold, purchase value revenue, units sold, purchase value.
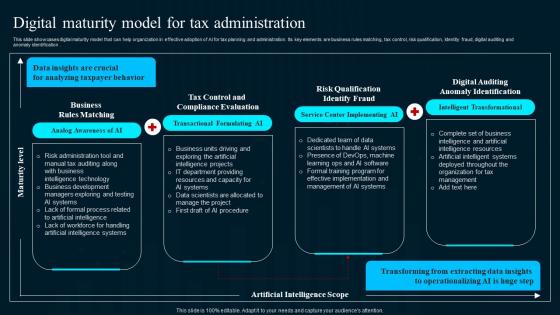
Digital Maturity Model For Tax Administration Artificial Intelligence Applications Structure Pdf
This slide showcases digital maturity model that can help organization in effective adoption of AI for tax planning and administration. Its key elements are business rules matching, tax control, risk qualification, Identity fraud, digital auditing and anomaly identification .Slidegeeks is here to make your presentations a breeze with Digital Maturity Model For Tax Administration Artificial Intelligence Applications Structure Pdf With our easy-to-use and customizable templates, you can focus on delivering your ideas rather than worrying about formatting. With a variety of designs to choose from, you are sure to find one that suits your needs. And with animations and unique photos, illustrations, and fonts, you can make your presentation pop. So whether you are giving a sales pitch or presenting to the board, make sure to check out Slidegeeks first. This slide showcases digital maturity model that can help organization in effective adoption of AI for tax planning and administration. Its key elements are business rules matching, tax control, risk qualification, Identity fraud, digital auditing and anomaly identification .
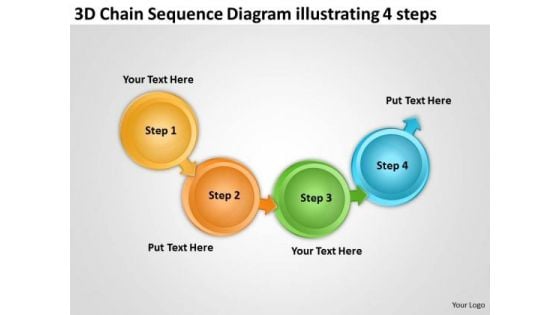
3d Chain Sequence Diagram Illustrating 4 Steps Make Flowchart PowerPoint Templates
We present our 3d chain sequence diagram illustrating 4 steps make flowchart PowerPoint templates.Use our Arrows PowerPoint Templates because you can Step by step develop the entire picture and project it onto their minds. Present our Spheres PowerPoint Templates because this slide is an excellent backdrop for you to enlighten your audience on the process you have gone through and the vision you have for the future. Download our Process and Flows PowerPoint Templates because different people with differing ideas and priorities perform together to score. Download and present our Marketing PowerPoint Templates because customer satisfaction is a mantra of the marketplace. Building a loyal client base is an essential element of your business. Download and present our Circle Charts PowerPoint Templates because in our day to day pursuits we tend to overlook the fundamentals.Use these PowerPoint slides for presentations relating to Arrow, Business, Chain, Chart, Circle, Circle Frame, Color, Concept, Connect, Connection, Connectivity, Corporate, Data, Design, Diagram, Financial, Flow, Flowchart, Graph, Graphical, Group, Important, Organization, Organize, Plan, Process, Rectangle, Relation, Set, Steps, Structure, Teamwork. The prominent colors used in the PowerPoint template are Blue, Green, Yellow. Customers tell us our 3d chain sequence diagram illustrating 4 steps make flowchart PowerPoint templates are Classic. The feedback we get is that our Chain PowerPoint templates and PPT Slides are Stunning. Professionals tell us our 3d chain sequence diagram illustrating 4 steps make flowchart PowerPoint templates are Bright. People tell us our Concept PowerPoint templates and PPT Slides will make you look like a winner. Customers tell us our 3d chain sequence diagram illustrating 4 steps make flowchart PowerPoint templates are specially created by a professional team with vast experience. They diligently strive to come up with the right vehicle for your brilliant Ideas. Professionals tell us our Circle PowerPoint templates and PPT Slides are Tasteful. Your thoughts will be engraved in the minds of your audience. Our 3d Chain Sequence Diagram Illustrating 4 Steps Make Flowchart PowerPoint Templates will etch them in.
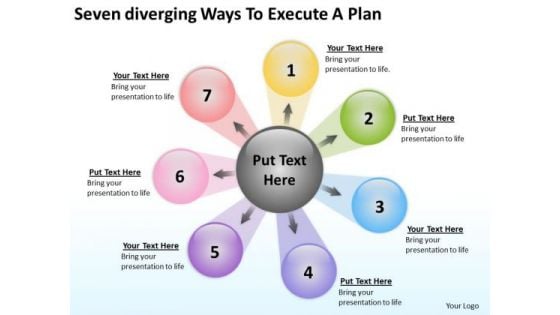
Seven Diverging Ways To Execute Plan Cycle Process Diagram PowerPoint Slides
We present our seven diverging ways to execute plan Cycle Process Diagram PowerPoint Slides.Download our Background PowerPoint Templates because it helps you to get your team in the desired sequence into the bracket. Present our Circle Charts PowerPoint Templates because you have a great plan to put the pieces together, getting all the various contributors to gel for a successful completion. Download our Business PowerPoint Templates because project your ideas to you colleagues and complete the full picture. Download our Shapes PowerPoint Templates because there are a bunch of ideas brewing in your head which give you the heady taste of success. Use our Flow Charts PowerPoint Templates because visual appeal is a priority for us.Use these PowerPoint slides for presentations relating to 3d, abstract, aim, arrow, background, business, career, chart, circle, color, concept, creative, curve, design, development, direction, financial, flowing, gain, graph, green, group, growth, higher, illustration, increase, isolated, motion, moving, moving up, path, prediction, progress, red, series, shape, sign, success, symbol, target, turn, twisted, up, upload, upward, way, white, win. The prominent colors used in the PowerPoint template are Yellow, Green, Blue. Customers tell us our seven diverging ways to execute plan Cycle Process Diagram PowerPoint Slides will help them to explain complicated concepts. PowerPoint presentation experts tell us our arrow PowerPoint templates and PPT Slides are Playful. People tell us our seven diverging ways to execute plan Cycle Process Diagram PowerPoint Slides are Detailed. People tell us our circle PowerPoint templates and PPT Slides are readymade to fit into any presentation structure. Customers tell us our seven diverging ways to execute plan Cycle Process Diagram PowerPoint Slides are Swanky. People tell us our arrow PowerPoint templates and PPT Slides are Fancy. Amaze yourself with our Seven Diverging Ways To Execute Plan Cycle Process Diagram PowerPoint Slides. You will be astounded by what is on offer.
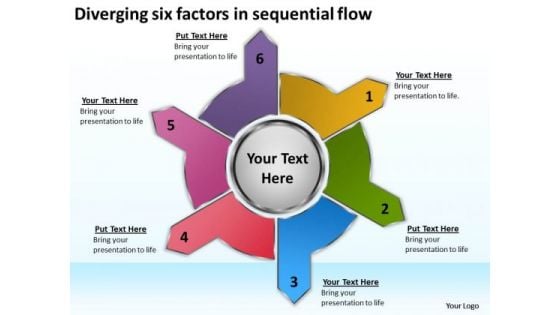
Six Factors In Sequential Flow Relative Circular Arrow Diagram PowerPoint Templates
We present our six factors in sequential flow Relative Circular Arrow Diagram PowerPoint templates.Present our Circle Charts PowerPoint Templates because you have made significant headway in this field. Use our Arrows PowerPoint Templates because this diagram helps to reaffirm to your team your faith in maintaining the highest ethical standards. Download and present our Business PowerPoint Templates because project your ideas to you colleagues and complete the full picture. Present our Shapes PowerPoint Templates because it Educates your team with your thoughts and logic. Download our Flow Charts PowerPoint Templates because it can illustrate your chain of ideas focusing on that aspect or resource in order to enhance the quality of your product.Use these PowerPoint slides for presentations relating to 3d, abstract, aim, arrow, background, business, career, chart, circle, color, concept, creative, curve, design, development, direction, financial, flowing, gain, graph, green, group, growth, higher, illustration, increase, isolated, motion, moving, moving up, path, prediction, progress, red, series, shape, sign, success, symbol, target, turn, twisted, up, upload, upward, way, white, win. The prominent colors used in the PowerPoint template are Blue, Red, Pink. Customers tell us our six factors in sequential flow Relative Circular Arrow Diagram PowerPoint templates are Playful. PowerPoint presentation experts tell us our aim PowerPoint templates and PPT Slides are Nice. People tell us our six factors in sequential flow Relative Circular Arrow Diagram PowerPoint templates are No-nonsense. People tell us our career PowerPoint templates and PPT Slides are Spectacular. Customers tell us our six factors in sequential flow Relative Circular Arrow Diagram PowerPoint templates are Magnificent. People tell us our background PowerPoint templates and PPT Slides are Magnificent. Many feel defeated by what has befallen them. Brush up their courage with our Six Factors In Sequential Flow Relative Circular Arrow Diagram PowerPoint Templates.
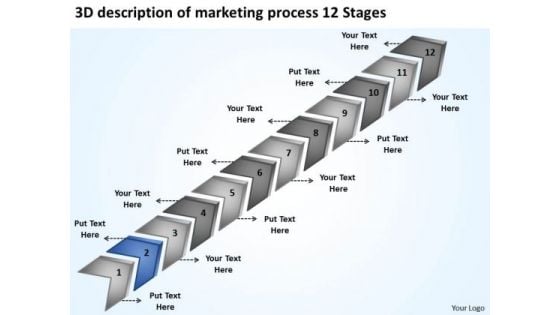
3d Description Of Marketing Process 12 Stages Ppt Business Plan Development PowerPoint Slides
We present our 3d description of marketing process 12 stages ppt business plan development PowerPoint Slides.Use our Process and flows PowerPoint Templates because it enlightens your team and colleagues on the critical factors involved. Download our Arrows PowerPoint Templates because this slide helps you to give your team an overview of your capability and insight into the minute details of the overall picture highlighting the interdependence at every operational level. Use our Flow charts PowerPoint Templates because you can Explain the contribution of each of the elements and how they provide impetus to the next phase. Download our Business PowerPoint Templates because your fledgling career is in the chrysallis stage. Nurture it and watch it grow into a beautiful butterfly. Download and present our Marketing PowerPoint Templates because you can Enlighten them with your brilliant understanding of mental health.Use these PowerPoint slides for presentations relating to arrow, background, bullet, business, chart, checkmark, chevron, diagram, drop financial, five, glass, graphic, gray, icon, illustration, management, point, process project, reflection, set, shadow, stage, text, transparency. The prominent colors used in the PowerPoint template are Blue, Gray, Black. You can be sure our 3d description of marketing process 12 stages ppt business plan development PowerPoint Slides are Glamorous. You can be sure our chevron PowerPoint templates and PPT Slides are Tasteful. People tell us our 3d description of marketing process 12 stages ppt business plan development PowerPoint Slides are designed by professionals We assure you our chevron PowerPoint templates and PPT Slides are incredible easy to use. The feedback we get is that our 3d description of marketing process 12 stages ppt business plan development PowerPoint Slides are Efficient. We assure you our bullet PowerPoint templates and PPT Slides are Energetic. Invite praises with our 3d Description Of Marketing Process 12 Stages Ppt Business Plan Development PowerPoint Slides. Make sure your presentation gets the attention it deserves.
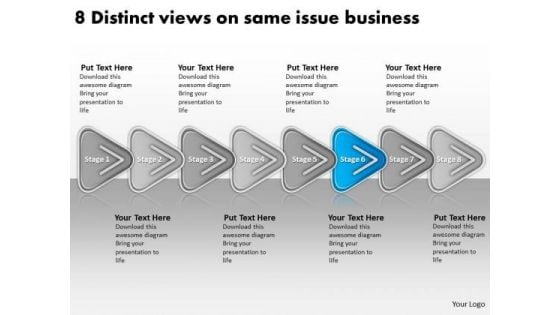
Views On Same Issue Business PowerPoint Theme Free Plan Examples Slides
We present our views on same issue business powerpoint theme free plan examples Slides.Present our Process and Flows PowerPoint Templates because this slide shows each path to the smallest detail. Use our Shapes PowerPoint Templates because you can Refine them all as you take them through the numerous filtering stages of the funnel of your quality control process. Present our Arrows PowerPoint Templates because the lessons have been analyzed, studied and conclusions drawn. Present our Flow charts PowerPoint Templates because your marketing strategies can funnel down to the cone, stage by stage, refining as you go along. Download and present our Business PowerPoint Templates because you have the entire picture in mind.Use these PowerPoint slides for presentations relating to Arrows, background, bullet, business, chart, checkmark, chevron, diagram, drop, financial, glass, graphic, gray, icon, illustration, isometric, management, blue, perspective, placeholder, point, process, project, reflection, set, shadow, silver, stage, text, eleven, transparency. The prominent colors used in the PowerPoint template are Blue, Black, Gray. The feedback we get is that our views on same issue business powerpoint theme free plan examples Slides are Flirty. The feedback we get is that our chart PowerPoint templates and PPT Slides are Sparkling. People tell us our views on same issue business powerpoint theme free plan examples Slides are Amazing. We assure you our diagram PowerPoint templates and PPT Slides help you meet deadlines which are an element of today's workplace. Just browse and pick the slides that appeal to your intuitive senses. We assure you our views on same issue business powerpoint theme free plan examples Slides are aesthetically designed to attract attention. We guarantee that they will grab all the eyeballs you need. The feedback we get is that our chart PowerPoint templates and PPT Slides are No-nonsense. Our Views On Same Issue Business PowerPoint Theme Free Plan Examples Slides don't fiddle about. They get into action right away.
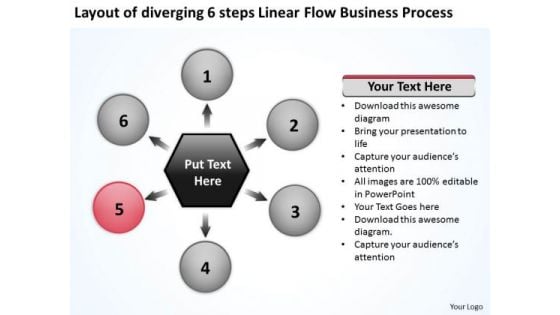
Linear Flow World Business PowerPoint Templates Process Ppt Gear
We present our linear flow world business powerpoint templates process ppt Gear.Download our Circle charts PowerPoint Templates because you can asked to strive to give true form to your great dream. Download our Process and Flows PowerPoint Templates because you have made significant headway in this field. Download and present our Ring Charts PowerPoint Templates because this slide helps you to give your team an overview of your capability and insight into the minute details of the overall picture highlighting the interdependence at every operational level. Download our Flow charts PowerPoint Templates because you must Evolve the strategy to take you down the required path with appropriate, efficient and effective marketing along the way. Present our Arrows PowerPoint Templates because they are the stepping stones of our journey till date.Use these PowerPoint slides for presentations relating to Communication,competition, development, diagram,direction, element, finance, financial,forward, graphic, growth, guide,increase, investment, leader, leadership,management, marketing, motion,moving, organization, path, plan,presentation, price, profit, progress,report, representation, shape, sign. The prominent colors used in the PowerPoint template are Red, White, Black. People tell us our linear flow world business powerpoint templates process ppt Gear are Handsome. Customers tell us our element PowerPoint templates and PPT Slides are Liberated. Professionals tell us our linear flow world business powerpoint templates process ppt Gear are effectively colour coded to prioritise your plans They automatically highlight the sequence of events you desire. Presenters tell us our direction PowerPoint templates and PPT Slides are Delightful. Use our linear flow world business powerpoint templates process ppt Gear are Efficacious. Presenters tell us our direction PowerPoint templates and PPT Slides are Exuberant. Aim at your target with our Linear Flow World Business PowerPoint Templates Process Ppt Gear. You will come out on top.
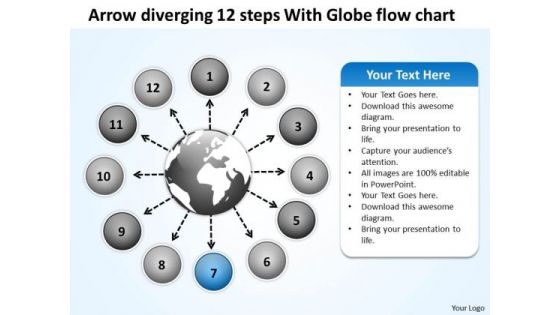
Arrow Diverging 12 Steps With Globe Flow Chart Circular PowerPoint Slides
We present our arrow diverging 12 steps with globe flow chart Circular PowerPoint Slides.Use our Circle Charts PowerPoint Templates because this diagram put it all together to form the complete picture and reach the goal. Use our Arrows PowerPoint Templates because the chart is designed to give you the flavour of the kind of tools you may need and the work that is performed in the lifecycle. Present our Globe PowerPoint Templates because you require care and diligence to function well. Use our Business PowerPoint Templates because this is the unerring accuracy in reaching the target. the effortless ability to launch into flight. Use our Flow Charts PowerPoint Templates because your marketing strategies can funnel down to the cone, stage by stage, refining as you go along.Use these PowerPoint slides for presentations relating to 3d, abstract, aim, arrow, background, business, career, chart, circle, color, concept, creative, curve, design, development, direction, financial, flowing, gain, graph, green, group, growth, higher, illustration, increase, isolated, motion, moving, moving up, path, prediction, progress, red, series, shape, sign, success, symbol, target, turn, twisted, up, upload, upward, way, white, win. The prominent colors used in the PowerPoint template are Blue, Gray, White. PowerPoint presentation experts tell us our arrow diverging 12 steps with globe flow chart Circular PowerPoint Slides are Energetic. PowerPoint presentation experts tell us our career PowerPoint templates and PPT Slides are Delightful. Presenters tell us our arrow diverging 12 steps with globe flow chart Circular PowerPoint Slides have awesome images to get your point across. Presenters tell us our background PowerPoint templates and PPT Slides are Clever. You can be sure our arrow diverging 12 steps with globe flow chart Circular PowerPoint Slides are Enchanting. We assure you our chart PowerPoint templates and PPT Slides are Bold. Exhibit your erudition on our Arrow Diverging 12 Steps With Globe Flow Chart Circular PowerPoint Slides. Give the audience a taste of your profound knowledge.
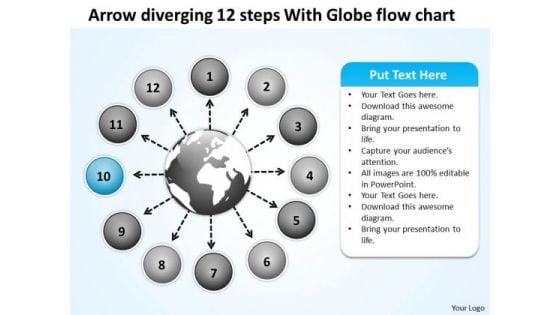
Arrow Diverging 12 Steps With Globe Flow Chart Target Network PowerPoint Templates
We present our arrow diverging 12 steps with globe flow chart Target Network PowerPoint templates.Download and present our Circle Charts PowerPoint Templates because the gears of youthful minds are useful, therefore set them in motion. Use our Arrows PowerPoint Templates because honesty is the best policy has an ardent follower in you. Use our Globe PowerPoint Templates because you have the entire picture in mind. Download our Business PowerPoint Templates because your ideas too are pinpointedly focused on you goals. Use our Flow Charts PowerPoint Templates because you are buzzing with ideas.Use these PowerPoint slides for presentations relating to 3d, abstract, aim, arrow, background, business, career, chart, circle, color, concept, creative, curve, design, development, direction, financial, flowing, gain, graph, green, group, growth, higher, illustration, increase, isolated, motion, moving, moving up, path, prediction, progress, red, series, shape, sign, success, symbol, target, turn, twisted, up, upload, upward, way, white, win. The prominent colors used in the PowerPoint template are Blue, Gray, White. PowerPoint presentation experts tell us our arrow diverging 12 steps with globe flow chart Target Network PowerPoint templates are Clever. PowerPoint presentation experts tell us our background PowerPoint templates and PPT Slides are Delightful. Presenters tell us our arrow diverging 12 steps with globe flow chart Target Network PowerPoint templates are Nostalgic. Presenters tell us our background PowerPoint templates and PPT Slides are Stylish. You can be sure our arrow diverging 12 steps with globe flow chart Target Network PowerPoint templates are Festive. We assure you our background PowerPoint templates and PPT Slides are Nice. Stop your audience's blank gaze. Get them interestedwith our Arrow Diverging 12 Steps With Globe Flow Chart Target Network PowerPoint Templates. You'll deliver your best presentation yet.
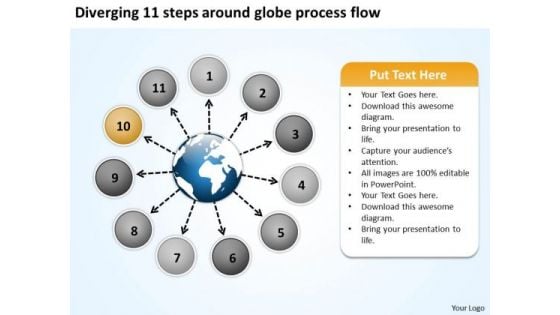
Diverging 11 Steps Around Globe Process Flow Ppt Cycle Chart PowerPoint Slides
We present our diverging 11 steps around globe process flow ppt Cycle Chart PowerPoint Slides.Present our Globe PowerPoint Templates because Our PowerPoint Templates and Slides are specially created by a professional team with vast experience. They diligently strive to come up with the right vehicle for your brilliant Ideas. Download and present our Business PowerPoint Templates because project your ideas to you colleagues and complete the full picture. Use our Circle Charts PowerPoint Templates because motivating your team will cross all barriers. Download and present our Flow charts PowerPoint Templates because it gives a core idea about various enveloping layers. Download and present our Marketing PowerPoint Templates because this can explain the various related aspects of these varied tracks and how they will, on hitting their own targets, cumulatively contribute to hitting GOLD.Use these PowerPoint slides for presentations relating to Around, arrow, business, chart, circle,circular, circulation, commerce, concept,curving, cycle, diagram, direction,element, finance, financial,flow, flowchart, flowing, global, globe,internet, investment, loop, map, market,motion, movement, moving,presentation, process, recession,recycle, repeat, repetitive, ring, rotation,round, savings, shape. The prominent colors used in the PowerPoint template are Blue, Black, Gray. People tell us our diverging 11 steps around globe process flow ppt Cycle Chart PowerPoint Slides are Bold. Professionals tell us our chart PowerPoint templates and PPT Slides help you meet deadlines which are an element of today's workplace. Just browse and pick the slides that appeal to your intuitive senses. We assure you our diverging 11 steps around globe process flow ppt Cycle Chart PowerPoint Slides are second to none. PowerPoint presentation experts tell us our concept PowerPoint templates and PPT Slides are Upbeat. We assure you our diverging 11 steps around globe process flow ppt Cycle Chart PowerPoint Slides are Clever. People tell us our circular PowerPoint templates and PPT Slides are Efficacious. Addsome spice with our Diverging 11 Steps Around Globe Process Flow Ppt Cycle Chart PowerPoint Slides. Give your thoughts the right flavour.
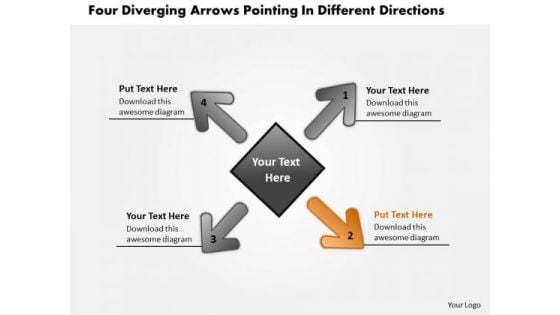
Diverging Arrows Pointing Different Directions Circular Process Chart PowerPoint Slides
We present our diverging arrows pointing different directions Circular Process Chart PowerPoint Slides.Present our Arrows PowerPoint Templates because you have an idea of which you are sure. Present our Process and flows PowerPoint Templates because this diagram helps in examine each brilliant thought in thorough detail highlighting all the pros and cons as minutely as possible. Download and present our Business PowerPoint Templates because project your ideas to you colleagues and complete the full picture. Present our Flow charts PowerPoint Templates because you have churned your mind and come up with effective ways and means to further refine it. Use our Signs PowerPoint Templates because forward thinking is the way to go.Use these PowerPoint slides for presentations relating to Arrow, brochure, business,businessman, button, chart, circle,company, cyclic, data, demonstration,diagram, financial, five,glossy, goal, graph, illustration, info,information, investment, man, manage,marketing, model, navigation, option,part, people, person, pie, presentation,process, result, section, segmented. The prominent colors used in the PowerPoint template are Green, White, Black. People tell us our diverging arrows pointing different directions Circular Process Chart PowerPoint Slides will save the presenter time. Professionals tell us our company PowerPoint templates and PPT Slides are Detailed. We assure you our diverging arrows pointing different directions Circular Process Chart PowerPoint Slides will make you look like a winner. PowerPoint presentation experts tell us our business PowerPoint templates and PPT Slides are Elevated. We assure you our diverging arrows pointing different directions Circular Process Chart PowerPoint Slides are Spiffy. People tell us our chart PowerPoint templates and PPT Slides are Appealing. Sharpen your strategy with our Diverging Arrows Pointing Different Directions Circular Process Chart PowerPoint Slides. You will come out on top.
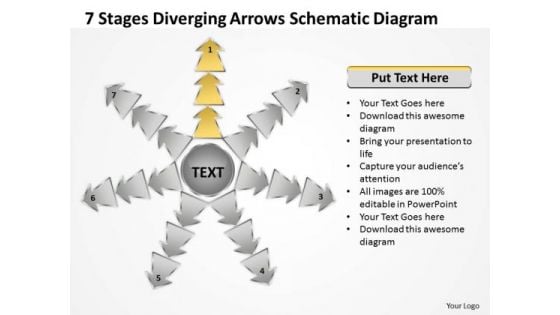
7 Stages Diverging Arrows Schematic Diagram Ppt Charts And Networks PowerPoint Slides
We present our 7 stages diverging arrows schematic diagram ppt Charts and Networks PowerPoint Slides.Download our Marketing PowerPoint Templates because Our PowerPoint Templates and Slides are Clear and concise. Use them and dispel any doubts your team may have. Download and present our Shapes PowerPoint Templates because You can Connect the dots. Fan expectations as the whole picture emerges. Present our Arrows PowerPoint Templates because this Slide offers an excellent background to build up the various stages of your business process. Use our Business PowerPoint Templates because you have analysed many global markets and come up with possibilities. Highlight the pros and cons of other likely business oppurtunities. Download and present our Process and Flows PowerPoint Templates because spreading the light of knowledge around you will clear the doubts and enlighten the questioning minds with your brilliance and ability.Use these PowerPoint slides for presentations relating to Arrows, Business, Chart, Cyclic, Data, Diagram, Financial, Goal, Graph, Illustration, Info, Information, Marketing, Model, Option, Part, Pie, Presentation, Process, Result, Sphere, Statistics. The prominent colors used in the PowerPoint template are Yellow, Gray, Black. The feedback we get is that our 7 stages diverging arrows schematic diagram ppt Charts and Networks PowerPoint Slides are Breathtaking. People tell us our Graph PowerPoint templates and PPT Slides are Splendid. Presenters tell us our 7 stages diverging arrows schematic diagram ppt Charts and Networks PowerPoint Slides are Functional. Use our Graph PowerPoint templates and PPT Slides will make the presenter successul in his career/life. Use our 7 stages diverging arrows schematic diagram ppt Charts and Networks PowerPoint Slides are visually appealing. Use our Graph PowerPoint templates and PPT Slides are Dynamic. Our 7 Stages Diverging Arrows Schematic Diagram Ppt Charts And Networks PowerPoint Slides are committed to benefit you. They ensure your thoughts get the credit.
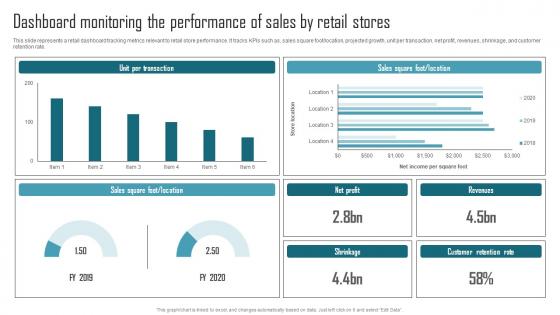
Effective Product Adaptation Dashboard Monitoring The Performance Of Sales By Retail Stores Designs PDF
This slide represents a retail dashboard tracking metrics relevant to retail store performance. It tracks KPIs such as, sales square footlocation, projected growth, unit per transaction, net profit, revenues, shrinkage, and customer retention rate. If your project calls for a presentation, then Slidegeeks is your go-to partner because we have professionally designed, easy-to-edit templates that are perfect for any presentation. After downloading, you can easily edit Effective Product Adaptation Dashboard Monitoring The Performance Of Sales By Retail Stores Designs PDF and make the changes accordingly. You can rearrange slides or fill them with different images. Check out all the handy templates This slide represents a retail dashboard tracking metrics relevant to retail store performance. It tracks KPIs such as, sales square footlocation, projected growth, unit per transaction, net profit, revenues, shrinkage, and customer retention rate.
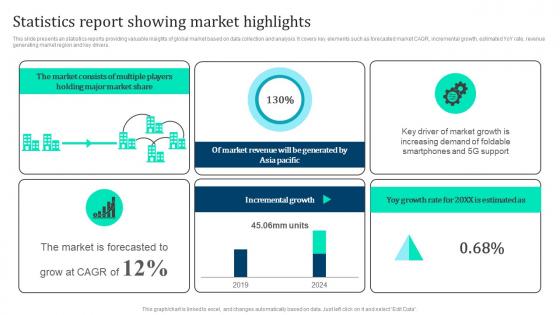
Statistics Report Showing Marketing Intelligence Guide Data Gathering Slides Pdf
This slide presents an statistics reports providing valuable insights of global market based on data collection and analysis. It covers key elements such as forecasted market CAGR, incremental growth, estimated YoY rate, revenue generating market region and key drivers. Get a simple yet stunning designed Statistics Report Showing Marketing Intelligence Guide Data Gathering Slides Pdf. It is the best one to establish the tone in your meetings. It is an excellent way to make your presentations highly effective. So, download this PPT today from Slidegeeks and see the positive impacts. Our easy to edit Statistics Report Showing Marketing Intelligence Guide Data Gathering Slides Pdf can be your go to option for all upcoming conferences and meetings. So, what are you waiting for Grab this template today. This slide presents an statistics reports providing valuable insights of global market based on data collection and analysis. It covers key elements such as forecasted market CAGR, incremental growth, estimated YoY rate, revenue generating market region and key drivers.
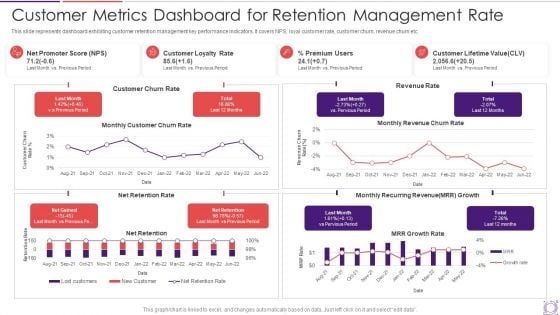
Customer Metrics Dashboard For Retention Management Rate Information PDF
This slide represents dashboard exhibiting customer retention management key performance indicators. It covers NPS, loyal customer rate, customer churn, revenue churn etc. Showcasing this set of slides titled customer metrics dashboard for retention management rate information pdf. The topics addressed in these templates are customer, premium users. All the content presented in this PPT design is completely editable. Download it and make adjustments in color, background, font etc. as per your unique business setting.
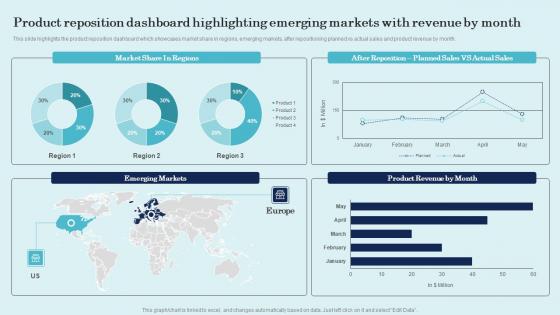
Product Reposition Dashboard Highlighting Emerging Product Repositioning Technique Pictures Pdf
This slide highlights the product reposition dashboard which showcases market share in regions, emerging markets, after repositioning planned vs actual sales and product revenue by month. Welcome to our selection of the Product Reposition Dashboard Highlighting Emerging Product Repositioning Technique Pictures Pdf. These are designed to help you showcase your creativity and bring your sphere to life. Planning and Innovation are essential for any business that is just starting out. This collection contains the designs that you need for your everyday presentations. All of our PowerPoints are 100 percent editable, so you can customize them to suit your needs. This multi-purpose template can be used in various situations. Grab these presentation templates today. This slide highlights the product reposition dashboard which showcases market share in regions, emerging markets, after repositioning planned vs actual sales and product revenue by month.
Referral Program Partners Performance Tracking Dashboard Word Of Mouth Marketing Pictures Pdf
This slide covers dashboard to track effectiveness of partners in referral program along revenue generation. It include elements such as total partners, patner employees, referrals received, revenue earned, etc.Do you know about Slidesgeeks Referral Program Partners Performance Tracking Dashboard Word Of Mouth Marketing Pictures Pdf These are perfect for delivering any kind od presentation. Using it, create PowerPoint presentations that communicate your ideas and engage audiences. Save time and effort by using our pre-designed presentation templates that are perfect for a wide range of topic. Our vast selection of designs covers a range of styles, from creative to business, and are all highly customizable and easy to edit. Download as a PowerPoint template or use them as Google Slides themes. This slide covers dashboard to track effectiveness of partners in referral program along revenue generation. It include elements such as total partners, patner employees, referrals received, revenue earned, etc.
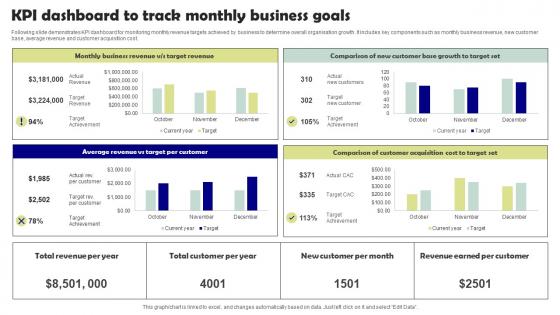
KPI Dashboard To Track Monthly Business Goals Microsoft Pdf
Following slide demonstrates KPI dashboard for monitoring monthly revenue targets achieved by business to determine overall organisation growth. It includes key components such as monthly business revenue, new customer base, average revenue and customer acquisition cost. Pitch your topic with ease and precision using this KPI Dashboard To Track Monthly Business Goals Microsoft Pdf. This layout presents information on Target Per Customer, Target Set. It is also available for immediate download and adjustment. So, changes can be made in the color, design, graphics or any other component to create a unique layout. Following slide demonstrates KPI dashboard for monitoring monthly revenue targets achieved by business to determine overall organisation growth. It includes key components such as monthly business revenue, new customer base, average revenue and customer acquisition cost.
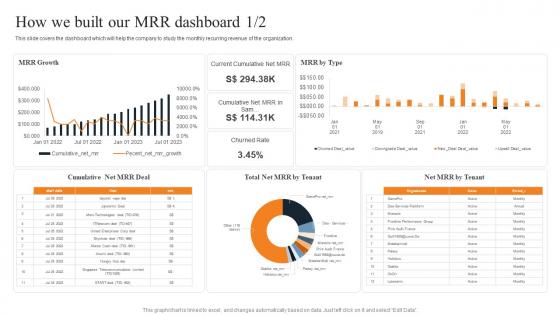
How We Built Our MRR Dashboard Layered Pricing Strategy For Managed Services Mockup Pdf
This slide covers the dashboard which will help the company to study the monthly recurring revenue of the organization. This How We Built Our MRR Dashboard Layered Pricing Strategy For Managed Services Mockup Pdf from Slidegeeks makes it easy to present information on your topic with precision. It provides customization options, so you can make changes to the colors, design, graphics, or any other component to create a unique layout. It is also available for immediate download, so you can begin using it right away. Slidegeeks has done good research to ensure that you have everything you need to make your presentation stand out. Make a name out there for a brilliant performance. This slide covers the dashboard which will help the company to study the monthly recurring revenue of the organization.
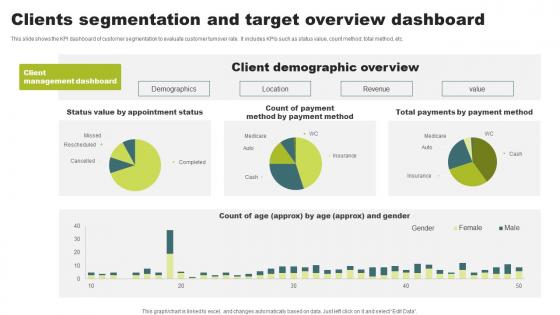
Clients Segmentation And Target Overview Dashboard Microsoft Pdf
This slide shows the KPI dashboard of customer segmentation to evaluate customer turnover rate. It includes KPIs such as status value, count method, total method, etc. Showcasing this set of slides titled Clients Segmentation And Target Overview Dashboard Microsoft Pdf. The topics addressed in these templates are Client Demographic Overview, Revenue, Location. All the content presented in this PPT design is completely editable. Download it and make adjustments in color, background, font etc. as per your unique business setting. This slide shows the KPI dashboard of customer segmentation to evaluate customer turnover rate. It includes KPIs such as status value, count method, total method, etc.
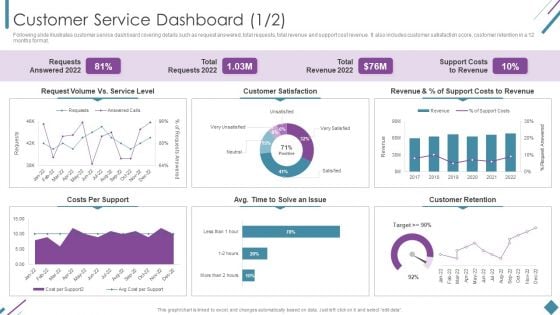
Metrics To Measure Business Performance Customer Service Dashboard Sample PDF
Following slide illustrates customer service dashboard covering details such as request answered, total requests, total revenue and support cost revenue. It also includes customer satisfaction score, customer retention in a 12 months format. Deliver and pitch your topic in the best possible manner with this Metrics To Measure Business Performance Customer Service Dashboard Sample PDF. Use them to share invaluable insights on Requests Answered 2022, Total Requests 2022, Total Revenue 2022 and impress your audience. This template can be altered and modified as per your expectations. So, grab it now.
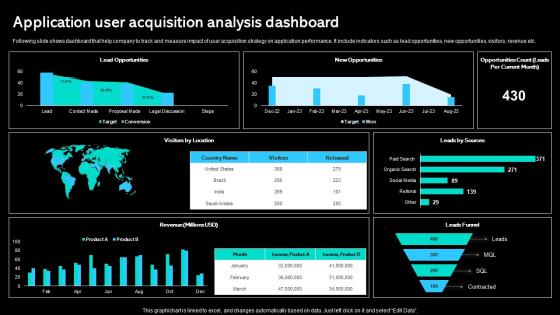
Application User Acquisition Analysis Dashboard Paid Marketing Approach Rules Pdf
Following slide shows dashboard that help company to track and measure impact of user acquisition strategy on application performance. It include indicators such as lead opportunities, new opportunities, visitors, revenue etc. Do you have to make sure that everyone on your team knows about any specific topic I yes, then you should give Application User Acquisition Analysis Dashboard Paid Marketing Approach Rules Pdf a try. Our experts have put a lot of knowledge and effort into creating this impeccable Application User Acquisition Analysis Dashboard Paid Marketing Approach Rules Pdf You can use this template for your upcoming presentations, as the slides are perfect to represent even the tiniest detail. You can download these templates from the Slidegeeks website and these are easy to edit. So grab these today. Following slide shows dashboard that help company to track and measure impact of user acquisition strategy on application performance. It include indicators such as lead opportunities, new opportunities, visitors, revenue etc.
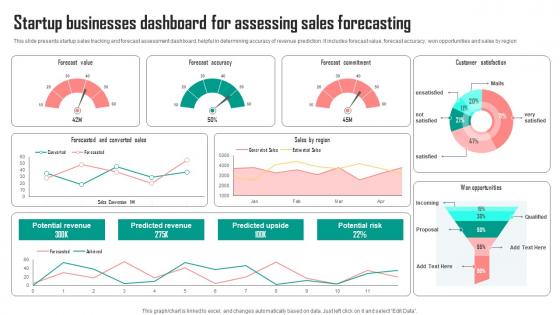
Startup Businesses Dashboard For Assessing Sales Forecasting Background Pdf
This slide presents startup sales tracking and forecast assessment dashboard, helpful in determining accuracy of revenue prediction. It includes forecast value, forecast accuracy, won opportunities and sales by region Pitch your topic with ease and precision using this Startup Businesses Dashboard For Assessing Sales Forecasting Background Pdf. This layout presents information on Forecast Value, Accuracy, Commitment. It is also available for immediate download and adjustment. So, changes can be made in the color, design, graphics or any other component to create a unique layout. This slide presents startup sales tracking and forecast assessment dashboard, helpful in determining accuracy of revenue prediction. It includes forecast value, forecast accuracy, won opportunities and sales by region
Dashboard For Tracking Post Expansion Enhancing Global Presence Graphics Pdf
This slide covers the dashboard for analyzing fast food business sales by location. It includes KPIs such as the companys revenue by location, by type, top 5 expenses by account, top 5 expenses by department, cost of revenue year to date, etc.Find highly impressive Dashboard For Tracking Post Expansion Enhancing Global Presence Graphics Pdf on Slidegeeks to deliver a meaningful presentation. You can save an ample amount of time using these presentation templates. No need to worry to prepare everything from scratch because Slidegeeks experts have already done a huge research and work for you. You need to download Dashboard For Tracking Post Expansion Enhancing Global Presence Graphics Pdf for your upcoming presentation. All the presentation templates are 100Precent editable and you can change the color and personalize the content accordingly. Download now. This slide covers the dashboard for analyzing fast food business sales by location. It includes KPIs such as the companys revenue by location, by type, top 5 expenses by account, top 5 expenses by department, cost of revenue year to date, etc.
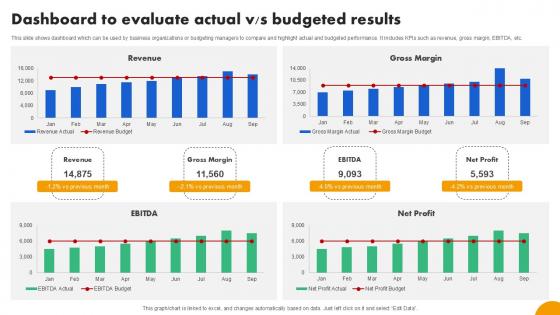
Dashboard To Evaluate Actual Strategies To Develop Effective Ppt PowerPoint Fin SS V
This slide shows dashboard which can be used by business organizations or budgeting managers to compare and highlight actual and budgeted performance. It includes KPIs such as revenue, gross margin, EBITDA, etc. Find highly impressive Dashboard To Evaluate Actual Strategies To Develop Effective Ppt PowerPoint Fin SS V on Slidegeeks to deliver a meaningful presentation. You can save an ample amount of time using these presentation templates. No need to worry to prepare everything from scratch because Slidegeeks experts have already done a huge research and work for you. You need to download Dashboard To Evaluate Actual Strategies To Develop Effective Ppt PowerPoint Fin SS V for your upcoming presentation. All the presentation templates are 100 percent editable and you can change the color and personalize the content accordingly. Download now This slide shows dashboard which can be used by business organizations or budgeting managers to compare and highlight actual and budgeted performance. It includes KPIs such as revenue, gross margin, EBITDA, etc.
Application User Acquisition Analysis Dashboard Online Customer Acquisition Microsoft Pdf
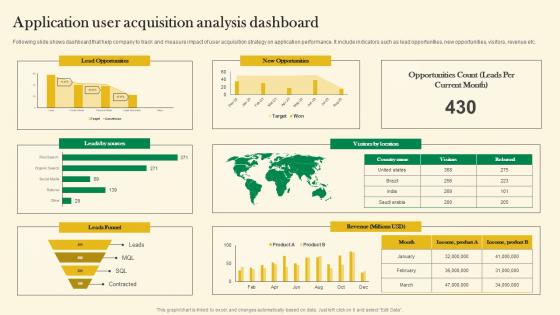
Following slide shows dashboard that help company to track and measure impact of user acquisition strategy on application performance. It include indicators such as lead opportunities, new opportunities, visitors, revenue etc. The best PPT templates are a great way to save time, energy, and resources. Slidegeeks have 100 percent editable powerpoint slides making them incredibly versatile. With these quality presentation templates, you can create a captivating and memorable presentation by combining visually appealing slides and effectively communicating your message. Download Application User Acquisition Analysis Dashboard Online Customer Acquisition Microsoft Pdf from Slidegeeks and deliver a wonderful presentation. Following slide shows dashboard that help company to track and measure impact of user acquisition strategy on application performance. It include indicators such as lead opportunities, new opportunities, visitors, revenue etc.
Dashboard For Enabling Brand Reinforcement Encouraging Repetitive Customer Purchase Ppt Slide
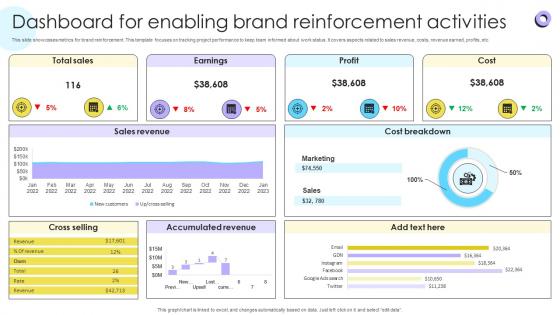
This slide showcases metrics for brand reinforcement. This template focuses on tracking project performance to keep team informed about work status. It covers aspects related to sales revenue, costs, revenue earned, profits, etc. From laying roadmaps to briefing everything in detail, our templates are perfect for you. You can set the stage with your presentation slides. All you have to do is download these easy-to-edit and customizable templates. Dashboard For Enabling Brand Reinforcement Encouraging Repetitive Customer Purchase Ppt Slide will help you deliver an outstanding performance that everyone would remember and praise you for. Do download this presentation today. This slide showcases metrics for brand reinforcement. This template focuses on tracking project performance to keep team informed about work status. It covers aspects related to sales revenue, costs, revenue earned, profits, etc.
Historical Revenue Data Analytics Company Outline Information PDF
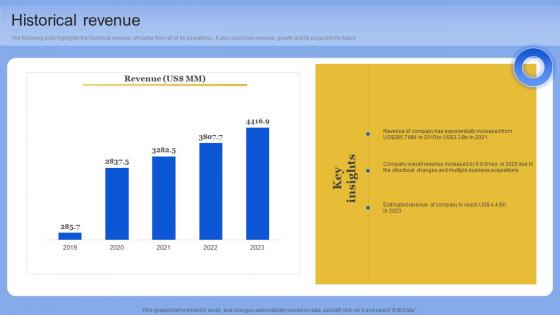
The following slide highlights the historical revenue of Kantar from all of its operations. It also describes revenue growth and its projection for future. This modern and well-arranged Historical Revenue Data Analytics Company Outline Information PDF provides lots of creative possibilities. It is very simple to customize and edit with the Powerpoint Software. Just drag and drop your pictures into the shapes. All facets of this template can be edited with Powerpoint, no extra software is necessary. Add your own material, put your images in the places assigned for them, adjust the colors, and then you can show your slides to the world, with an animated slide included. The following slide highlights the historical revenue of Kantar from all of its operations. It also describes revenue growth and its projection for future
Revenue Streams Big Data Analytics Investor Funding Elevator Pitch Deck
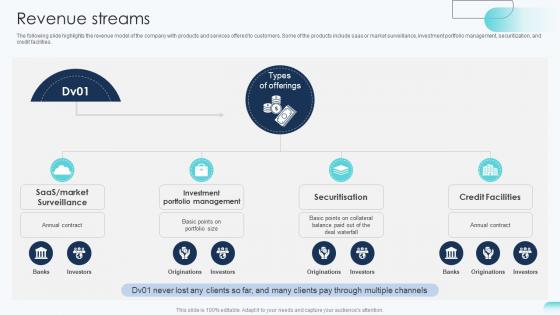
The following slide highlights the revenue model of the company with products and services offered to customers. Some of the products include saas or market surveillance, investment portfolio management, securitization, and credit facilities. This modern and well-arranged Revenue Streams Big Data Analytics Investor Funding Elevator Pitch Deck provides lots of creative possibilities. It is very simple to customize and edit with the Powerpoint Software. Just drag and drop your pictures into the shapes. All facets of this template can be edited with Powerpoint, no extra software is necessary. Add your own material, put your images in the places assigned for them, adjust the colors, and then you can show your slides to the world, with an animated slide included. The following slide highlights the revenue model of the company with products and services offered to customers. Some of the products include saas or market surveillance, investment portfolio management, securitization, and credit facilities.

Facebook Marketing Plan Facebook Ads Dashboard With Campaign Performance Strategy SS V

Facebook Marketing Techniques Facebook Ads Dashboard With Campaign Strategy SS V
The following slide outlines comprehensive dashboard through which advertisers can monitor Facebook ads performance. The KPIs outlined in slide are ad spend, conversions, cost per conversion, cost per action, brand impressions, clicks, etc. Make sure to capture your audiences attention in your business displays with our gratis customizable Facebook Marketing Techniques Facebook Ads Dashboard With Campaign Strategy SS V. These are great for business strategies, office conferences, capital raising or task suggestions. If you desire to acquire more customers for your tech business and ensure they stay satisfied, create your own sales presentation with these plain slides. The following slide outlines comprehensive dashboard through which advertisers can monitor Facebook ads performance. The KPIs outlined in slide are ad spend, conversions, cost per conversion, cost per action, brand impressions, clicks, etc.
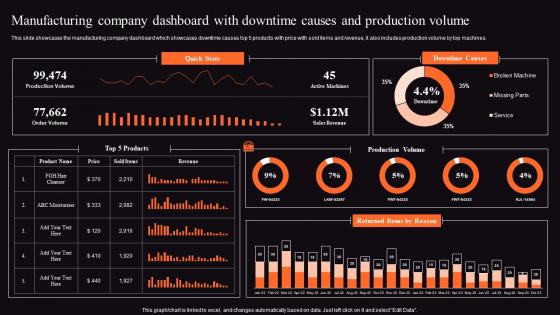
Food Processing Business Profile Manufacturing Company Dashboard Brochure Pdf
This slide showcases the manufacturing company dashboard which showcases downtime causes top 5 products with price with sold items and revenue, it also includes production volume by top machines. Do you know about Slidesgeeks Food Processing Business Profile Manufacturing Company Dashboard Brochure Pdf These are perfect for delivering any kind od presentation. Using it, create PowerPoint presentations that communicate your ideas and engage audiences. Save time and effort by using our pre designed presentation templates that are perfect for a wide range of topic. Our vast selection of designs covers a range of styles, from creative to business, and are all highly customizable and easy to edit. Download as a PowerPoint template or use them as Google Slides themes. This slide showcases the manufacturing company dashboard which showcases downtime causes top 5 products with price with sold items and revenue, it also includes production volume by top machines.


 Continue with Email

 Home
Home


