Financial Strategy
Liquidity Ratios Ppt PowerPoint Presentation Icon Graphic Images
This is a liquidity ratios ppt powerpoint presentation icon graphic images. This is a two stage process. The stages in this process are current ratio, quick ratio, current liabilities, current assetsc.
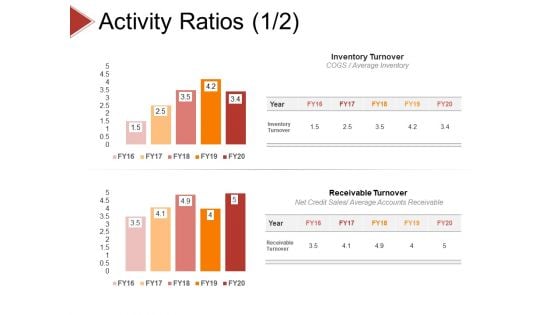
Activity Ratios Template 1 Ppt PowerPoint Presentation Styles Layouts
This is a activity ratios template 1 ppt powerpoint presentation styles layouts. This is a two stage process. The stages in this process areinventory turnover, receivable turnover, inventory turnover, receivable turnover.
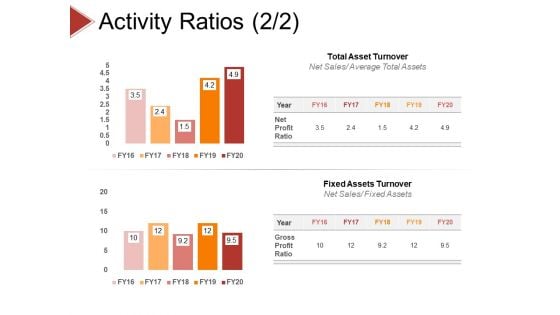
Activity Ratios Template 2 Ppt PowerPoint Presentation Inspiration Designs
This is a activity ratios template 2 ppt powerpoint presentation inspiration designs. This is a two stage process. The stages in this process are total asset turnover net sales average total assets, fixed assets turnover net sales fixed assets.
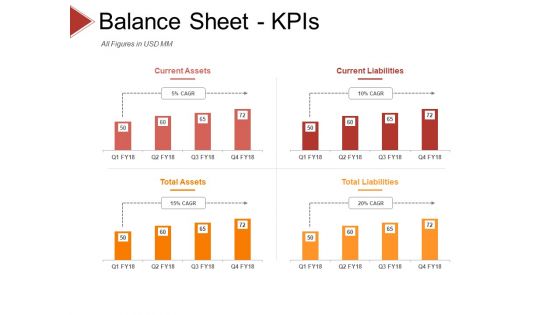
Balance Sheet Kpis Template 3 Ppt PowerPoint Presentation Professional Graphics Design
This is a balance sheet kpis template 3 ppt powerpoint presentation professional graphics design. This is a four stage process. The stages in this process are current assets, current liabilities, total assets, total liabilities.
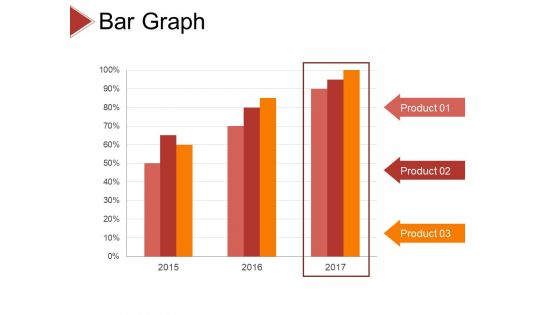
Bar Graph Ppt PowerPoint Presentation Layouts Gridlines
This is a bar graph ppt powerpoint presentation layouts gridlines. this is a three stage process. The stages in this process are product, percentage, business, marketing, management.
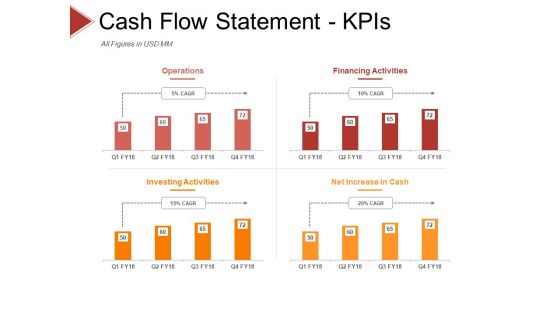
Cash Flow Statement Kpis Template 1 Ppt PowerPoint Presentation Pictures Microsoft
This is a cash flow statement kpis template 1 ppt powerpoint presentation pictures microsoft. This is a four stage process. The stages in this process are operations, financing activities, investing activities, net increase in cash.
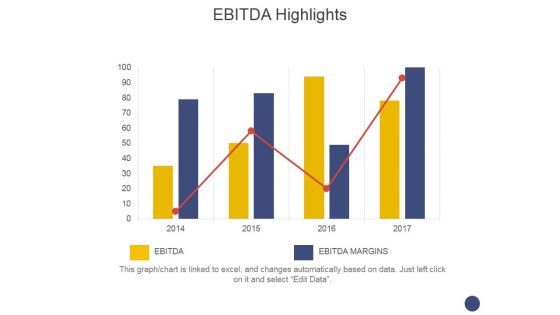
Ebitda Highlights Template 1 Ppt PowerPoint Presentation Gallery Graphics Tutorials
This is a ebitda highlights template 1 ppt powerpoint presentation gallery graphics tutorials. This is a two stage process. The stages in this process are business, growth, finance, graph, management.
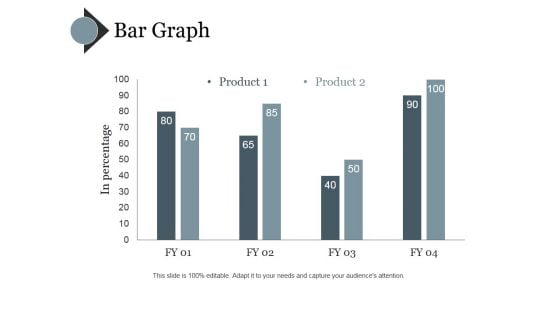
Bar Graph Ppt PowerPoint Presentation Styles Influencers
This is a bar graph ppt powerpoint presentation styles influencers. This is a four stage process. The stages in this process are bar, graph, business, marketing, finance.
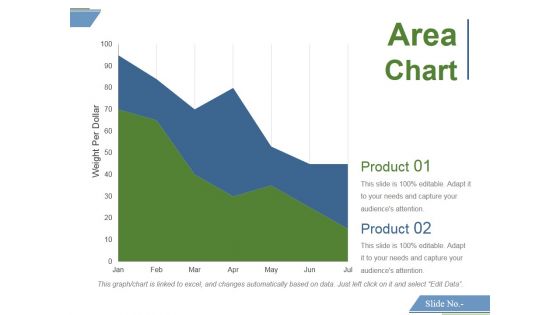
Area Chart Ppt PowerPoint Presentation Styles Designs
This is a area chart ppt powerpoint presentation styles designs. This is a two stage process. The stages in this process are area chart, product.
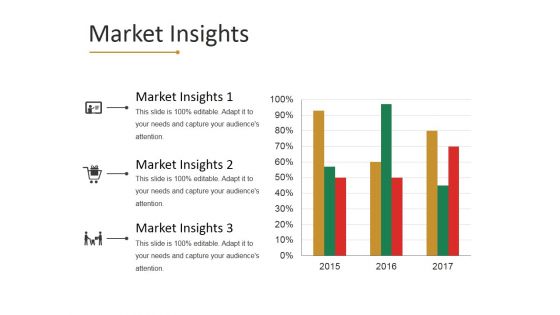
Market Insights Template 1 Ppt PowerPoint Presentation Show Brochure
This is a market insights template 1 ppt powerpoint presentation show brochure. This is a three stage process. The stages in this process are business, finance, marketing, analysis, growth.
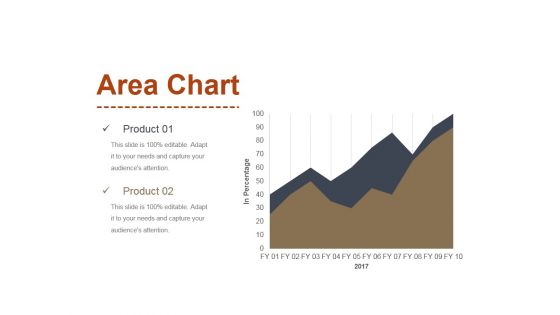
Area Chart Ppt PowerPoint Presentation Inspiration Slides
This is a area chart ppt powerpoint presentation inspiration slides. This is a two stage process. The stages in this process are area chart, product, in percentage.

Combo Chart Ppt PowerPoint Presentation Professional Infographics
This is a combo chart ppt powerpoint presentation professional infographics. This is a three stage process. The stages in this process are combo chart, market size, product.
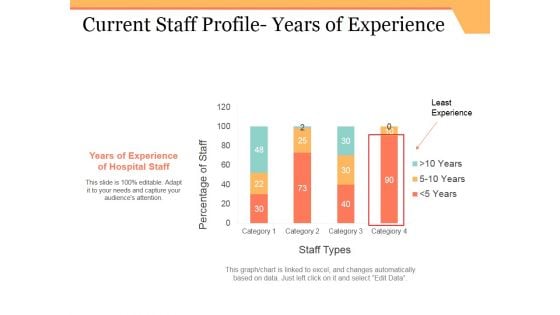
Current Staff Profile Years Of Experience Ppt PowerPoint Presentation Infographics Example
This is a current staff profile years of experience ppt powerpoint presentation infographics example. This is a four stage process. The stages in this process are years of experience of hospital staff, least experience, staff types.
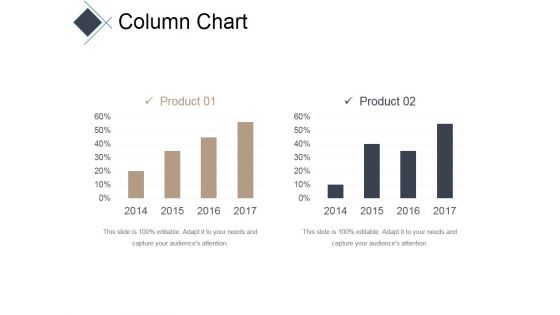
Column Chart Ppt PowerPoint Presentation Infographic Template Inspiration
This is a column chart ppt powerpoint presentation infographic template inspiration. This is a two stage process. The stages in this process are bar, years, business, marketing, success.
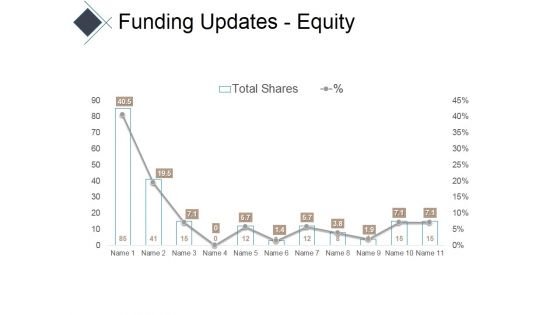
Funding Updates Equity Ppt PowerPoint Presentation Infographic Template Portfolio
This is a funding updates equity ppt powerpoint presentation infographic template portfolio. This is a eleven stage process. The stages in this process are charts, area, marketing, business, success.
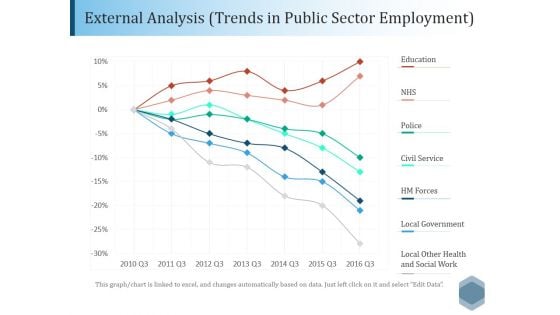
External Analysis Trends In Public Sector Employment Ppt PowerPoint Presentation File Outline
This is a external analysis trends in public sector employment ppt powerpoint presentation file outline. This is a seven stage process. The stages in this process are education, nhs, police, civil service, local government.
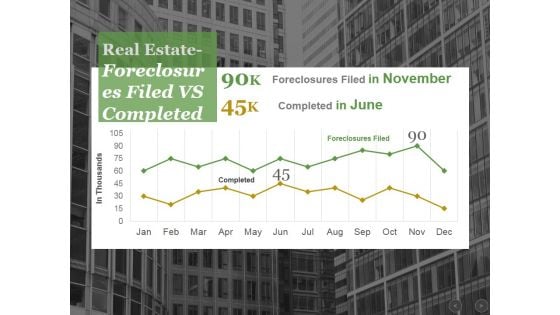
Real Estate Foreclosures Filed Vs Completed Ppt PowerPoint Presentation Gallery Background Image
This is a real estate foreclosures filed vs completed ppt powerpoint presentation gallery background image. This is a two stage process. The stages in this process are completed, foreclosures filed.
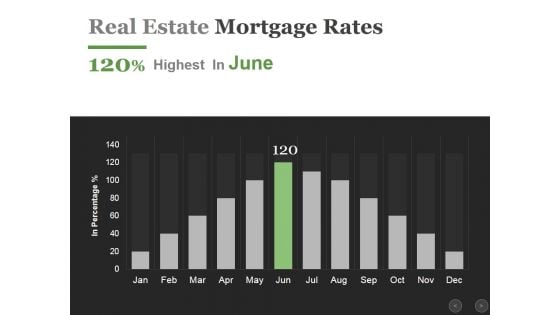
Real Estate Mortgage Rates Ppt PowerPoint Presentation Infographics Influencers
This is a real estate mortgage rates ppt powerpoint presentation infographics influencers. This is a twelve stage process. The stages in this process are business, finance, marketing, analysis, growth.
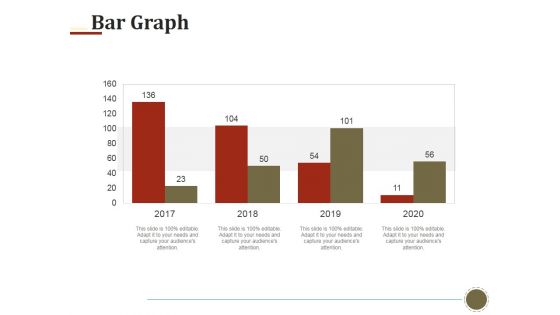
Bar Graph Ppt PowerPoint Presentation Styles Model
This is a bar graph ppt powerpoint presentation styles model. This is a four stage process. The stages in this process are bar graph, finance, marketing, analysis, investment, business.
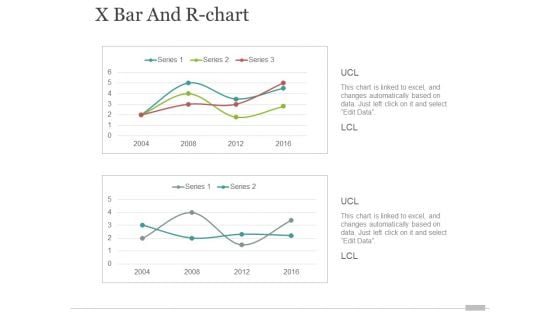
x bar and r chart ppt powerpoint presentation portfolio elements
This is a x bar and r chart ppt powerpoint presentation portfolio elements. This is a two stage process. The stages in this process are finance, business, marketing, growth.
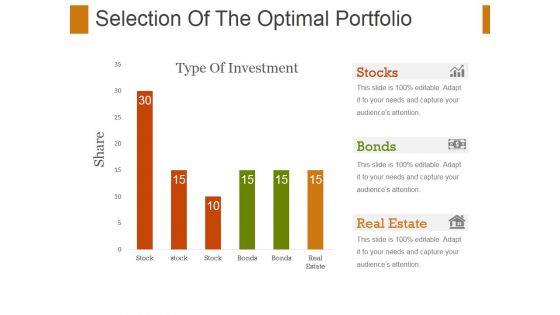
Selection Of The Optimal Portfolio Template 2 Ppt PowerPoint Presentation Ideas Samples
This is a selection of the optimal portfolio template 2 ppt powerpoint presentation ideas samples. This is a three stage process. The stages in this process are stocks, bonds, real estate.
Internet Marketing Objectives Ppt PowerPoint Presentation Icon Images
This is a internet marketing objectives ppt powerpoint presentation icon images. This is a six stage process. The stages in this process are sales, profit, product, repeat, sales, web.
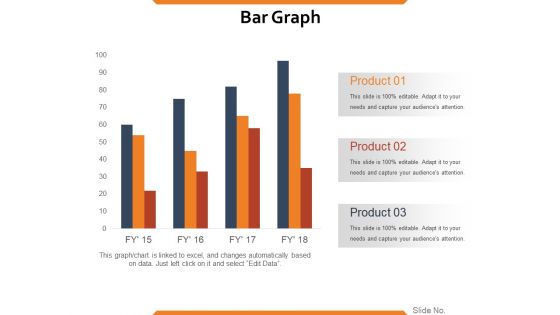
Bar Graph Ppt PowerPoint Presentation Show Guidelines
This is a bar graph ppt powerpoint presentation show guidelines. This is a four stage process. The stages in this process are product, growth, business, finance, bar graph.
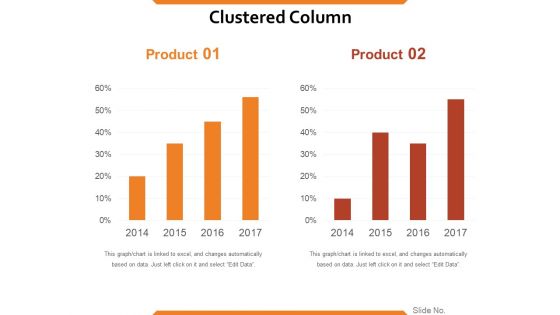
Clustered Column Ppt PowerPoint Presentation Outline Slide Portrait
This is a clustered column ppt powerpoint presentation outline slide portrait. This is a two stage process. The stages in this process are product, finance, business, marketing, percentage.
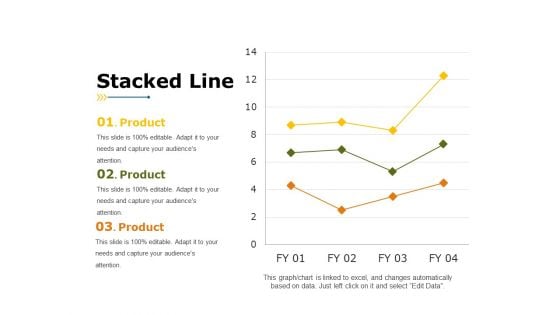
Stacked Line Ppt PowerPoint Presentation Background Image
This is a stacked line ppt powerpoint presentation background image. This is a three stage process. The stages in this process are product, stacked line, business, marketing, finance.
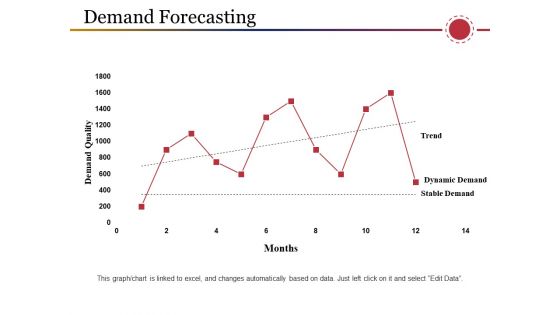
Demand Forecasting Ppt PowerPoint Presentation Outline Model
This is a demand forecasting ppt powerpoint presentation outline model. This is a one stage process. The stages in this process are demand quality, dynamic demand, stable demand, trend, finance.
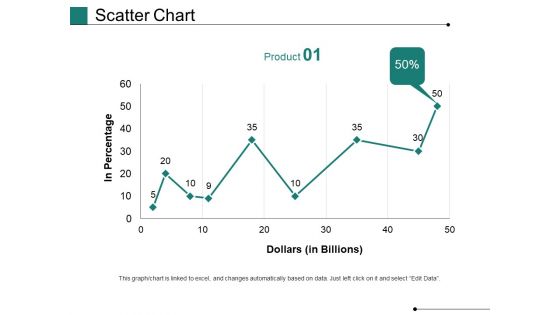
Scatter Chart Ppt PowerPoint Presentation Gallery Show
This is a scatter chart ppt powerpoint presentation gallery show. This is a one stage process. The stages in this process are in percentage, dollars, business, marketing, growth, graph.
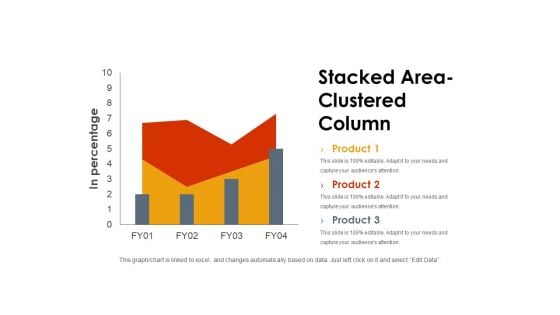
Stacked Area Clustered Column Ppt PowerPoint Presentation Styles Background Image
This is a stacked area clustered column ppt powerpoint presentation styles background image. This is a three stage process. The stages in this process are in percentage, graph, business, marketing, finance.
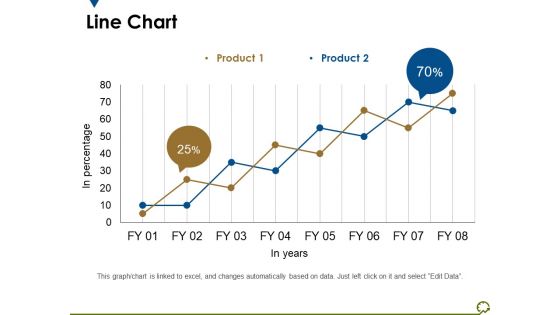
Line Chart Ppt PowerPoint Presentation Outline Diagrams
This is a line chart ppt powerpoint presentation outline diagrams. This is a two stage process. The stages in this process are in percentage, in years, percentage, business, marketing.
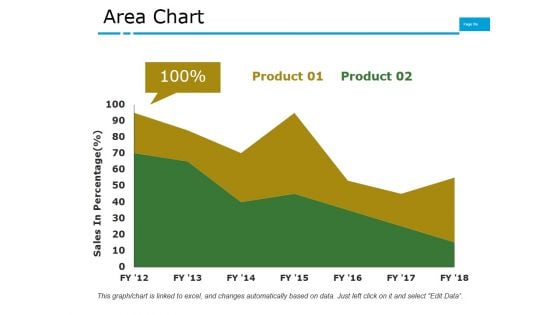
Area Chart Ppt PowerPoint Presentation Model Format
This is a area chart ppt powerpoint presentation model format. This is a two stage process. The stages in this process are business, marketing, finance, graph, growth.
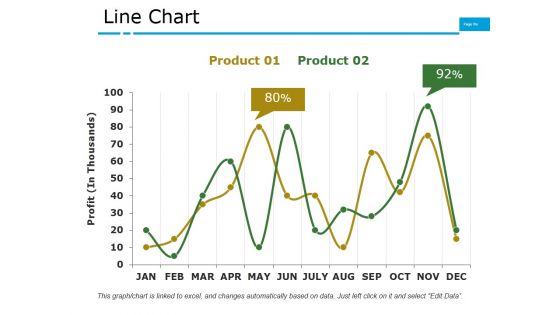
Line Chart Ppt PowerPoint Presentation File Graphics Pictures
This is a line chart ppt powerpoint presentation file graphics pictures. This is a two stage process. The stages in this process are business, marketing, finance, graph, growth.
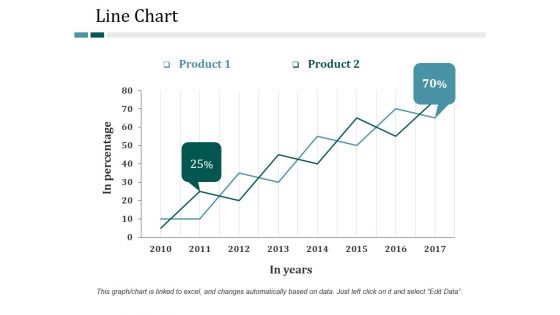
Line Chart Ppt PowerPoint Presentation Summary Graphic Tips
This is a line chart ppt powerpoint presentation summary graphic tips. This is a two stage process. The stages in this process are line chart, product, in percentage, analysis, business.
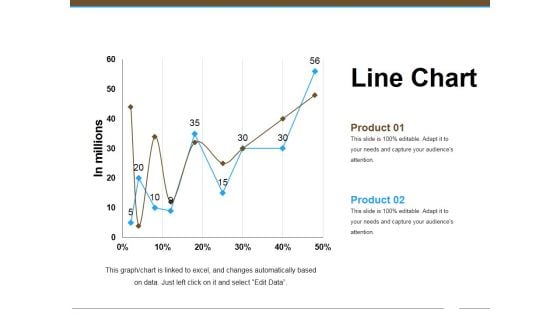
Line Chart Ppt Powerpoint Presentation Model Maker
This is a line chart ppt powerpoint presentation model maker. This is a two stage process. The stages in this process are line chart, growth, analysis, finance, business.
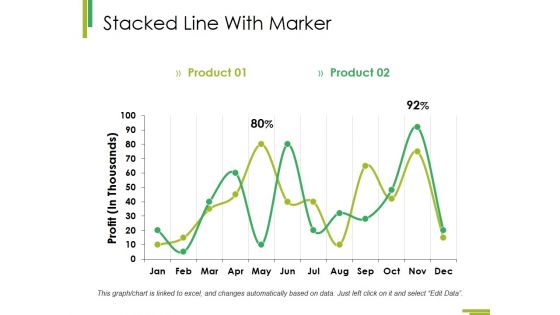
Stacked Line With Marker Ppt PowerPoint Presentation Summary Clipart Images
This is a stacked line with marker ppt powerpoint presentation summary clipart images. This is a two stage process. The stages in this process are growth, business, finance, analysis, marketing.
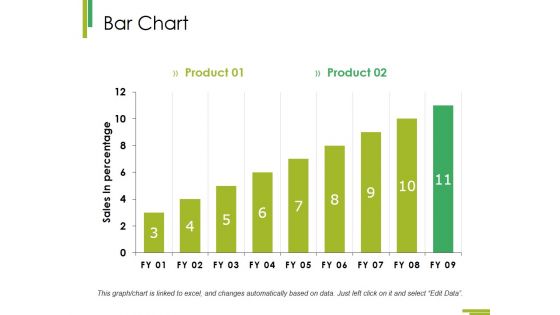
Bar Chart Ppt PowerPoint Presentation Infographic Template Master Slide
This is a bar chart ppt powerpoint presentation infographic template master slide. This is a two stage process. The stages in this process are growth, finance, business, analysis, marketing.
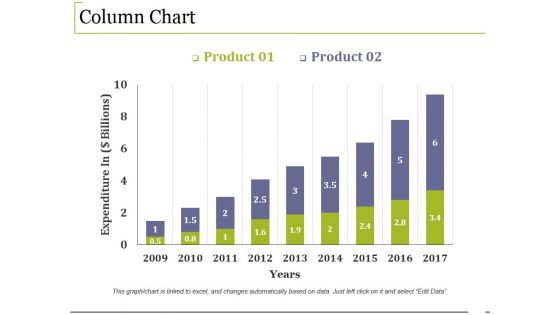
Column Chart Ppt PowerPoint Presentation Infographic Template Example File
This is a column chart ppt powerpoint presentation infographic template example file. This is a two stage process. The stages in this process are growth, finance, business, marketing, analysis.
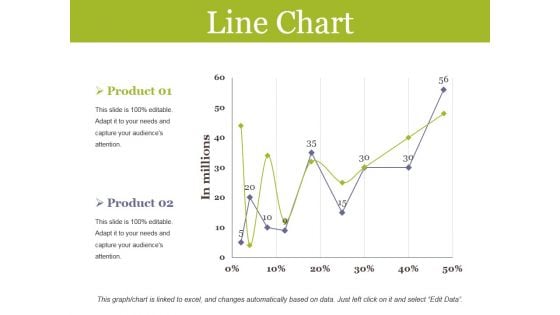
Line Chart Ppt PowerPoint Presentation Pictures Inspiration
This is a line chart ppt powerpoint presentation pictures inspiration. This is a two stage process. The stages in this process are line chart, finance, growth, analysis, business.
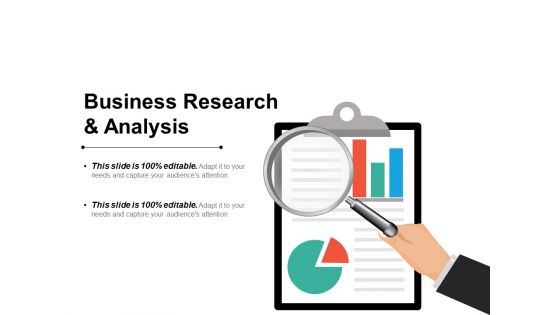
Business Research And Analysis Ppt PowerPoint Presentation Ideas Graphics Design
This is a business research and analysis ppt powerpoint presentation ideas graphics design. This is a three stage process. The stages in this process are support, assistance, hand holding.
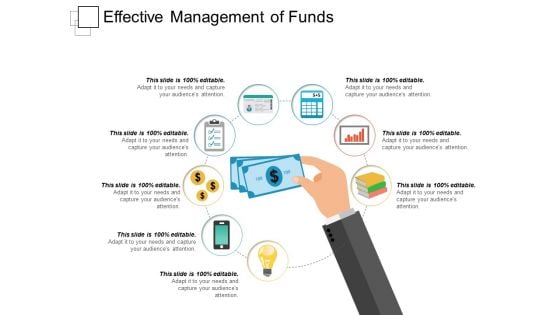
Effective Management Of Funds Ppt PowerPoint Presentation Infographic Template Model
This is a effective management of funds ppt powerpoint presentation infographic template model. This is a eight stage process. The stages in this process are support, assistance, hand holding.
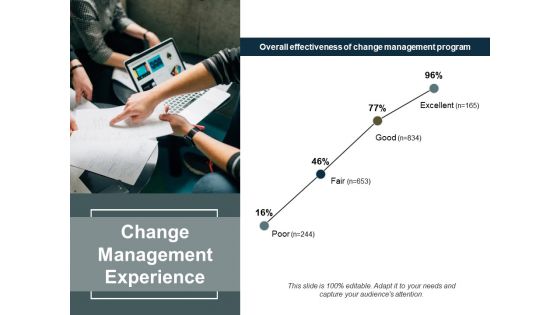
Change Management Experience Ppt PowerPoint Presentation Infographic Template Portfolio
This is a change management experience ppt powerpoint presentation infographic template portfolio. This is a one stage process. The stages in this process are finance, marketing, analysis, business, investment.
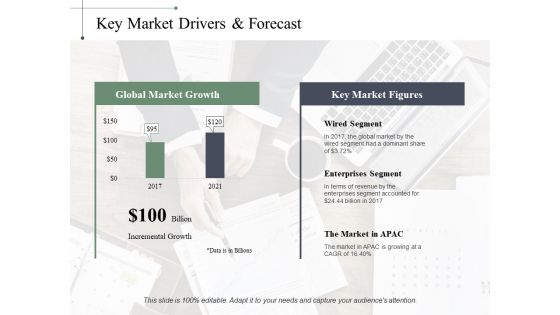
Key Market Drivers Forecast Ppt PowerPoint Presentation Inspiration Graphic Tips
This is a key market drivers forecast ppt powerpoint presentation inspiration graphic tips. This is a two stage process. The stages in this process are wired segment, enterprises segment, incremental growth, business, management.
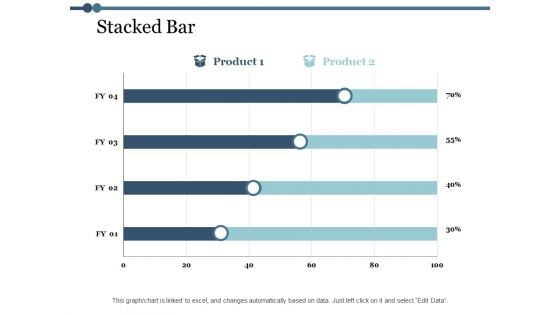
Stacked Bar Finance Ppt PowerPoint Presentation Microsoft
This is a stacked bar finance ppt powerpoint presentation microsoft. This is a two stage process. The stages in this process are finance, marketing, management, investment, analysis.
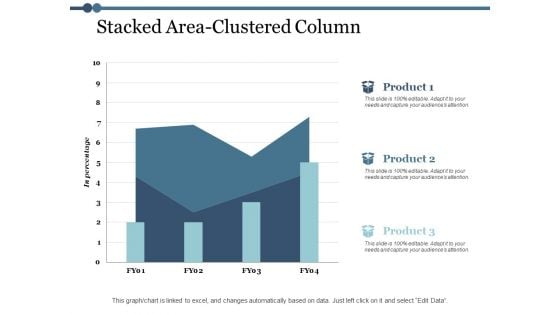
Stacked Area Clustered Column Ppt PowerPoint Presentation Model Topics
This is a stacked area clustered column ppt powerpoint presentation model topics. This is a three stage process. The stages in this process are area chart, finance, marketing, management, investment.
Bar Graph Icon Showing Operating Rhythm Ppt Powerpoint Presentation Ideas Templates
This is a bar graph icon showing operating rhythm ppt powerpoint presentation ideas templates. This is a three stage process. The stages in this process are six sigma, operating rhythm, business rhythm.

Business Data Analysis Inventory And Accounts Payable Days Ppt PowerPoint Presentation Layouts Professional
This is a business data analysis inventory and accounts payable days ppt powerpoint presentation layouts professional. This is a three stage process. The stages in this process are business analytics, ba, organizations data.

Product Sales Report Dashboard For Profit Margin Analysis Ppt PowerPoint Presentation Ideas Slide Portrait
This is a product sales report dashboard for profit margin analysis ppt powerpoint presentation ideas slide portrait. This is a four stage process. The stages in this process are business analytics, ba, organizations data.
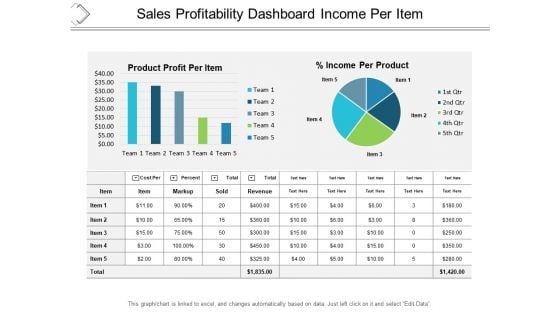
Sales Profitability Dashboard Income Per Item Ppt PowerPoint Presentation Professional Graphic Images
This is a sales profitability dashboard income per item ppt powerpoint presentation professional graphic images. This is a five stage process. The stages in this process are business analytics, ba, organizations data.
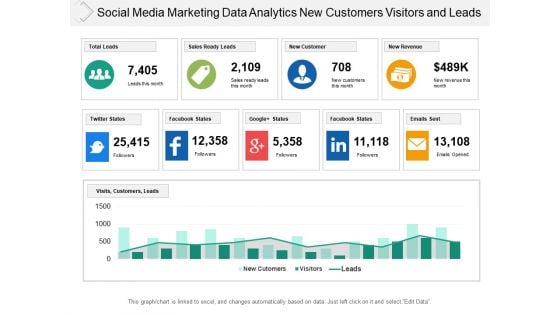
Social Media Marketing Data Analytics New Customers Visitors And Leads Ppt PowerPoint Presentation Professional Pictures
This is a social media marketing data analytics new customers visitors and leads ppt powerpoint presentation professional pictures. This is a two stage process. The stages in this process are business analytics, ba, organizations data.
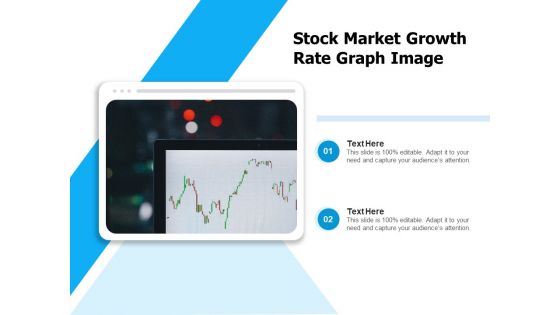
Stock Market Growth Rate Graph Image Ppt PowerPoint Presentation Professional Influencers PDF
Persuade your audience using this stock market growth rate graph image ppt powerpoint presentation professional influencers pdf. This PPT design covers two stages, thus making it a great tool to use. It also caters to a variety of topics including stock market growth rate graph image. Download this PPT design now to present a convincing pitch that not only emphasizes the topic but also showcases your presentation skills.
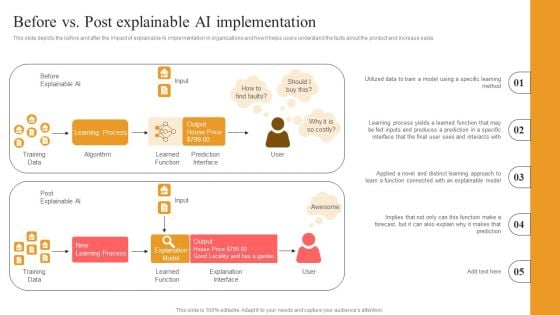
Explainable Machine Learning Before Vs Post Explainable Ai Implementation Structure PDF
This slide depicts the before and after the impact of explainable AI implementation in organizations and how it helps users understand the facts about the product and increase sales. Find a pre-designed and impeccable Explainable Machine Learning Before Vs Post Explainable Ai Implementation Structure PDF. The templates can ace your presentation without additional effort. You can download these easy-to-edit presentation templates to make your presentation stand out from others. So, what are you waiting for Download the template from Slidegeeks today and give a unique touch to your presentation.
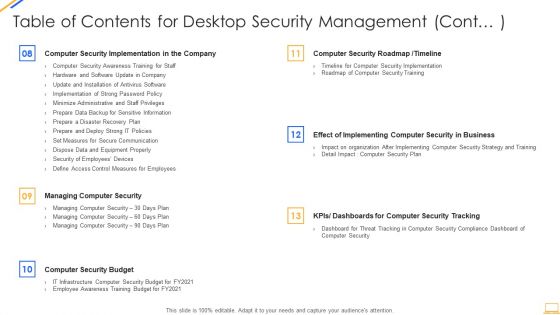
Table Of Contents For Desktop Security Management Cont Plan Designs PDF
Deliver and pitch your topic in the best possible manner with this table of contents for desktop security management cont plan designs pdf. Use them to share invaluable insights on requirement, security, organization, financial, planning and impress your audience. This template can be altered and modified as per your expectations. So, grab it now.
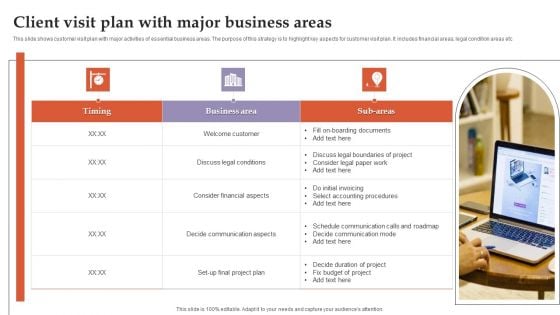
Client Visit Plan With Major Business Areas Diagrams PDF
This slide shows customer visit plan with major activities of essential business areas. The purpose of this strategy is to highlight key aspects for customer visit plan. It includes financial areas, legal condition areas etc Persuade your audience using this Client Visit Plan With Major Business Areas Diagrams PDF. This PPT design covers three stages, thus making it a great tool to use. It also caters to a variety of topics including Business Area, Timing, Sub Areas. Download this PPT design now to present a convincing pitch that not only emphasizes the topic but also showcases your presentation skills.

Business Promotion Methods Process For Business Automation Ppt Model Ideas PDF
This slide showcase marketing strategy process to ensure marketing activities remain aligns with business goal and maximizing business return . It includes understanding consumers, analyze market, analyze competition, research disruption, define marketing mix, financial analysis and review. Persuade your audience using this Business Promotion Methods Process For Business Automation Ppt Model Ideas PDF. This PPT design covers seven stages, thus making it a great tool to use. It also caters to a variety of topics including Review And Revise, Understand Customer, Analyze Market, Analyze Competition. Download this PPT design now to present a convincing pitch that not only emphasizes the topic but also showcases your presentation skills.
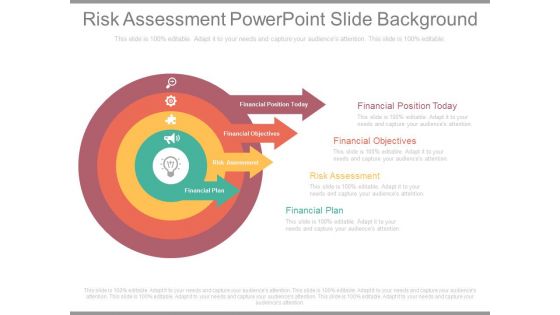
Risk Assessment Powerpoint Slide Background
This is a risk assessment powerpoint slide background. This is a four stage process. The stages in this process are financial position today, financial objectives, risk assessment, financial plan.

Production Plan Powerpoint Presentation Examples
This is a production plan powerpoint presentation examples. This is a four stage process. The stages in this process are business analysis, financial projection, production plan, financial information.
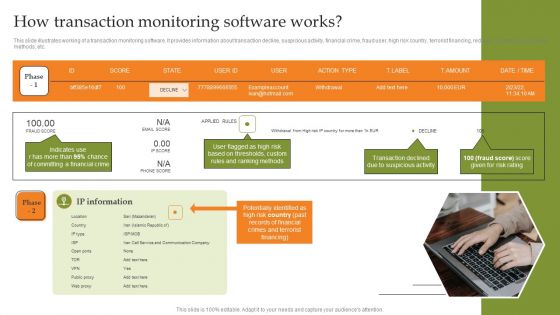
Creating Transaction Monitoring How Transaction Monitoring Software Works Demonstration PDF
This slide illustrates working of a transaction monitoring software. It provides information about transaction decline, suspicious activity, financial crime, fraud user, high risk country, terrorist financing, red flags, custom rules, ranking methods, etc. Make sure to capture your audiences attention in your business displays with our gratis customizable Creating Transaction Monitoring How Transaction Monitoring Software Works Demonstration PDF. These are great for business strategies, office conferences, capital raising or task suggestions. If you desire to acquire more customers for your tech business and ensure they stay satisfied, create your own sales presentation with these plain slides.

Conducting Monetary Inclusion Stakeholders Expectation From Our MFS Ecosystem Clipart PDF
This slide shows various stakeholders expectations from the mobile financial service ecosystem. Stakeholders covered in the table are consumer, employees, mobile network operators, micro finance institutions, agents and regulator. This is a Conducting Monetary Inclusion Stakeholders Expectation From Our MFS Ecosystem Clipart PDF template with various stages. Focus and dispense information on six stages using this creative set, that comes with editable features. It contains large content boxes to add your information on topics like Transaction Security, Commission Transactions, Reduce Money. You can also showcase facts, figures, and other relevant content using this PPT layout. Grab it now.
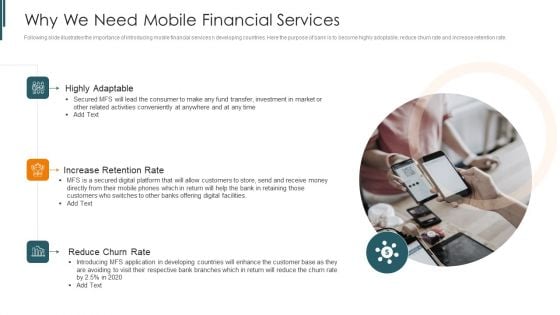
Introduction To Mobile Money In Developing Countries Why We Need Mobile Clipart PDF
Following slide illustrates the importance of introducing mobile financial services n developing countries. Here the purpose of bank is to become highly adoptable, reduce churn rate and increase retention rate.This is a introduction to mobile money in developing countries why we need mobile clipart pdf template with various stages. Focus and dispense information on three stages using this creative set, that comes with editable features. It contains large content boxes to add your information on topics like highly adaptable, increase retention rate, reduce churn rate You can also showcase facts, figures, and other relevant content using this PPT layout. Grab it now.
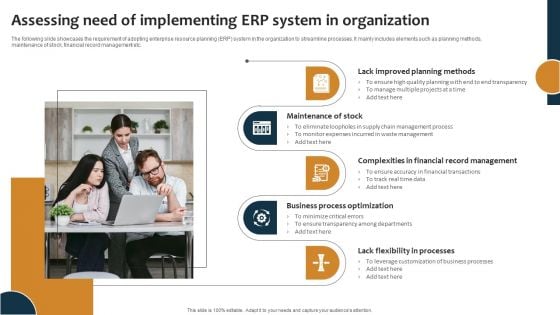
Improving Business Procedures Enterprise Resource Planning System Assessing Need Of Implementing Brochure PDF
The following slide showcases the requirement of adopting enterprise resource planning ERP system in the organization to streamline processes. It mainly includes elements such as planning methods, maintenance of stock, financial record management etc. Want to ace your presentation in front of a live audience Our Improving Business Procedures Enterprise Resource Planning System Assessing Need Of Implementing Brochure PDF can help you do that by engaging all the users towards you. Slidegeeks experts have put their efforts and expertise into creating these impeccable powerpoint presentations so that you can communicate your ideas clearly. Moreover, all the templates are customizable, and easy to edit and downloadable. Use these for both personal and commercial use.
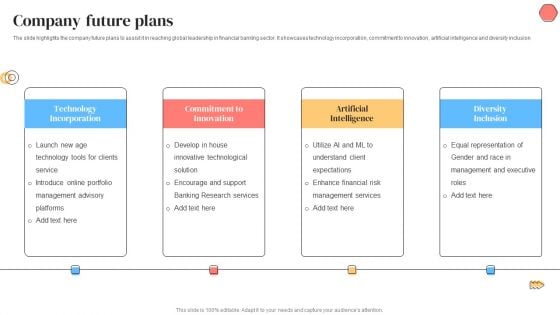
Banking Solutions Company Overview Company Future Plans Download PDF
The slide highlights the company future plans to assist it in reaching global leadership in financial banking sector. It showcases technology incorporation, commitment to innovation, artificial intelligence and diversity inclusion. This is a Banking Solutions Company Overview Company Future Plans Download PDF template with various stages. Focus and dispense information on four stages using this creative set, that comes with editable features. It contains large content boxes to add your information on topics like Commitment To Innovation, Artificial Intelligence, Diversity Inclusion. You can also showcase facts, figures, and other relevant content using this PPT layout. Grab it now.


 Continue with Email

 Home
Home


