Financial Summary
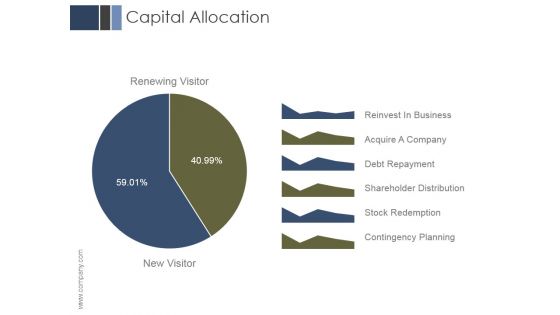
Capital Allocation Ppt PowerPoint Presentation Portfolio
This is a capital allocation ppt powerpoint presentation portfolio. This is a two stage process. The stages in this process are reinvest in business, acquire a company, debt repayment, shareholder distribution, stock redemption, contingency planning.
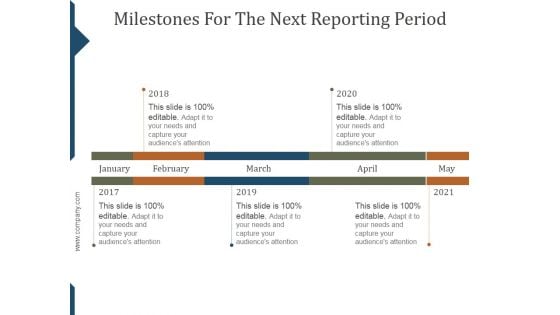
Milestones For The Next Reporting Period Template Ppt PowerPoint Presentation Background Images
This is a milestones for the next reporting period template ppt powerpoint presentation background images. This is a six stage process. The stages in this process are jan, feb, mar, apr, may, jun.
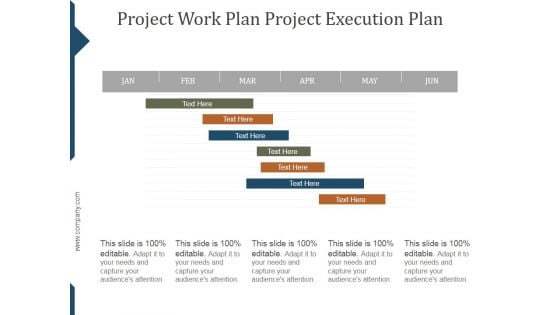
Project Work Plan Project Execution Plan Template Ppt PowerPoint Presentation Styles
This is a project work plan project execution plan template ppt powerpoint presentation styles. This is a seven stage process. The stages in this process are project, management, business, marketing, success.
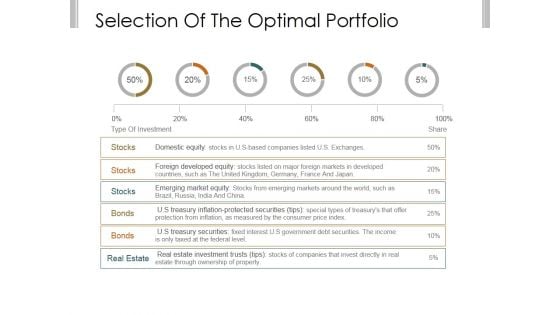
Selection Of The Optimal Portfolio Template 1 Ppt PowerPoint Presentation Diagrams
This is a selection of the optimal portfolio template 1 ppt powerpoint presentation diagrams. This is a six stage process. The stages in this process are domestic equity, foreign developed equity, emerging market equity, treasury securities, real estate investment trusts.
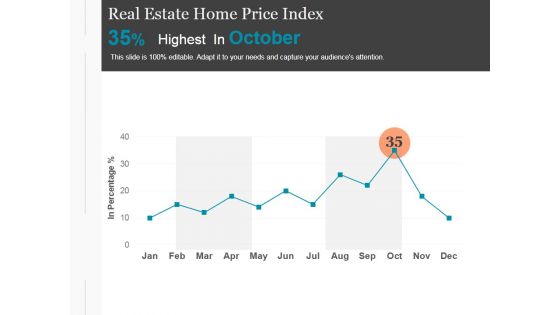
Real Estate Home Price Index Template 2 Ppt PowerPoint Presentation Pictures
This is a real estate home price index template 2 ppt powerpoint presentation pictures. This is a one stage process. The stages in this process are finance, planning, management, marketing, strategy.
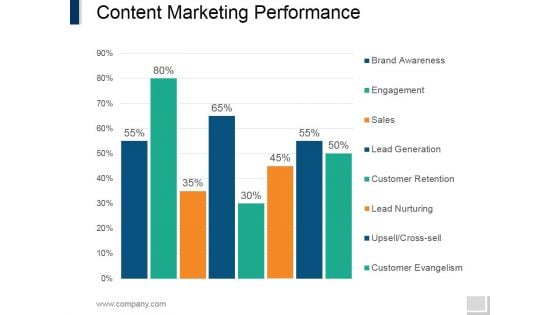
Content Marketing Performance Template 1 Ppt PowerPoint Presentation Infographics Graphics Example
This is a content marketing performance template 1 ppt powerpoint presentation infographics graphics example. This is a eight stage process. The stages in this process are brand awareness, engagement, sales, lead generation, customer retention lead nurturing, upsell.
Marketing Reach By Channels Template 2 Ppt PowerPoint Presentation Icon Images
This is a marketing reach by channels template 2 ppt powerpoint presentation icon images. This is a seven stage process. The stages in this process are content promotion, product launch, content creation, event management, corporate communications, crisis management, seo.
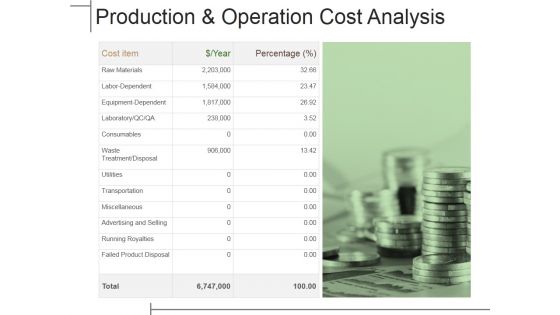
Production And Operation Cost Analysis Ppt PowerPoint Presentation Infographic Template Display
This is a production and operation cost analysis ppt powerpoint presentation infographic template display. This is a one stage process. The stages in this process are raw materials, labor dependent, equipment dependent, consumables, utilities.
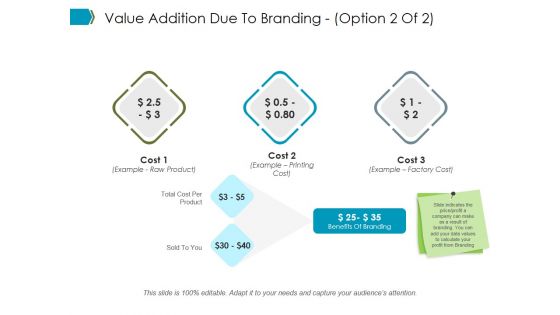
Value Addition Due To Branding Template 1 Ppt PowerPoint Presentation Pictures Inspiration
This is a value addition due to branding template 1 ppt powerpoint presentation pictures inspiration. This is a three stage process. The stages in this process are business, marketing, strategy, finance, planning.
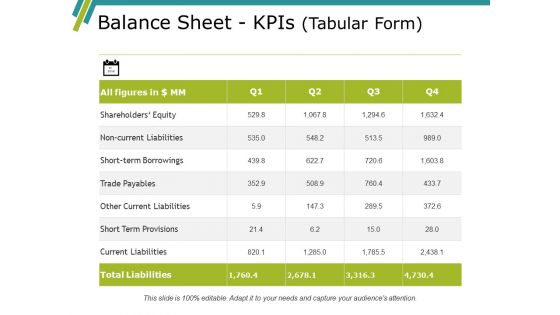
Balance Sheet Kpis Template 1 Ppt PowerPoint Presentation Professional Graphics Download
This is a balance sheet kpis template 1 ppt powerpoint presentation professional graphics download. This is a four stage process. The stages in this process are current assets, current liabilities, total assets, total liabilities.

Budgeting Planned Actual Comparison Ppt PowerPoint Presentation Graphics
This is a budgeting planned actual comparison ppt powerpoint presentation graphics. This is a two stage process. The stages in this process are value difference, actual cost, planned cost, type of cost.
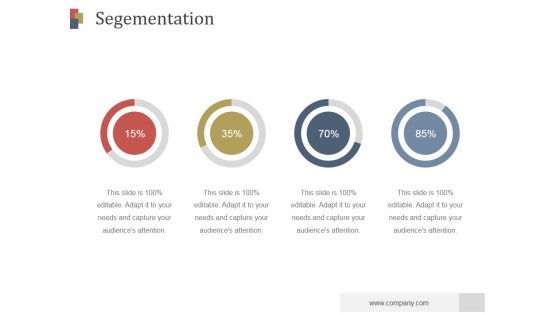
Segementation Ppt PowerPoint Presentation Visuals
This is a segementation ppt powerpoint presentation visuals. This is a four stage process. The stages in this process are marketing, business, finance, percentage, success.
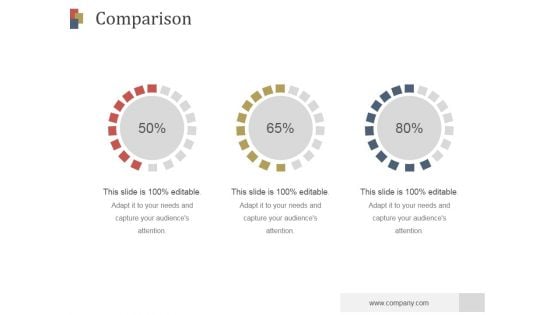
Comparison Ppt PowerPoint Presentation Guidelines
This is a comparison ppt powerpoint presentation guidelines. This is a three stage process. The stages in this process are finance, business, marketing, percentage, compare.
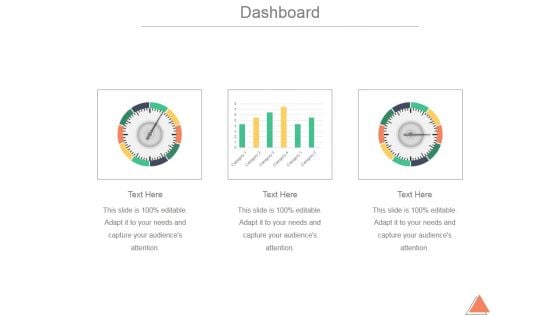
Dashboard Ppt PowerPoint Presentation Infographics
This is a dashboard ppt powerpoint presentation infographics. This is a three stage process. The stages in this process are business, marketing, dashboard, analysis, finance.
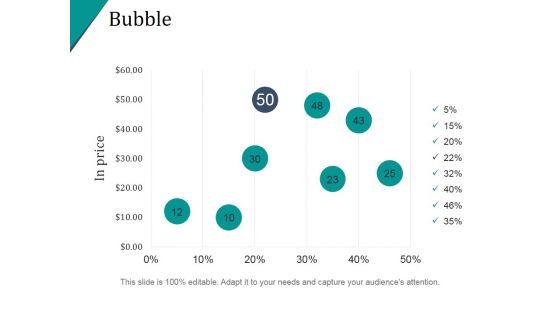
Bubble Ppt PowerPoint Presentation Show
This is a bubble ppt powerpoint presentation show. This is a six stage process. The stages in this process are finance, percentage, success, price, business.

Bubble Ppt PowerPoint Presentation Slides
This is a bubble ppt powerpoint presentation slides. This is a eight stage process. The stages in this process are business, marketing, finance, planning, strategy.
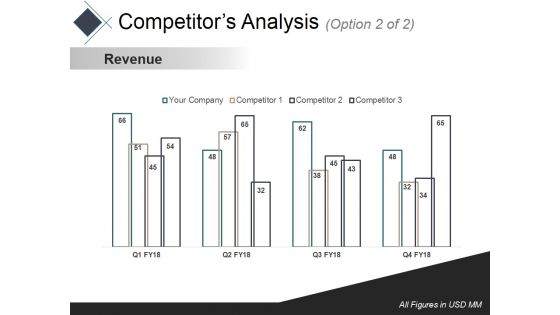
Competitors Analysis 2 Ppt PowerPoint Presentation Slides Gallery
This is a competitors analysis 2 ppt powerpoint presentation slides gallery. This is a four stage process. The stages in this process are revenue, business, marketing, bar, success.
Revenue Cost Per Employee Comparison Ppt PowerPoint Presentation Icon Graphics Tutorials
This is a revenue cost per employee comparison ppt powerpoint presentation icon graphics tutorials. This is a two stage process. The stages in this process are revenue and cost per employee comparison, line chart, business, marketing, success,
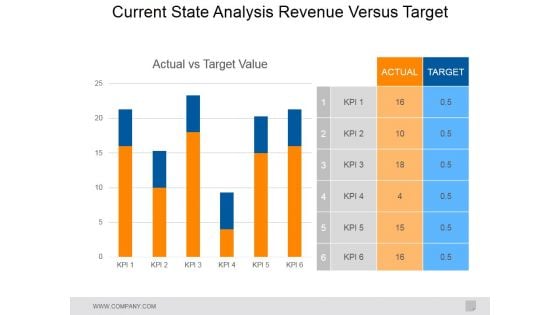
Current State Analysis Revenue Versus Target Ppt PowerPoint Presentation Model Smartart
This is a current state analysis revenue versus target ppt powerpoint presentation model smartart. This is a two stage process. The stages in this process are actual, target, actual vs target value.
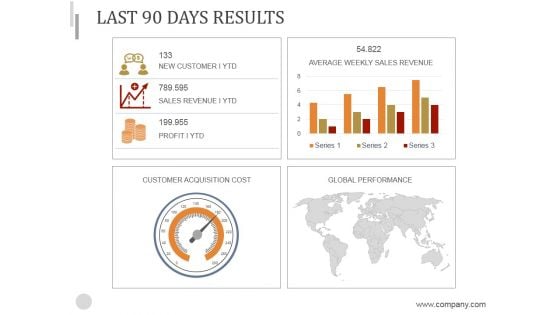
Last 90 Days Results Ppt PowerPoint Presentation Background Image
This is a last 90 days results ppt powerpoint presentation background image. This is a four stage process. The stages in this process are customer acquisition cost, global performance, average weekly sales revenue.
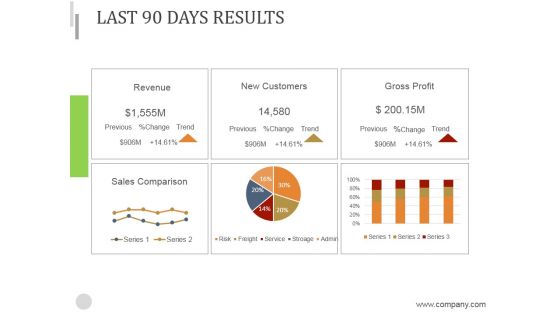
Last 90 Days Results Ppt PowerPoint Presentation Introduction
This is a last 90 days results ppt powerpoint presentation introduction. This is a six stage process. The stages in this process are revenue, new customers, gross profit, sales comparison.
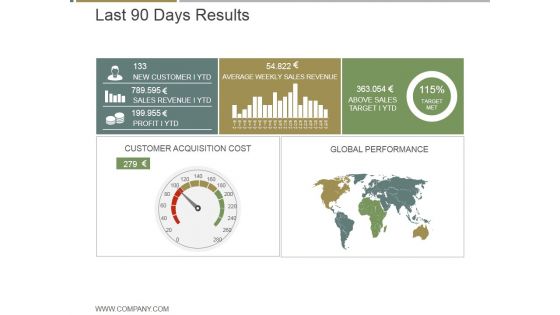
Last 90 Days Results Ppt PowerPoint Presentation Graphics
This is a last 90 days results ppt powerpoint presentation graphics. This is a five stage process. The stages in this process are new customer ytd, average weekly sales revenue, above sales target i ytd, customer acquisition cost, global performance.
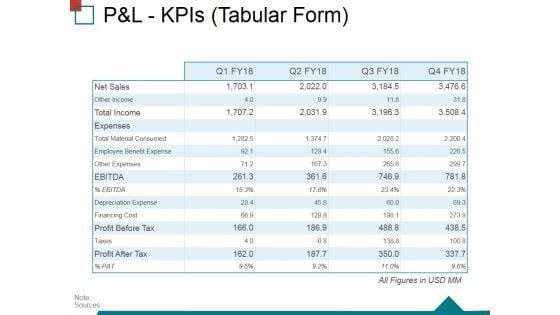
Pandl Kpis Tabular Form Ppt PowerPoint Presentation Ideas Structure
This is a pandl kpis tabular form ppt powerpoint presentation ideas structure. This is a four stage process. The stages in this process are operating profit, revenue, cogs, net profit.
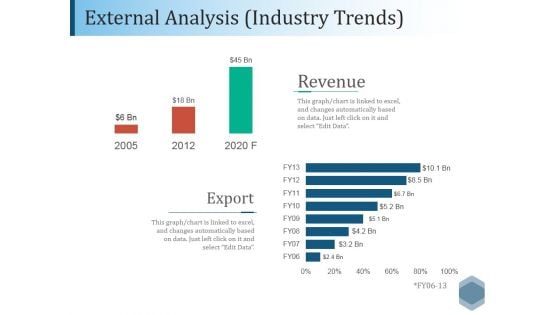
External Analysis Industry Trends Ppt PowerPoint Presentation File Outfit
This is a external analysis industry trends ppt powerpoint presentation file outfit. This is a two stage process. The stages in this process are revenue, export, bar, finance, analysis.
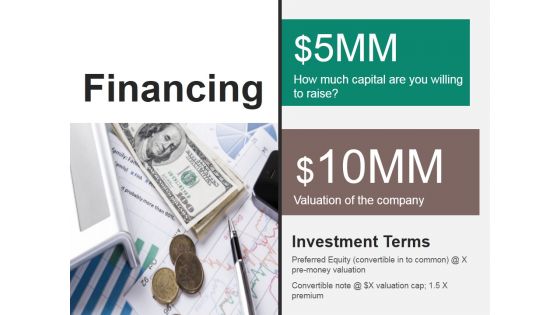
Financing Ppt PowerPoint Presentation Gallery Graphic Images
This is a financing ppt powerpoint presentation gallery graphic images. This is a two stage process. The stages in this process are how much capital are you willing to raise, valuation of the company, investment terms.
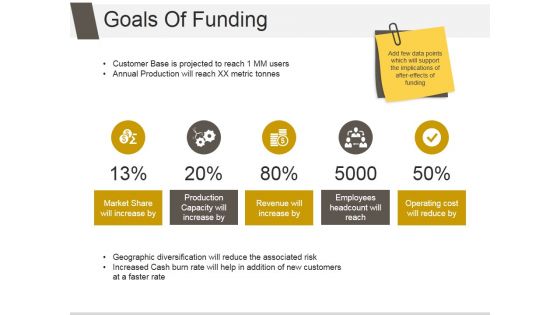
Goals Of Funding Ppt PowerPoint Presentation Background Designs
This is a goals of funding ppt powerpoint presentation background designs. This is a five stage process. The stages in this process are market share will increase by, production capacity will increase by, revenue will increase by, employees headcount will reach, operating cost will reduce by.
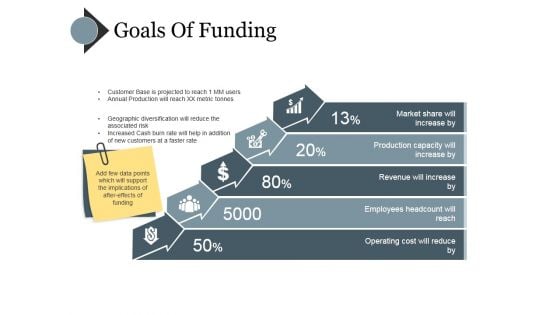
Goals Of Funding Ppt PowerPoint Presentation Gallery Shapes
This is a goals of funding ppt powerpoint presentation gallery shapes. This is a five stage process. The stages in this process are market share will increase by, production capacity will increase by, revenue will increase by, employees headcount will reach, operating cost will reduce by.
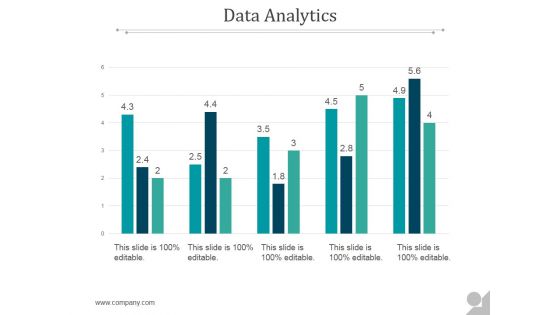
Data Analytics Ppt PowerPoint Presentation Themes
This is a data analytics ppt powerpoint presentation themes. This is a five stage process. The stages in this process are business, marketing, presentation, data analyst, management.
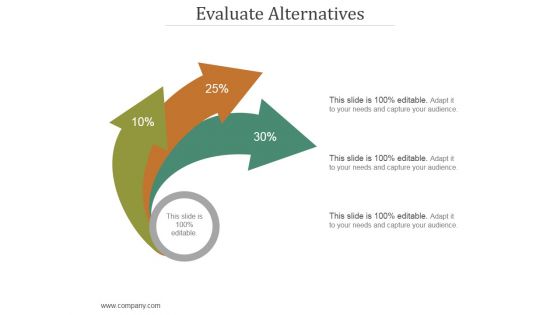
Evaluate Alternatives Ppt PowerPoint Presentation Microsoft
This is a evaluate alternatives ppt powerpoint presentation microsoft. This is a three stage process. The stages in this process are arrow, finance, success, growth, analysis.
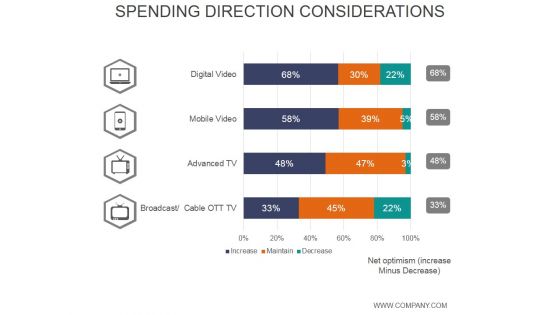
Spending Direction Considerations Ppt PowerPoint Presentation Images
This is a spending direction considerations ppt powerpoint presentation images. This is a four stage process. The stages in this process are percentage, finance, business, marketing, strategy.
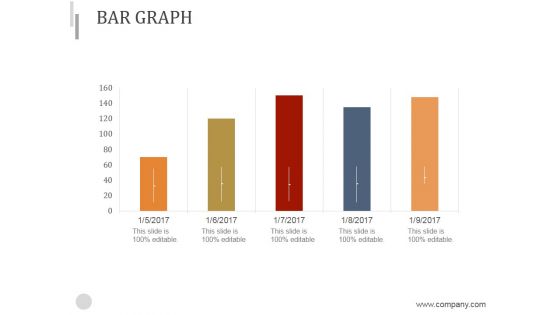
Bar Graph Ppt PowerPoint Presentation Styles
This is a bar graph ppt powerpoint presentation styles. This is a five stage process. The stages in this process are bar graph, business, marketing, strategy, growth.
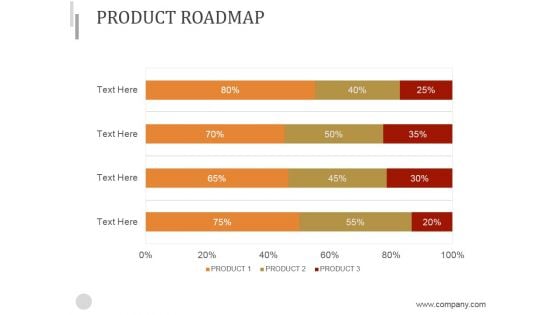
Product Roadmap Ppt PowerPoint Presentation Inspiration
This is a product roadmap ppt powerpoint presentation inspiration. This is a four stage process. The stages in this process are roadmap, finance, strategy, success, management.
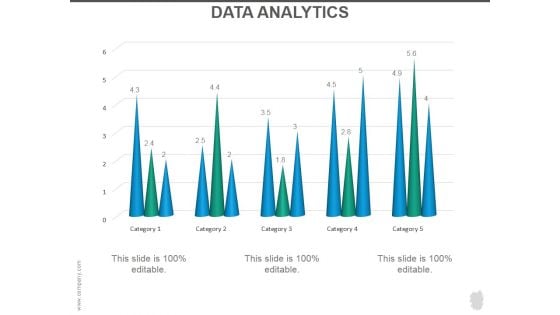
Data Analytics Ppt PowerPoint Presentation Graphics
This is a data analytics ppt powerpoint presentation graphics. This is a five stage process. The stages in this process are data analysis, business, marketing, success, graph.
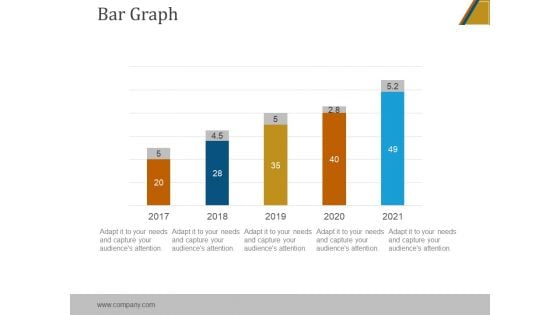
Bar Graph Ppt PowerPoint Presentation Designs
This is a bar graph ppt powerpoint presentation designs. This is a five stage process. The stages in this process are bar graph, marketing, analysis, strategy, business.
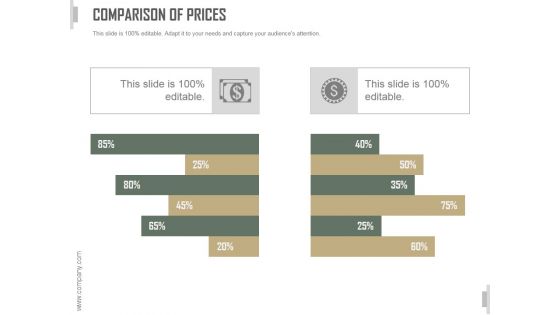
Comparison Of Prices Ppt PowerPoint Presentation Show
This is a comparison of prices ppt powerpoint presentation show. This is a two stage process. The stages in this process are business, strategy, management, marketing, finance.
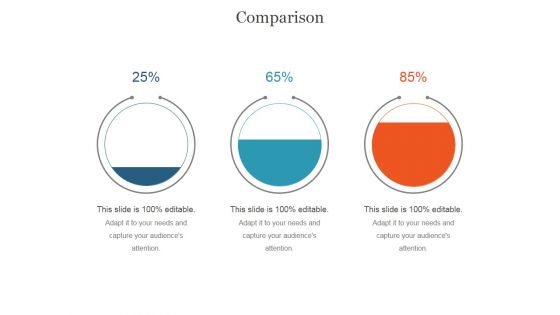
Comparison Ppt PowerPoint Presentation Slide Download
This is a comparison ppt powerpoint presentation slide download. This is a three stage process. The stages in this process are business, management, marketing, finance, planning.
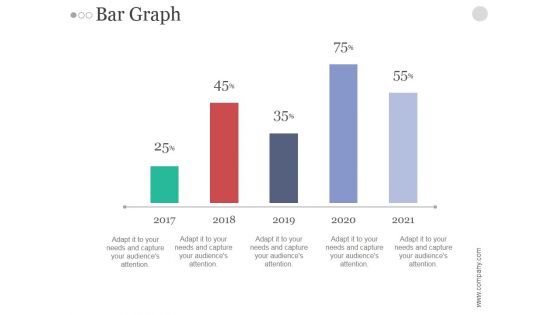
Bar Graph Ppt PowerPoint Presentation Portfolio
This is a bar graph ppt powerpoint presentation portfolio. This is a five stage process. The stages in this process are bar graph, marketing, analysis, finance, business, investment.
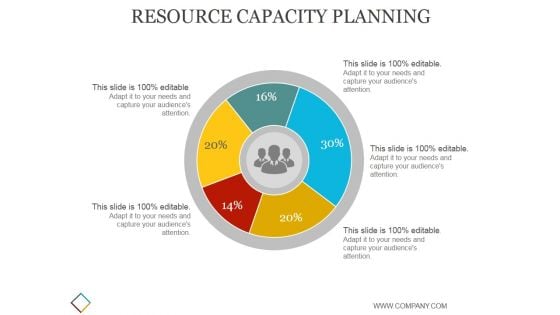
Resource Capacity Planning Ppt PowerPoint Presentation Diagrams
This is a resource capacity planning ppt powerpoint presentation diagrams. This is a five stage process. The stages in this process are business, strategy, marketing, analysis, finance.
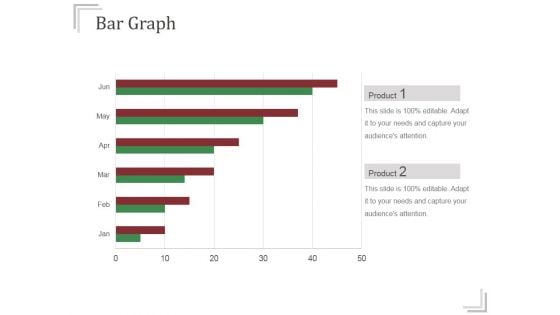
Bar Graph Ppt PowerPoint Presentation Slide
This is a bar graph ppt powerpoint presentation slide. This is a six stage process. The stages in this process are bar graph, analysis, marketing, strategy, business, finance.
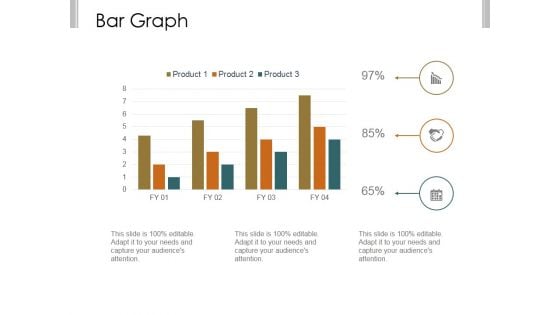
Bar Graph Ppt PowerPoint Presentation Examples
This is a bar graph ppt powerpoint presentation examples. This is a three stage process. The stages in this process are business, strategy, marketing, analysis, finance, bar graph.
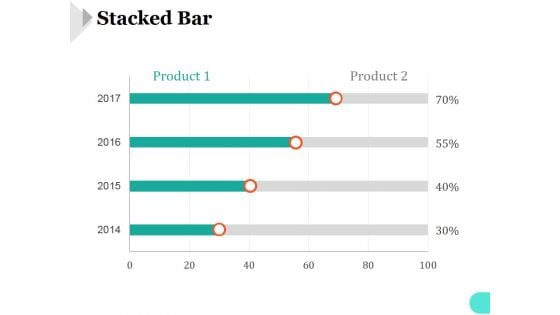
Stacked Bar Ppt PowerPoint Presentation Graphics
This is a stacked bar ppt powerpoint presentation graphics. This is a four stage process. The stages in this process are stacked bar, finance, marketing, analysis, business.

Comparison Ppt PowerPoint Presentation Design Ideas
This is a comparison ppt powerpoint presentation design ideas. This is a two stage process. The stages in this process are compare, finance, analysis, business, marketing.
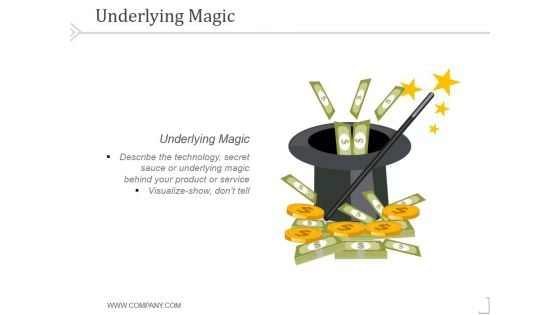
Underlying Magic Ppt PowerPoint Presentation Information
This is a underlying magic ppt powerpoint presentation information. This is a one stage process. The stages in this process are business, strategy, marketing, success, underlying magic.
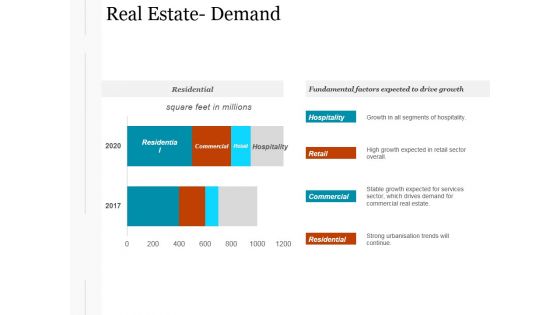
Real Estate Demand Ppt PowerPoint Presentation Designs
This is a real estate demand ppt powerpoint presentation designs. This is a two stage process. The stages in this process are hospitality, retail, commercial, residential.
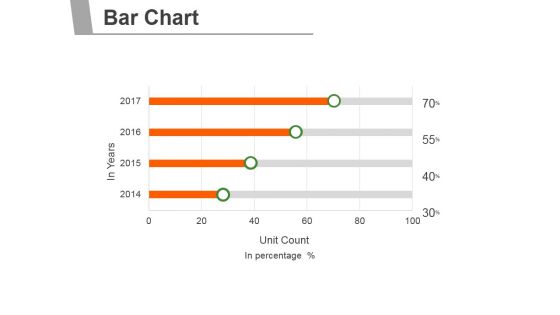
Bar Chart Ppt PowerPoint Presentation Deck
This is a bar chart ppt powerpoint presentation deck. This is a four stage process. The stages in this process are business, marketing, management, bar chart, finance.
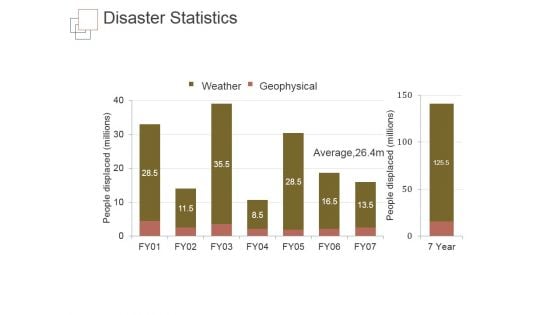
Disaster Statistics Ppt PowerPoint Presentation Example
This is a disaster statistics ppt powerpoint presentation example. This is a seven stage process. The stages in this process are weather, geophysical, people displaced, average.
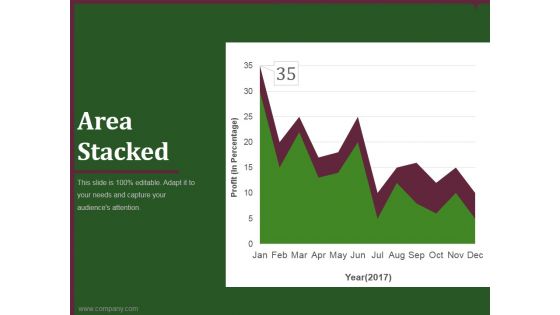
area stacked ppt powerpoint presentation information
This is a area stacked ppt powerpoint presentation information. This is a one stage process. The stages in this process are business, marketing, area chart, analysis, techniques.
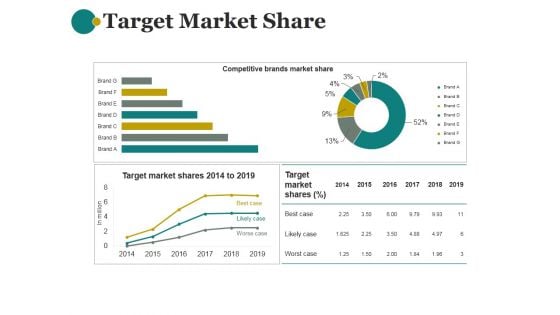
Target Market Share Ppt PowerPoint Presentation Introduction
This is a target market share ppt powerpoint presentation introduction. This is a four stage process. The stages in this process are finance, marketing, planning ,business, management, strategy.
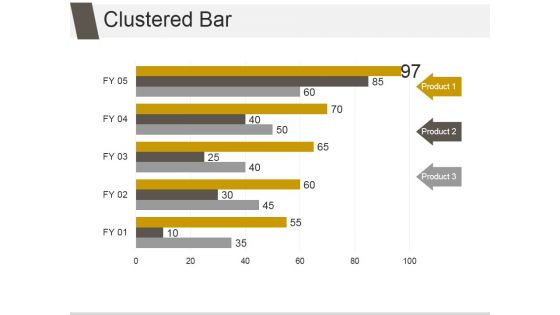
Clustered Bar Ppt PowerPoint Presentation Background Image
This is a clustered bar ppt powerpoint presentation background image. This is a three stage process. The stages in this process are business, marketing, finance, product, management.
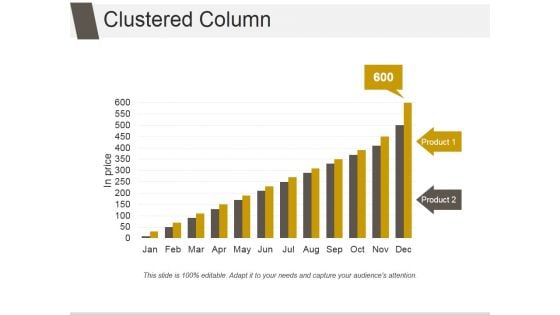
Clustered Column Ppt PowerPoint Presentation Images
This is a clustered column ppt powerpoint presentation images. This is a twelve stage process. The stages in this process are business, marketing, finance, growth, timeline.
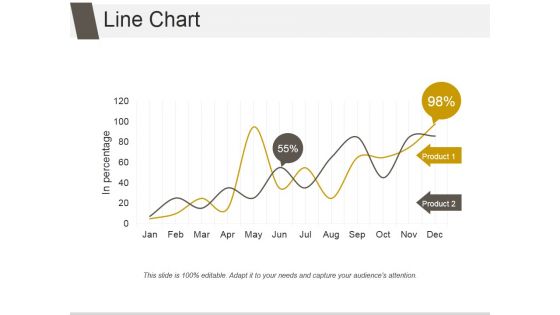
Line Chart Ppt PowerPoint Presentation Professional
This is a line chart ppt powerpoint presentation professional. This is a two stage process. The stages in this process are business, marketing, growth, finance, line chart.
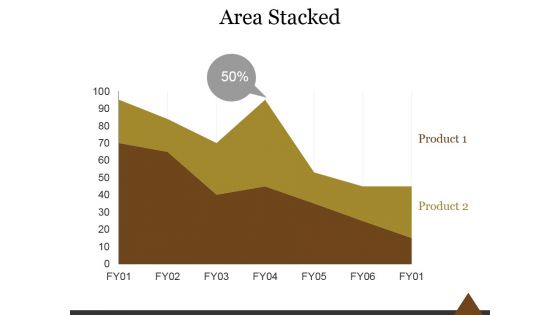
Area Stacked Ppt PowerPoint Presentation Show
This is a area stacked ppt powerpoint presentation show. This is a two stage process. The stages in this process are area, stacked, success, strategy, marketing, management.
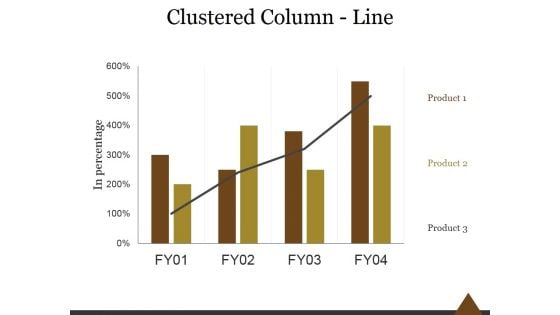
Clustered Column Line Ppt PowerPoint Presentation Slides
This is a clustered column line ppt powerpoint presentation slides. This is a four stage process. The stages in this process are clustered, column, line, business, marketing.
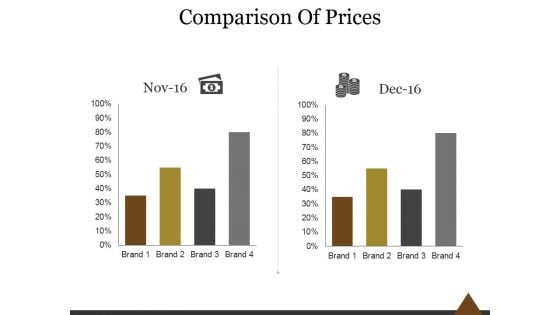
Comparison Of Prices Ppt PowerPoint Presentation Tips
This is a comparison of prices ppt powerpoint presentation tips. This is a two stage process. The stages in this process are comparison, prices, brand, business, marketing.
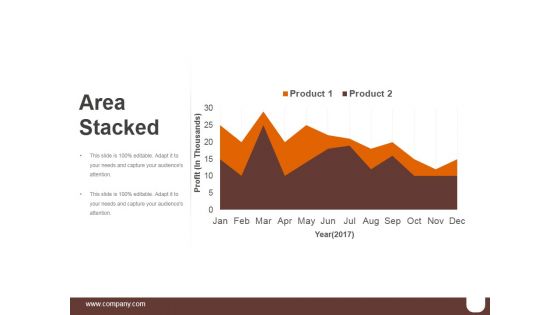
Area Stacked Ppt PowerPoint Presentation Slide
This is a area stacked ppt powerpoint presentation slide. This is a two stage process. The stages in this process are business, marketing, product, finance, area stacked.
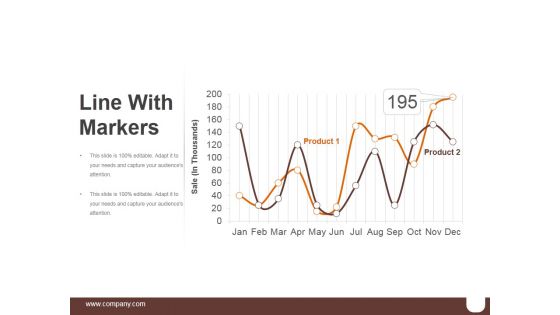
Line With Markers Ppt PowerPoint Presentation Microsoft
This is a line with markers ppt powerpoint presentation microsoft. This is a two stage process. The stages in this process are business, marketing, line chart, finance, management.
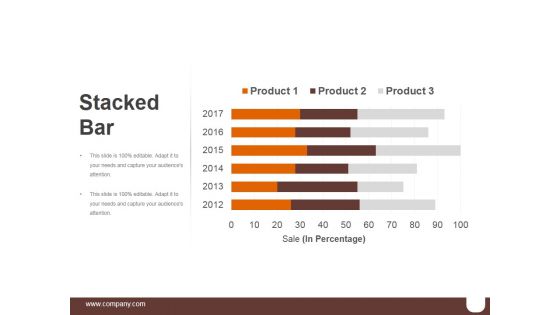
Stacked Bar Ppt PowerPoint Presentation Model
This is a stacked bar ppt powerpoint presentation model. This is a six stage process. The stages in this process are finance, analysis, business, marketing, strategy.
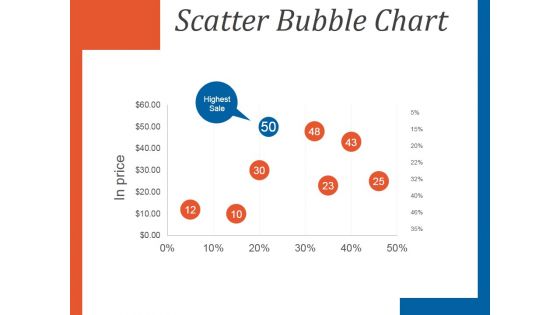
Scatter Bubble Chart Ppt PowerPoint Presentation Slides
This is a scatter bubble chart ppt powerpoint presentation slides. This is a eight stage process. The stages in this process are in price, highest sale, business, management.
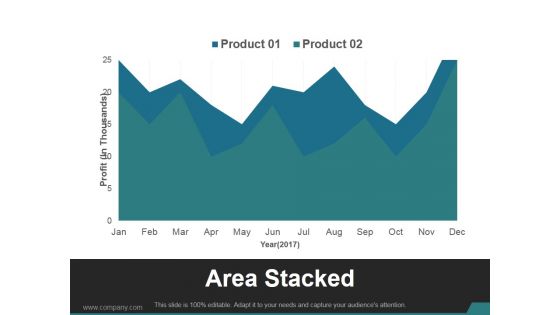
Area Stacked Ppt PowerPoint Presentation Shapes
This is a area stacked ppt powerpoint presentation shapes. This is a two stage process. The stages in this process are business, marketing, product, finance, profit.
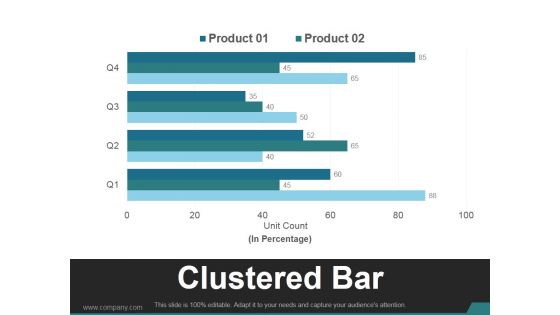
Clustered Bar Ppt PowerPoint Presentation Gallery
This is a clustered bar ppt powerpoint presentation gallery. This is a four stage process. The stages in this process are business, marketing, clustered bar, product, finance.


 Continue with Email

 Home
Home


