Financial Summary
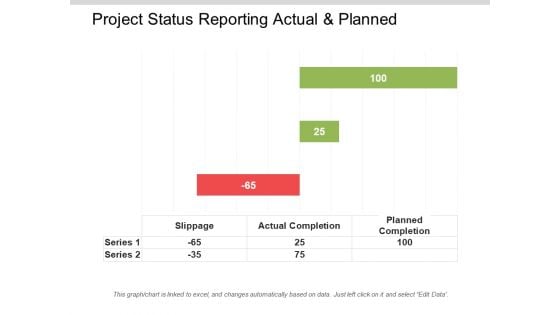
Project Status Reporting Actual And Planned Ppt PowerPoint Presentation Ideas Graphics Template
This is a project status reporting actual and planned ppt powerpoint presentation ideas graphics template. This is a three stage process. The stages in this process are project management, project progress, project growth.
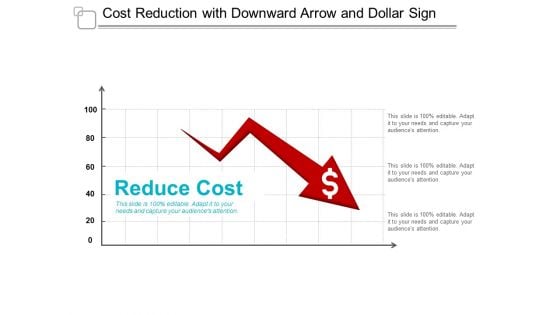
Cost Reduction With Downward Arrow And Dollar Sign Ppt Powerpoint Presentation Infographics Templates
This is a cost reduction with downward arrow and dollar sign ppt powerpoint presentation infographics templates. This is a three stage process. The stages in this process are data analysis, data science, information science.
Data Representation Vector Icon Ppt Powerpoint Presentation Infographic Template Example File
This is a data representation vector icon ppt powerpoint presentation infographic template example file. This is a four stage process. The stages in this process are data visualization icon, data management icon.
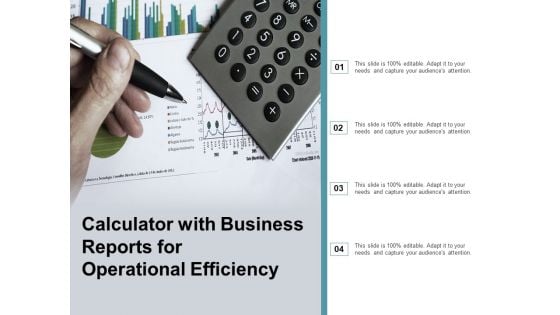
Calculator With Business Reports For Operational Efficiency Ppt Powerpoint Presentation Ideas Infographic Template
This is a calculator with business reports for operational efficiency ppt powerpoint presentation ideas infographic template. This is a four stage process. The stages in this process are business metrics, business kpi, business dashboard.
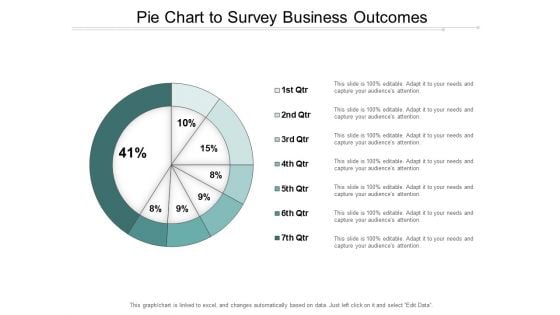
Pie Chart To Survey Business Outcomes Ppt Powerpoint Presentation Infographic Template Gridlines
This is a pie chart to survey business outcomes ppt powerpoint presentation infographic template gridlines. This is a seven stage process. The stages in this process are business outcomes, business results, business output.
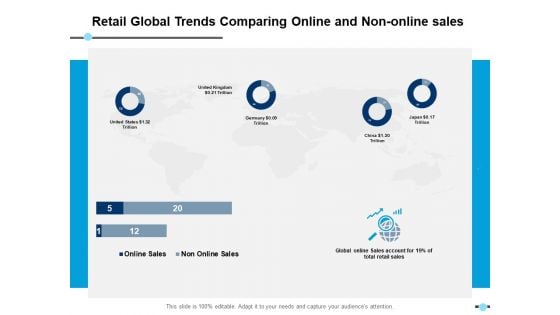
Retail Global Trends Comparing Online And Non Online Sales Donut Ppt PowerPoint Presentation Infographic Template Images
This is a retail global trends comparing online and non online sales donut ppt powerpoint presentation infographic template images. This is a four stage process. The stages in this process are finance, strategy, analysis, marketing.

Car Dashboard And Speedometer Graphics Ppt PowerPoint Presentation File Graphics Template
This is a car dashboard and speedometer graphics ppt powerpoint presentation file graphics template. This is a four stage process. The stages in this process are fuel gauge, gas gauge, fuel containers.
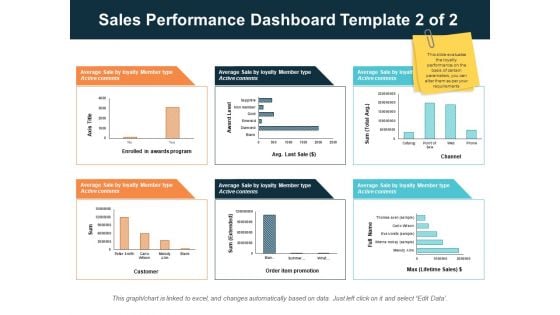
Sales Performance Dashboard Template 2 Of 2 Ppt PowerPoint Presentation Infographics Design Inspiration
This is a sales performance dashboard template 2 of 2 ppt powerpoint presentation infographics design inspiration. This is a three stage process. The stages in this process are finance, management, strategy, analysis, marketing.
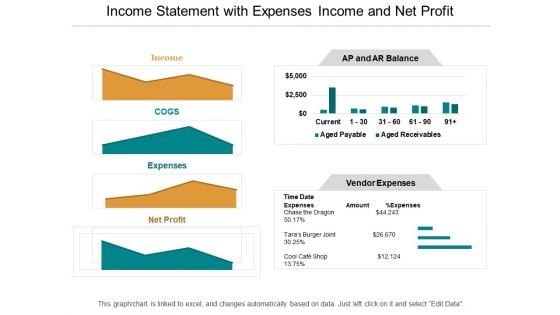
Income Statement With Expenses Income And Net Profit Ppt PowerPoint Presentation Infographic Template Smartart
This is a income statement with expenses income and net profit ppt powerpoint presentation infographic template smartart. This is a four stage process. The stages in this process are accounting review, accounting report, accounting statement.
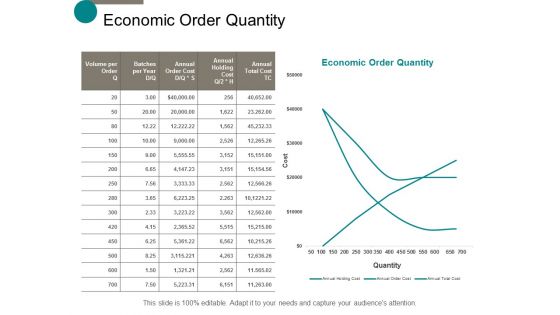
Economic Order Quantity Ppt Powerpoint Presentation Styles Skills
This is a economic order quantity ppt powerpoint presentation styles skills. This is a three stage process. The stages in this process are finance, marketing, management, investment, analysis.

Economic Order Quantity Ppt PowerPoint Presentation Pictures Introduction
This is a economic order quantity ppt powerpoint presentation pictures introduction. This is a three stage process. The stages in this process are finance, strategy, marketing, compare, business.
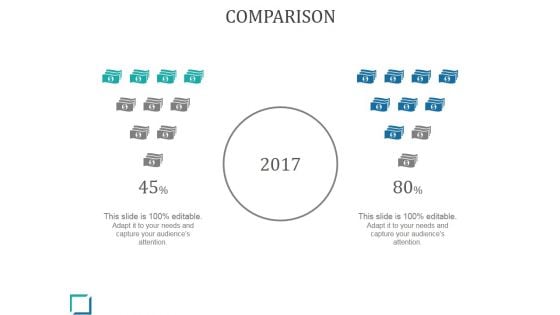
Comparison Ppt PowerPoint Presentation Guide
This is a comparison ppt powerpoint presentation guide. This is a two stage process. The stages in this process are business, marketing, year, finance, percentage.

Project Graphical Economic Model Ppt PowerPoint Presentation Gallery Portfolio
This is a project graphical economic model ppt powerpoint presentation gallery portfolio. This is a two stage process. The stages in this process are product improvement, product enhancement, product upgradation.
Effect Of Consumer Service On Consumer Loyalty And Brand Switching Template 1 Ppt PowerPoint Presentation Icon Templates
This is a effect of consumer service on consumer loyalty and brand switching template 1 ppt powerpoint presentation icon templates. This is a four stage process. The stages in this process are mobile phone network, energy supplier, super markets.
Product Launch Budget Plan Ppt PowerPoint Presentation Icon Slide
This is a product launch budget plan ppt powerpoint presentation icon slide. This is a seven stage process. The stages in this process are bar graph, icons, percentage, finance, business.
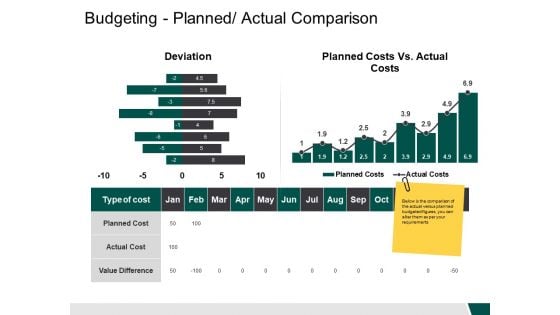
Budgeting Planned Actual Comparison Deviation Ppt PowerPoint Presentation File Gallery
This is a budgeting planned actual comparison deviation ppt powerpoint presentation file gallery. This is a two stage process. The stages in this process are business, finance, strategy, analysis, marketing.
Business Profit And Revenue Icon With Text Holders Ppt PowerPoint Presentation File Inspiration PDF
Presenting this set of slides with name business profit and revenue icon with text holders ppt powerpoint presentation file inspiration pdf. This is a six stage process. The stages in this process are business profit and revenue icon with text holders. This is a completely editable PowerPoint presentation and is available for immediate download. Download now and impress your audience.
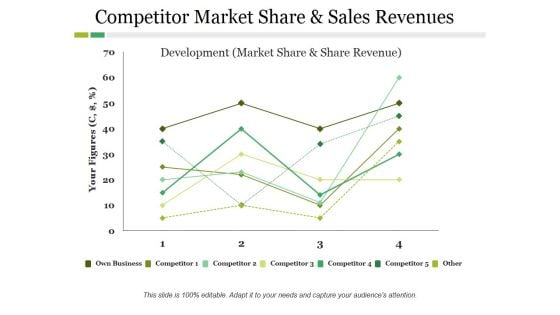
Competitor Market Share And Sales Revenues Ppt PowerPoint Presentation Ideas Slide
This is a competitor market share and sales revenues ppt powerpoint presentation ideas slide. This is a four stage process. The stages in this process are competitor, development, own business, your figures.
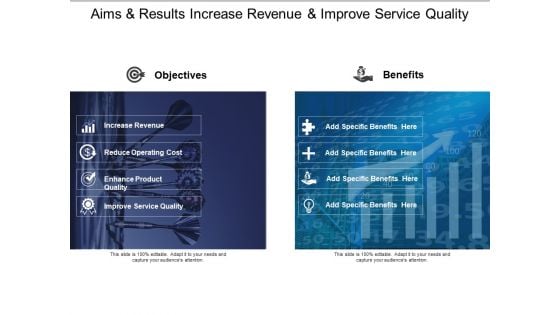
Aims And Results Increase Revenue And Improve Service Quality Ppt PowerPoint Presentation Gallery Design Inspiration
This is a aims and results increase revenue and improve service quality ppt powerpoint presentation gallery design inspiration. This is a two stage process. The stages in this process are objective and benefit, goal and benefit, plan and benefit.

Competitor Revenue And Profit Option 1 Of 2 Ppt PowerPoint Presentation Ideas Gallery
This is a competitor revenue and profit option 1 of 2 ppt powerpoint presentation ideas gallery. This is a two stage process. The stages in this process are finance, business, management, strategy, analysis.
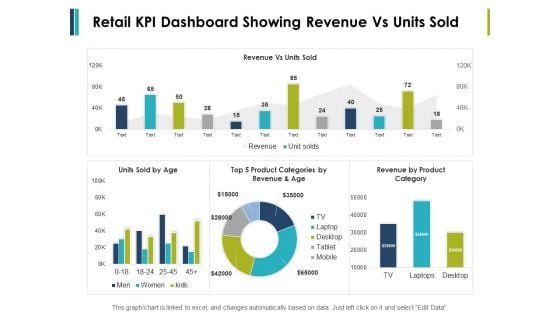
Retail Kpi Dashboard Showing Revenue Vs Units Sold Ppt PowerPoint Presentation File Formats
This is a retail kpi dashboard showing revenue vs units sold ppt powerpoint presentation file formats. This is a three stage process. The stages in this process are finance, marketing, management, investment, analysis.
Collect Money Wallet Vector Icon Ppt Powerpoint Presentation Inspiration Gallery
This is a collect money wallet vector icon ppt powerpoint presentation inspiration gallery. This is a one stage process. The stages in this process are icon save money, icon save expenses, icon save cost.

Wealth Protection Money On Hand Ppt Powerpoint Presentation File Gridlines
This is a wealth protection money on hand ppt powerpoint presentation file gridlines. This is a one stage process. The stages in this process are icon save money, icon save expenses, icon save cost.
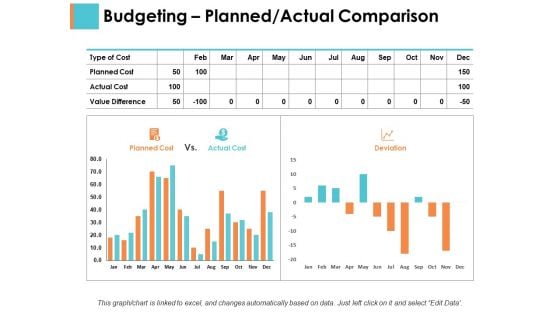
Budgeting Planned Actual Comparison Sample Budget Ppt Ppt PowerPoint Presentation Portfolio Inspiration
This is a budgeting planned actual comparison sample budget ppt ppt powerpoint presentation portfolio inspiration. This is a two stage process. The stages in this process are business, management, strategy, analysis, marketing.
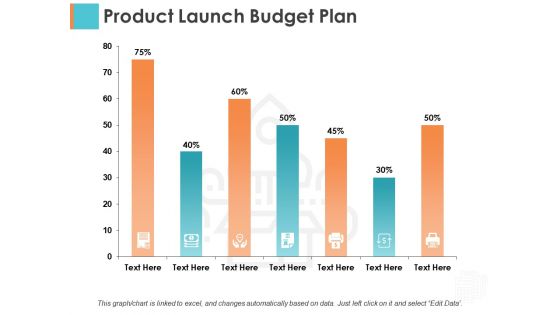
Product Launch Budget Plan Sample Budget Ppt Ppt PowerPoint Presentation Show Smartart
This is a product launch budget plan sample budget ppt ppt powerpoint presentation show smartart. This is a two stage process. The stages in this process are business, management, strategy, analysis, icons.
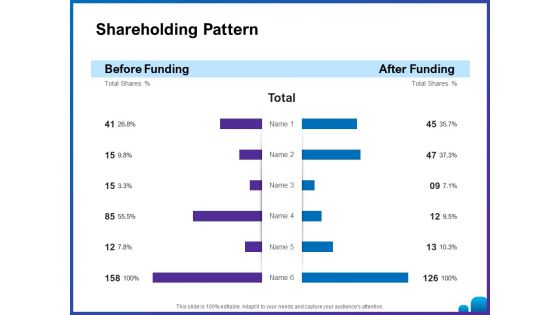
Venture Capital Funding For Firms Shareholding Pattern Ppt Outline Examples PDF
This is a venture capital funding for firms shareholding pattern ppt outline examples pdf template with various stages. Focus and dispense information on six stages using this creative set, that comes with editable features. It contains large content boxes to add your information on topics like before funding, after funding . You can also showcase facts, figures, and other relevant content using this PPT layout. Grab it now.
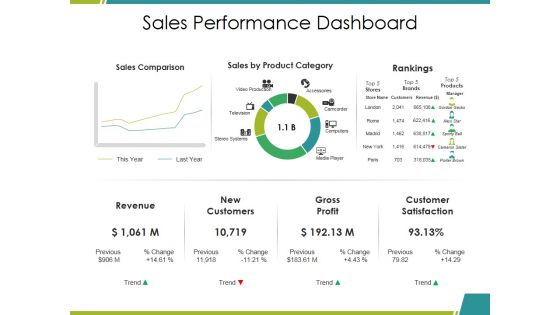
Sales Performance Dashboard Ppt PowerPoint Presentation Infographics Mockup
This is a sales performance dashboard ppt powerpoint presentation infographics mockup. This is a three stage process. The stages in this process are sales comparison, sales by product category, rankings, revenue, gross profit.
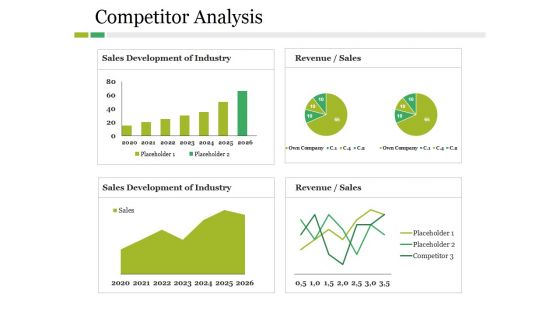
Competitor Analysis Ppt PowerPoint Presentation File Graphics Example
This is a competitor analysis ppt powerpoint presentation file graphics example. This is a four stage process. The stages in this process are revenue, sales development of industry, own company, placeholder, competitor.
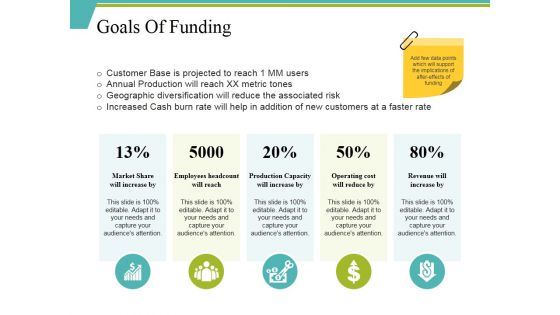
Goals Of Funding Ppt PowerPoint Presentation Pictures Format
This is a goals of funding ppt powerpoint presentation pictures format. This is a five stage process. The stages in this process are market share will increase by, operating cost will reduce by, revenue will increase by.
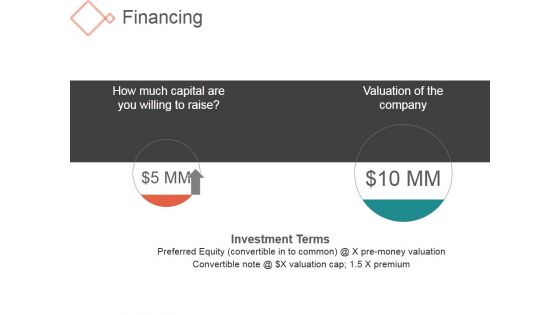
Financing Ppt PowerPoint Presentation Background Designs
This is a financing ppt powerpoint presentation background designs. This is a two stage process. The stages in this process are how much capital are you willing to raise, valuation of the company, investment terms.
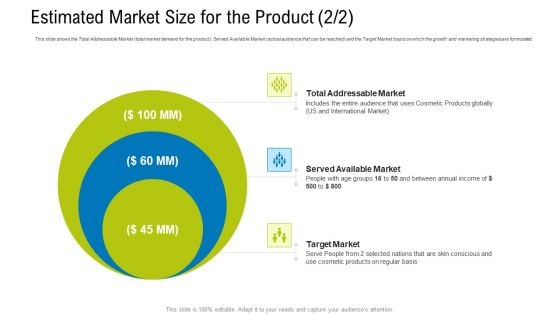
Estimated Market Size For The Product Ppt Layouts Slide Download PDF
This slide shows the Total Addressable Market total market demand for the product, Served Available Market actual audience that can be reached and the Target Market basis on which the growth and marketing strategies are formulated. Presenting estimated market size for the product ppt layouts slide download pdf. to provide visual cues and insights. Share and navigate important information on three stages that need your due attention. This template can be used to pitch topics like total available market, serviceable available market, target market. In addtion, this PPT design contains high resolution images, graphics, etc, that are easily editable and available for immediate download.
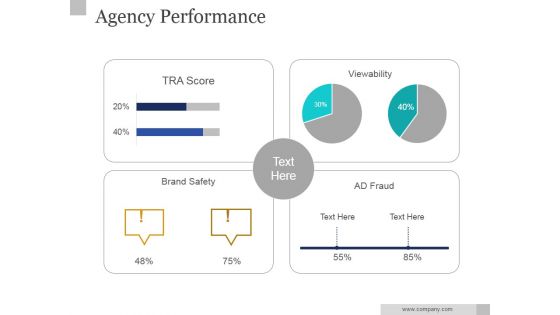
Agency Performance Ppt PowerPoint Presentation Background Designs
This is a agency performance ppt powerpoint presentation background designs. This is a four stage process. The stages in this process are transcore, viewability, brand safety, ad fraud.

Thank You Ppt PowerPoint Presentation Picture
This is a thank you ppt powerpoint presentation picture. This is a one stage process. The stages in this process are address, contact numbers, email address.
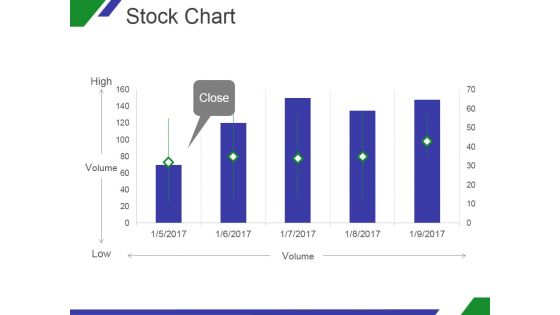
Stock Chart Ppt PowerPoint Presentation Slides
This is a stock chart ppt powerpoint presentation slides. This is a five stage process. The stages in this process are close, volume, high, low.
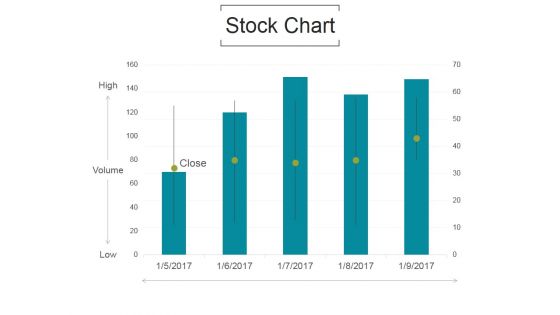
Stock Chart Ppt PowerPoint Presentation Example File
This is a stock chart ppt powerpoint presentation example file. This is a five stage process. The stages in this process are volume, high, low, close.

Stock Chart Ppt PowerPoint Presentation Inspiration
This is a stock chart ppt powerpoint presentation inspiration. This is a five stage process. The stages in this process are high, volume, low, close.

Stock Chart Ppt PowerPoint Presentation Professional
This is a stock chart ppt powerpoint presentation professional. This is a five stage process. The stages in this process are high, volume, low, close.
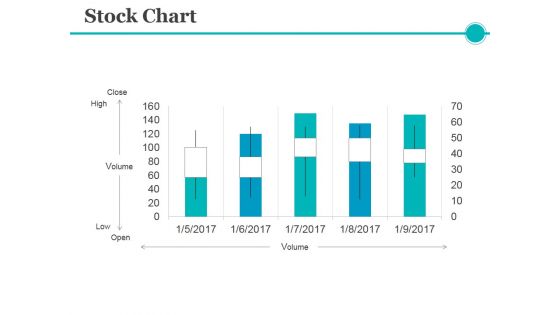
Stock Chart Ppt PowerPoint Presentation Ideas Example
This is a stock chart ppt powerpoint presentation ideas example. This is a five stage process. The stages in this process are volume, close, high, low, open.
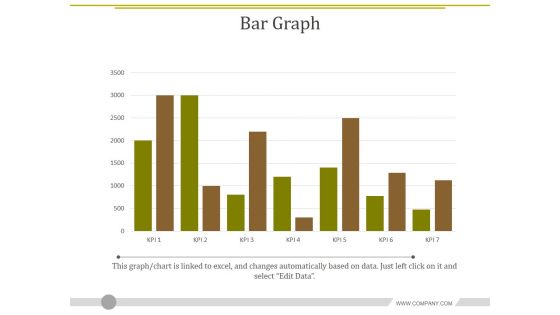
Bar Graph Ppt PowerPoint Presentation Gallery Good
This is a bar graph ppt powerpoint presentation gallery good. This is a seven stage process. The stages in this process are graph, finance, business, marketing.
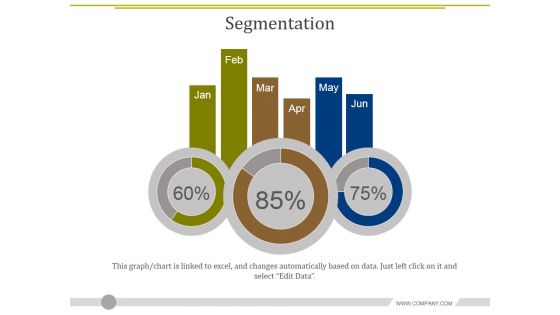
Segmentation Ppt PowerPoint Presentation Portfolio Format
This is a segmentation ppt powerpoint presentation portfolio format. This is a three stage process. The stages in this process are finance, percentage, business, marketing.

Stock Chart Ppt PowerPoint Presentation Ideas Brochure
This is a stock chart ppt powerpoint presentation ideas brochure. This is a five stage process. The stages in this process are high, volume, low, close.

Thank You Ppt PowerPoint Presentation Styles Maker
This is a thank you ppt powerpoint presentation styles maker. This is a one stage process. The stages in this process are thank you.
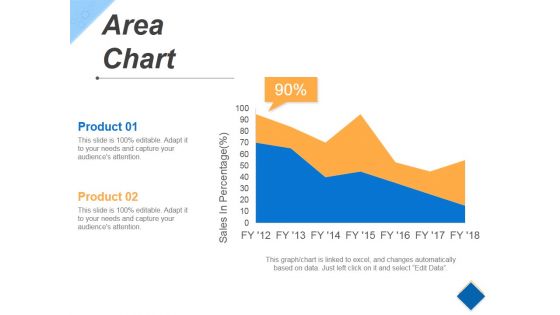
Area Chart Ppt PowerPoint Presentation Slides Gridlines
This is a area chart ppt powerpoint presentation slides gridlines. This is a two stage process. The stages in this process are business, finance, marketing, percentage.
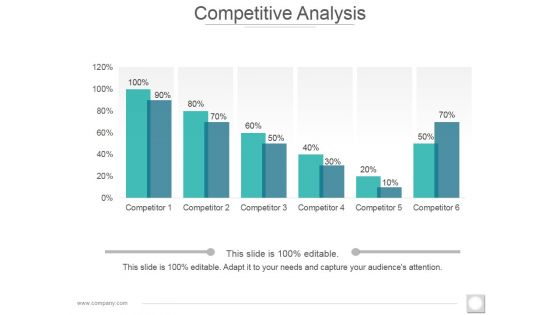
Competitive Analysis Ppt PowerPoint Presentation Graphics
This is a competitive analysis ppt powerpoint presentation graphics. This is a six stage process. The stages in this process are competitor, business, marketing, percentage, finance.
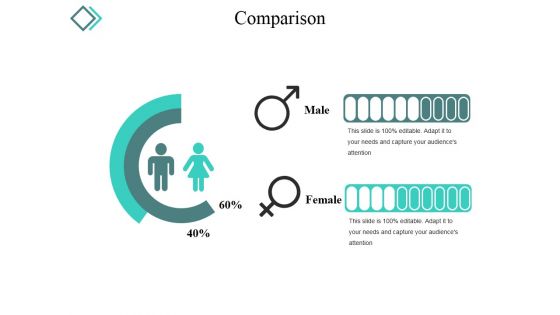
Comparison Ppt PowerPoint Presentation Portfolio Slides
This is a comparison ppt powerpoint presentation portfolio slides. This is a two stage process. The stages in this process are male, female, comparison, percentage, business.
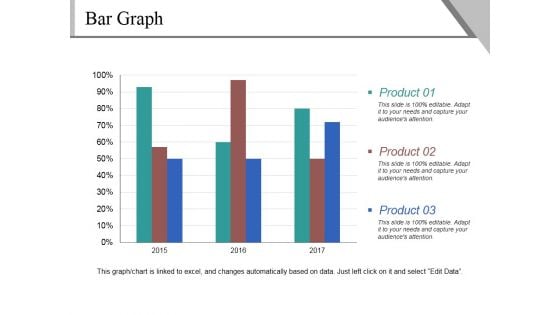
Bar Graph Ppt PowerPoint Presentation Ideas Show
This is a bar graph ppt powerpoint presentation ideas show. This is a three stage process. The stages in this process are product, percentage, business, year, graph.
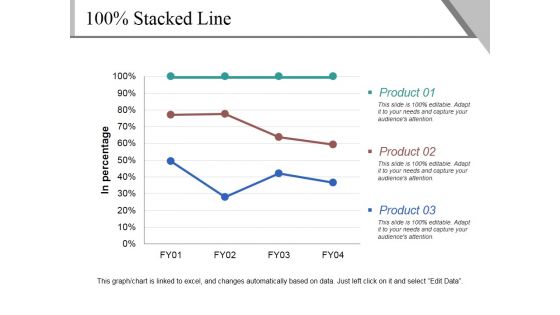
Stacked Line Ppt PowerPoint Presentation Professional Tips
This is a stacked line ppt powerpoint presentation professional tips. This is a three stage process. The stages in this process are product, in percentage, business, marketing.
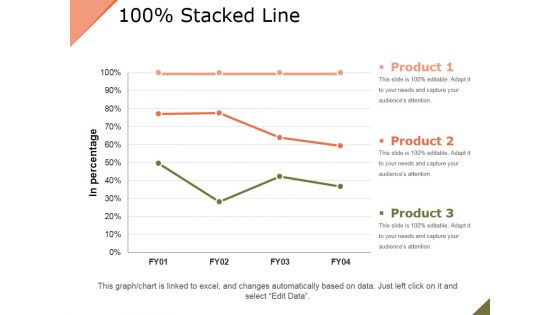
Stacked Line Ppt PowerPoint Presentation Infographics Tips
This is a stacked line ppt powerpoint presentation infographics tips. This is a three stage process. The stages in this process are product, business, percentage, finance.
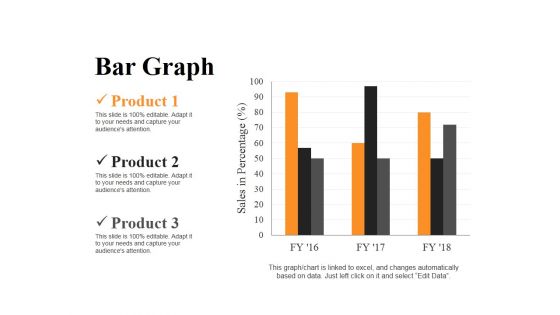
Bar Graph Ppt PowerPoint Presentation Infographics Clipart
This is a bar graph ppt powerpoint presentation infographics clipart. This is a three stage process. The stages in this process are product, graph, finance, business, marketing.
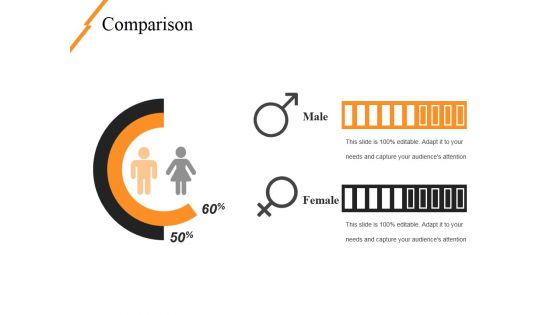
Comparison Ppt PowerPoint Presentation Show Gridlines
This is a comparison ppt powerpoint presentation show gridlines. This is a two stage process. The stages in this process are male, female, percentage, finance, compare.
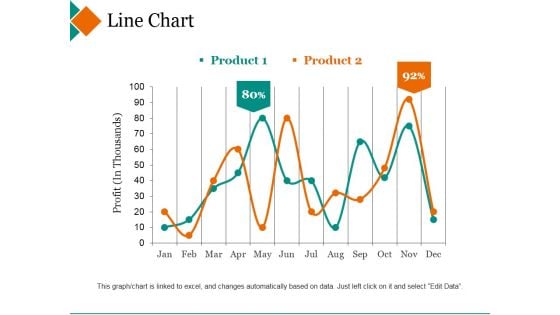
Line Chart Ppt PowerPoint Presentation Inspiration Deck
This is a line chart ppt powerpoint presentation inspiration deck. This is a two stage process. The stages in this process are product, profit, percentage, finance, line graph.
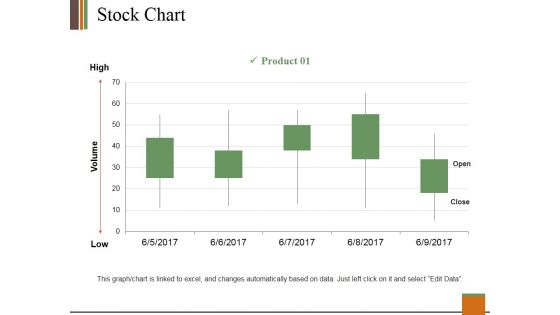
Stock Chart Ppt PowerPoint Presentation Slides Clipart
This is a stock chart ppt powerpoint presentation slides clipart. This is a one stage process. The stages in this process are product, high, volume, low, open, close.
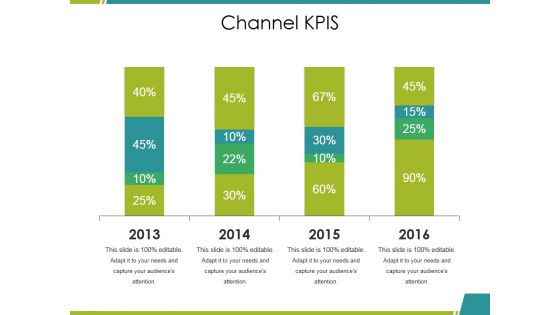
Channel Kpis Ppt PowerPoint Presentation Inspiration Aids
This is a channel kpis ppt powerpoint presentation inspiration aids. This is a four stage process. The stages in this process are business, marketing, graph, percentage, finance.
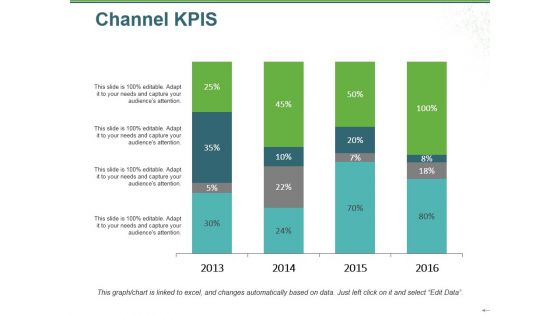
Channel Kpis Ppt PowerPoint Presentation Model Smartart
This is a channel kpis ppt powerpoint presentation model smartart. This is a four stage process. The stages in this process are business, marketing, finance, years, percentage.
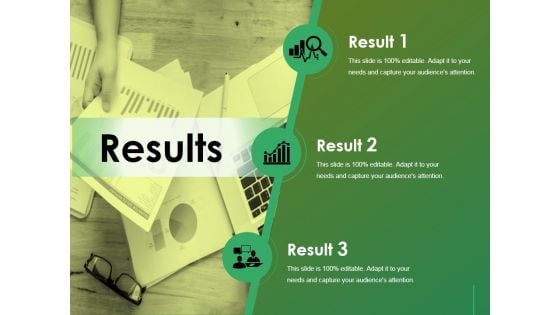
Results Ppt Powerpoint Presentation Infographics File Formats
This is a results ppt powerpoint presentation infographics file formats. This is a three stage process. The stages in this process are analysis, icon, business, marketing, strategy, finance.
Stock Chart Ppt PowerPoint Presentation Inspiration Icon
This is a stock chart ppt powerpoint presentation inspiration icon. This is a two stage process. The stages in this process are high, volume, low, product, close.
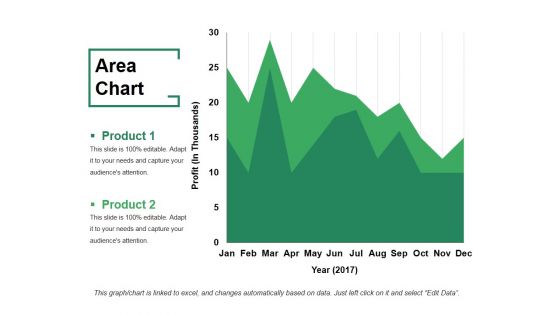
Area Chart Ppt PowerPoint Presentation Gallery Information
This is a area chart ppt powerpoint presentation gallery information. This is a two stage process. The stages in this process are product, area chart, business, finance, marketing.
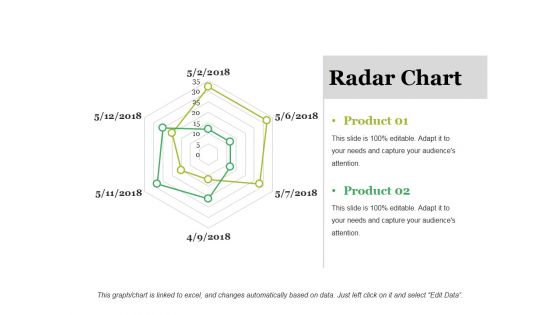
Radar Chart Ppt PowerPoint Presentation Inspiration Rules
This is a radar chart ppt powerpoint presentation inspiration rules. This is a two stage process. The stages in this process are radar chart, business, marketing, finance, management.
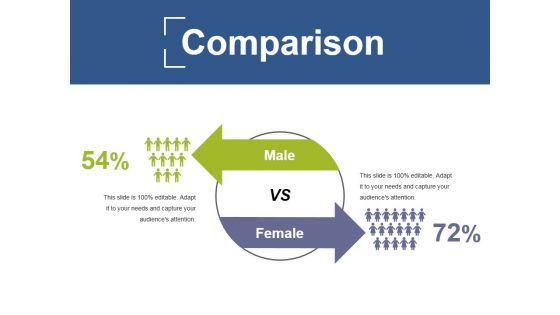
Comparison Ppt PowerPoint Presentation Infographics Rules
This is a comparison ppt powerpoint presentation infographics rules. This is a two stage process. The stages in this process are male, female, comparison, percentage, finance.
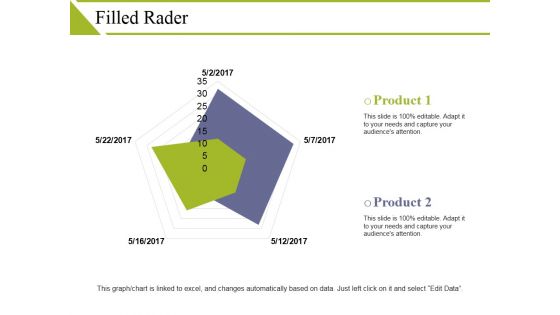
Filled Rader Ppt PowerPoint Presentation Pictures Format
This is a filled rader ppt powerpoint presentation pictures format. This is a two stage process. The stages in this process are product, radar, finance, business, management.


 Continue with Email

 Home
Home


