Financial Summary
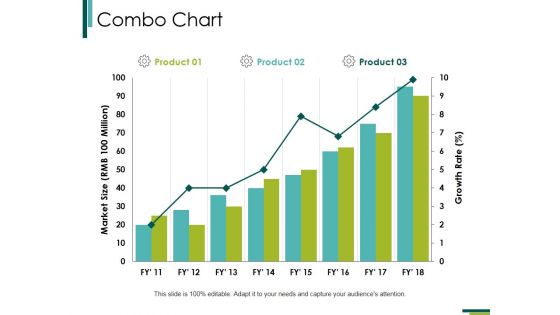
Combo Chart Ppt PowerPoint Presentation Infographic Template Slide Portrait
This is a combo chart ppt powerpoint presentation infographic template slide portrait. This is a three stage process. The stages in this process are combo chart, finance, marketing, strategy, business, growth.
Addressable Market In Sector Ppt PowerPoint Presentation Icon Infographic Template
This is a addressable market in sector ppt powerpoint presentation icon infographic template. This is a two stage process. The stages in this process are business, marketing, strategy, planning, finance.
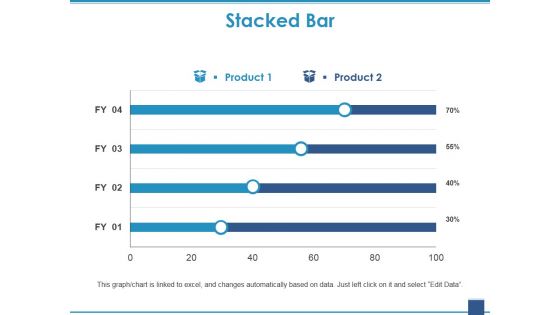
Stacked Bar Template 1 Ppt PowerPoint Presentation Gallery Deck
This is a stacked bar template 1 ppt powerpoint presentation gallery deck. This is a two stage process. The stages in this process are stacked bar, growth, finance, marketing, business.
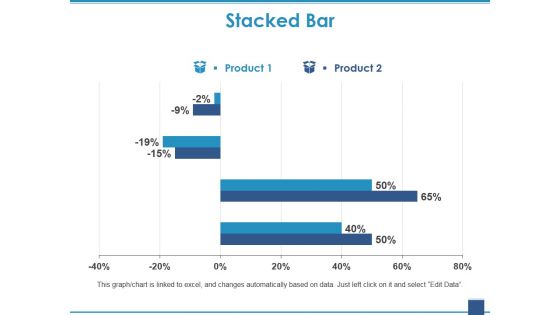
Stacked Bar Template 2 Ppt PowerPoint Presentation Show Clipart
This is a stacked bar template 2 ppt powerpoint presentation show clipart. This is a two stage process. The stages in this process are stacked bar, growth, finance, marketing, business, investment.
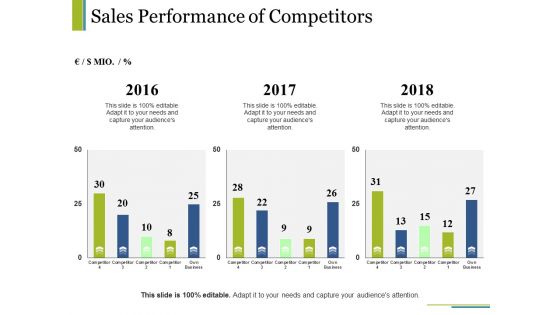
Sales Performance Of Competitors Ppt PowerPoint Presentation Portfolio Templates
This is a sales performance of competitors ppt powerpoint presentation portfolio templates. This is a three stage process. The stages in this process are business, marketing, percentage, graph, finance.
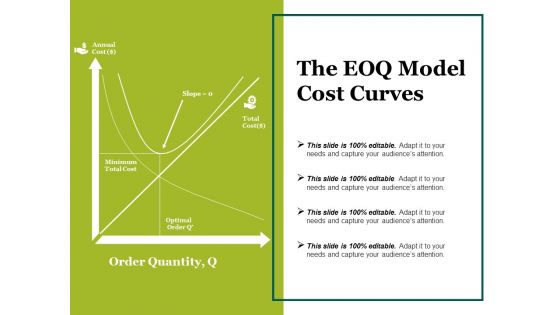
The Eoq Model Cost Curves Ppt PowerPoint Presentation Pictures Template
This is a the eoq model cost curves ppt powerpoint presentation pictures template. This is a four stage process. The stages in this process are minimum, total cost, slope, total cost, optimal order.
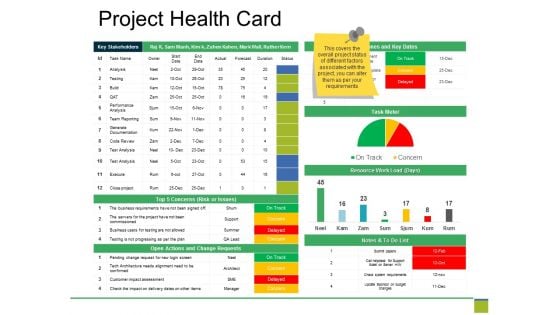
Project Health Card Ppt PowerPoint Presentation Pictures Design Templates
This is a project health card ppt powerpoint presentation pictures design templates. This is a seven stage process. The stages in this process are key stakeholders, milestones and key dates, task meter, submit papers, check system requirements.
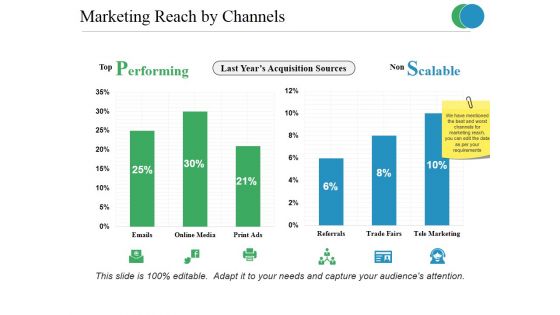
Marketing Reach By Channels Ppt PowerPoint Presentation Infographic Template Background
This is a marketing reach by channels ppt powerpoint presentation infographic template background. This is a two stage process. The stages in this process are performing, scalable, finance, marketing, strategy, business.
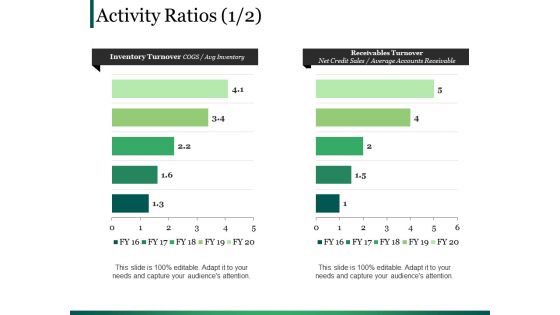
Activity Ratios Template 1 Ppt PowerPoint Presentation Portfolio Graphics
This is a activity ratios template 1 ppt powerpoint presentation portfolio graphics. This is a two stage process. The stages in this process are finance, chart graph, marketing, planning, analysis.
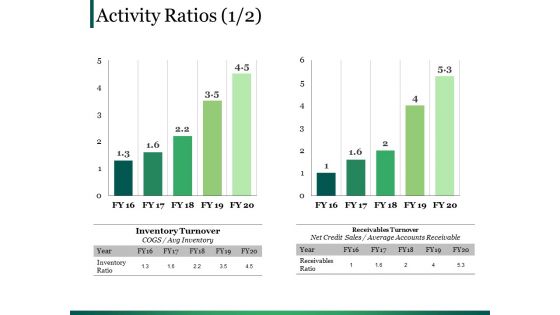
Activity Ratios Template 4 Ppt PowerPoint Presentation Portfolio Backgrounds
This is a activity ratios template 4 ppt powerpoint presentation portfolio backgrounds. This is a two stage process. The stages in this process are finance, chart graph, marketing, planning, analysis.
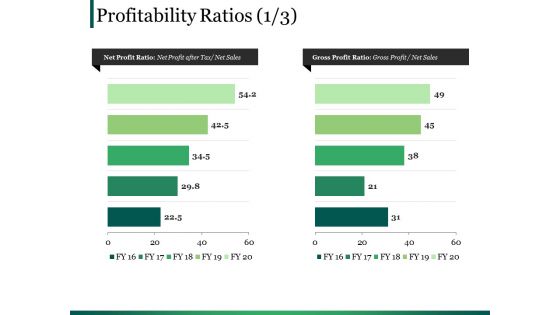
Profitability Ratios Template 1 Ppt PowerPoint Presentation Portfolio Display
This is a profitability ratios template 1 ppt powerpoint presentation portfolio display. This is a two stage process. The stages in this process are business, marketing, bar, finance, planning.
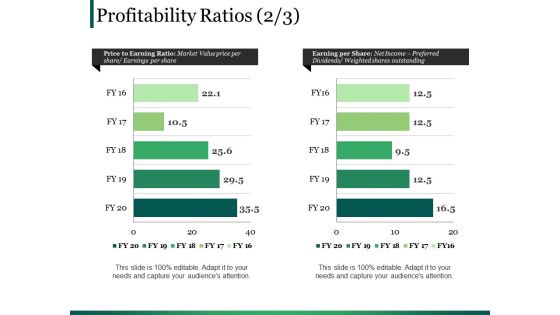
Profitability Ratios Template 3 Ppt PowerPoint Presentation Slides Good
This is a profitability ratios template 3 ppt powerpoint presentation slides good. This is a two stage process. The stages in this process are business, marketing, bar, finance, planning.
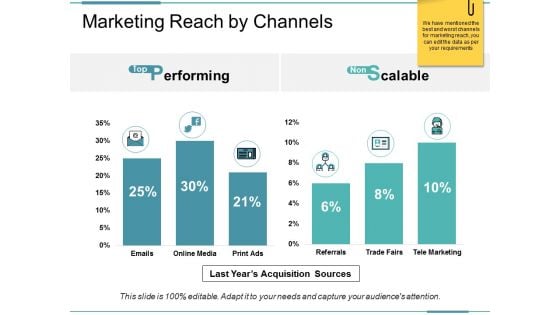
Marketing Reach By Channels Ppt PowerPoint Presentation Pictures Template
This is a marketing reach by channels ppt powerpoint presentation pictures template. This is a two stage process. The stages in this process are performing, scalable, last years acquisition sources.
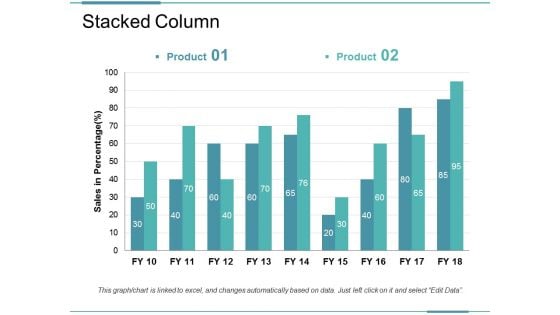
Stacked Column Ppt PowerPoint Presentation Infographic Template Example Introduction
This is a stacked column ppt powerpoint presentation infographic template example introduction. This is a two stage process. The stages in this process are business, marketing, strategy, planning, finance.
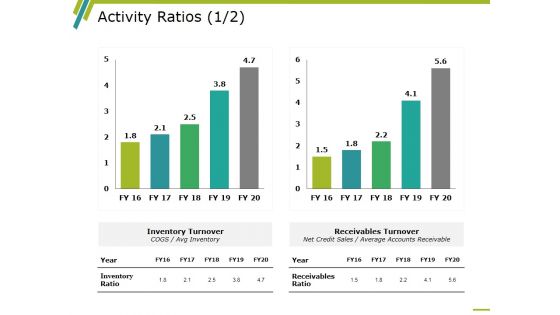
Activity Ratios Template 1 Ppt PowerPoint Presentation Slides Example Topics
This is a activity ratios template 1 ppt powerpoint presentation slides example topics. This is a two stage process. The stages in this process are business, finance, strategy, marketing, analysis.
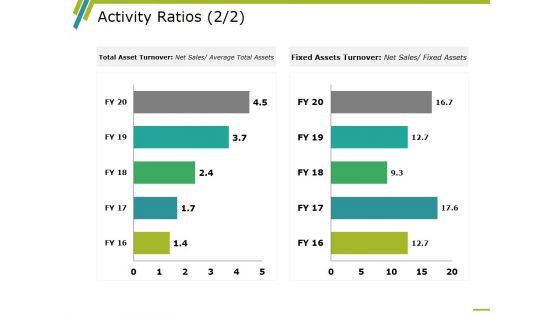
Activity Ratios Template 3 Ppt PowerPoint Presentation Professional Graphic Tips
This is a activity ratios template 3 ppt powerpoint presentation professional graphic tips. This is a two stage process. The stages in this process are business, finance, marketing, strategy, analysis.
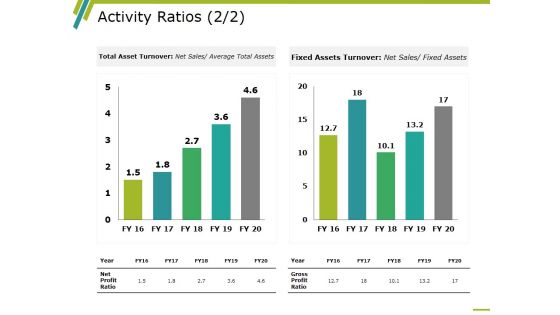
Activity Ratios Template 4 Ppt PowerPoint Presentation Gallery Slides
This is a activity ratios template 4 ppt powerpoint presentation gallery slides. This is a two stage process. The stages in this process are business, finance, marketing, strategy, analysis.
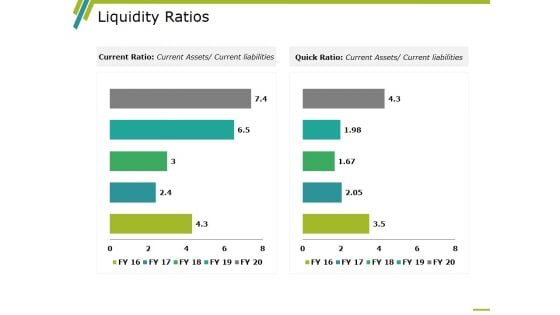
Liquidity Ratios Template 2 Ppt PowerPoint Presentation Ideas Microsoft
This is a liquidity ratios template 2 ppt powerpoint presentation ideas microsoft. This is a two stage process. The stages in this process are business, marketing, graph, year, current ratio, quick ratio.
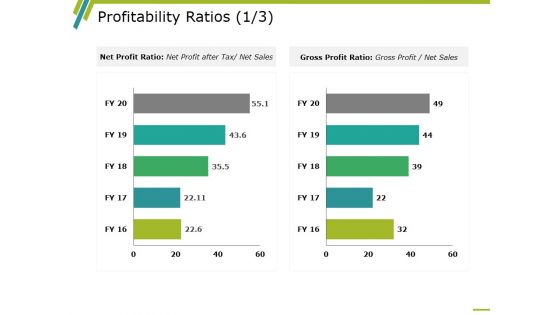
Profitability Ratios Template 1 Ppt PowerPoint Presentation Ideas Master Slide
This is a profitability ratios template 1 ppt powerpoint presentation ideas master slide. This is a two stage process. The stages in this process are business, net profit ratio, gross profit ratio, marketing, graph.
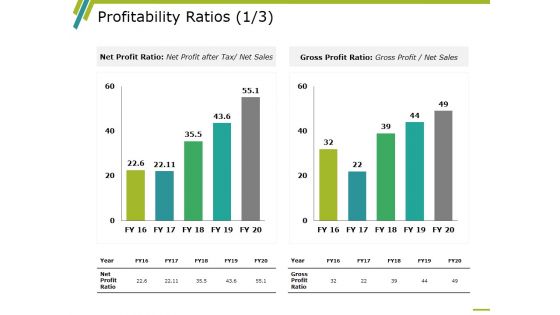
Profitability Ratios Template 2 Ppt PowerPoint Presentation Show Portfolio
This is a profitability ratios template 2 ppt powerpoint presentation show portfolio. This is a two stage process. The stages in this process are business, marketing, graph, net profit ratio, gross profit ratio, year.
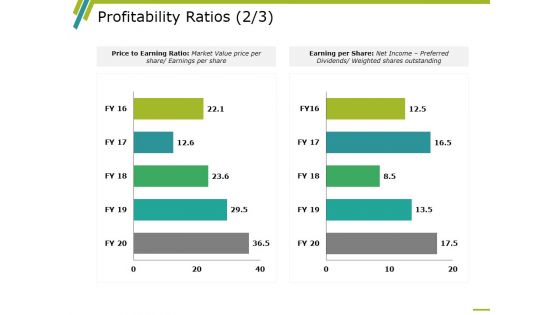
Profitability Ratios Template 3 Ppt PowerPoint Presentation Inspiration Backgrounds
This is a profitability ratios template 3 ppt powerpoint presentation inspiration backgrounds. This is a two stage process. The stages in this process are business, marketing, graph, price to earning ratio, earning per share.
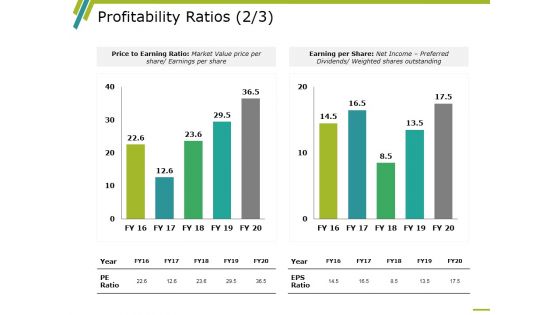
Profitability Ratios Template 4 Ppt PowerPoint Presentation Infographics Rules
This is a profitability ratios template 4 ppt powerpoint presentation infographics rules. This is a two stage process. The stages in this process are business, marketing, graph, price to earning ratio, earning per share.
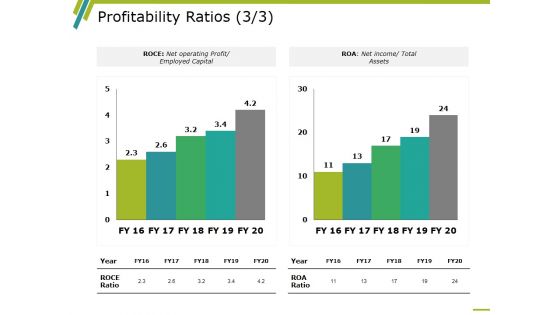
Profitability Ratios Template 6 Ppt PowerPoint Presentation Design Ideas
This is a profitability ratios template 6 ppt powerpoint presentation design ideas. This is a two stage process. The stages in this process are business, marketing, graph, roce, roa.
Stacked Bar Template 1 Ppt PowerPoint Presentation Icon Portfolio
This is a stacked bar template 1 ppt powerpoint presentation icon portfolio. This is a two stage process. The stages in this process are business, marketing, finance, graph, strategy.
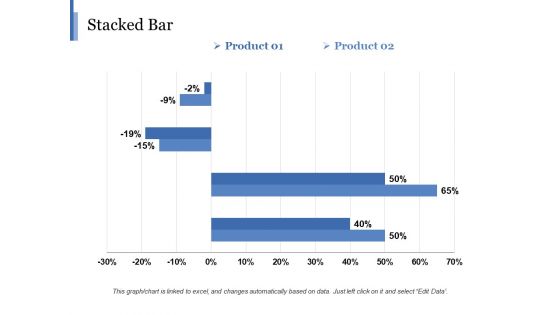
Stacked Bar Template 2 Ppt PowerPoint Presentation Gallery Background
This is a stacked bar template 2 ppt powerpoint presentation gallery background. This is a two stage process. The stages in this process are business, marketing, finance, graph, strategy, percentage.
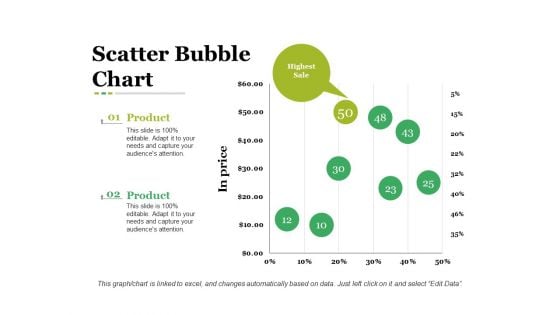
Scatter Bubble Chart Ppt PowerPoint Presentation Infographic Template Graphic Images
This is a scatter bubble chart ppt powerpoint presentation infographic template graphic images. This is a two stage process. The stages in this process are business, in price, bubble chart, marketing, strategy.
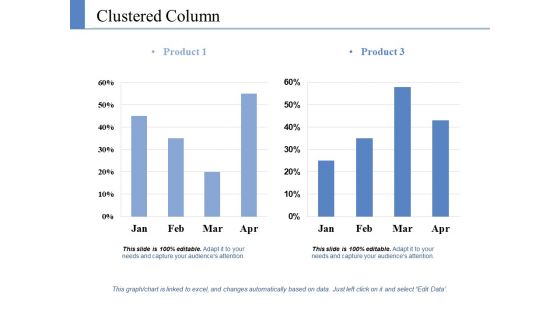
Clustered Column Ppt PowerPoint Presentation Pictures Graphics Template
This is a clustered column ppt powerpoint presentation pictures graphics template. This is a two stage process. The stages in this process are product, growth, success, business, bar graph.
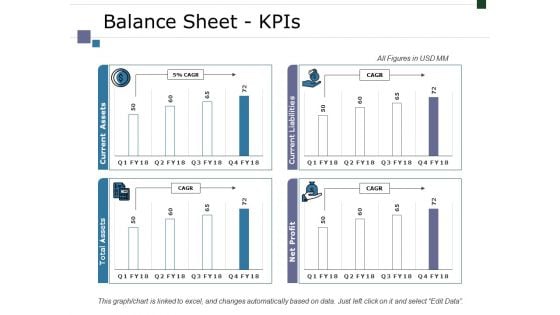
Balance Sheet Kpis Ppt PowerPoint Presentation Infographic Template Designs
This is a balance sheet kpis ppt powerpoint presentation infographic template designs. This is a four stage process. The stages in this process are business, marketing, finance, graph, strategy.
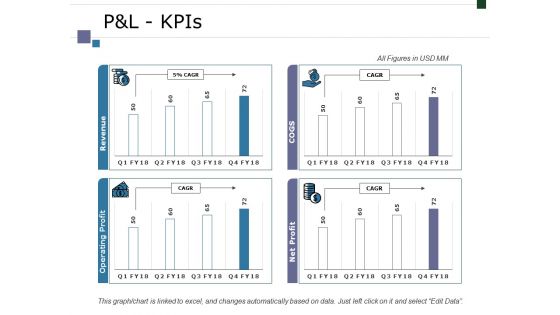
Pandl Kpis Ppt PowerPoint Presentation Infographic Template Graphics Tutorials
This is a pandl kpis ppt powerpoint presentation infographic template graphics tutorials. This is a four stage process. The stages in this process are business, marketing, finance, graph, strategy.
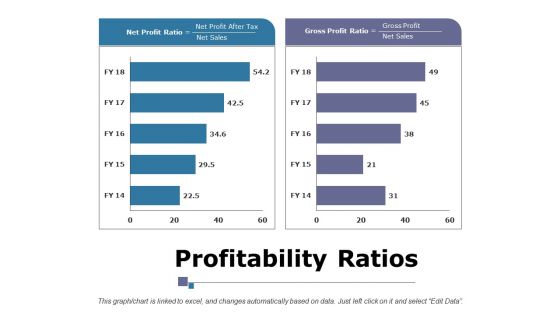
Profitability Ratios Ppt PowerPoint Presentation Infographic Template Portrait
This is a profitability ratios ppt powerpoint presentation infographic template portrait. This is a two stage process. The stages in this process are business, marketing, finance, net profit ratio, gross profit ratio.
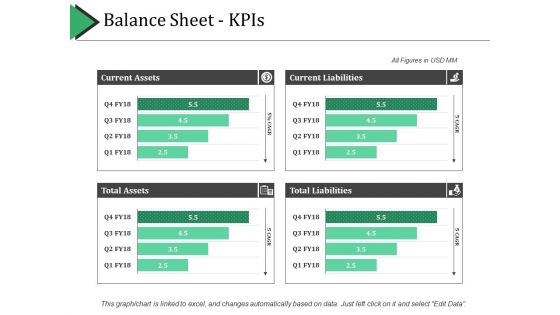
Balance Sheet Kpis Template 1 Ppt PowerPoint Presentation Pictures Grid
This is a balance sheet kpis template 1 ppt powerpoint presentation pictures grid. This is a four stage process. The stages in this process are current assets, current liabilities, total assets, total liabilities.
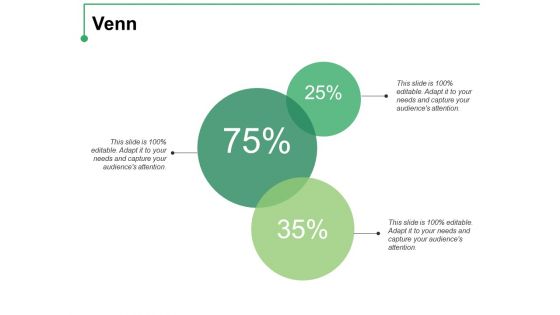
Venn Ppt PowerPoint Presentation Infographic Template Graphics Example
This is a venn ppt powerpoint presentation infographic template graphics example. This is a three stage process. The stages in this process are venn diagram, intersection, icons, strategy, business.
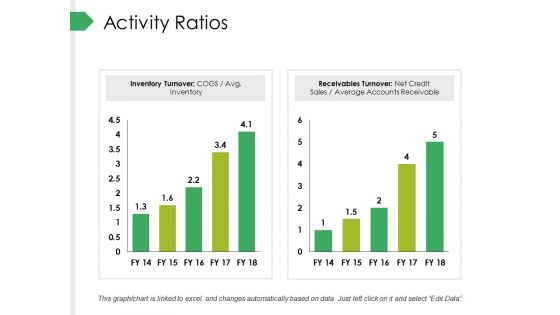
Activity Ratios Ppt PowerPoint Presentation Styles Infographic Template
This is a activity ratios ppt powerpoint presentation styles infographic template. This is a two stage process. The stages in this process are inventory turnover, receivables turnover, business, marketing, finance.
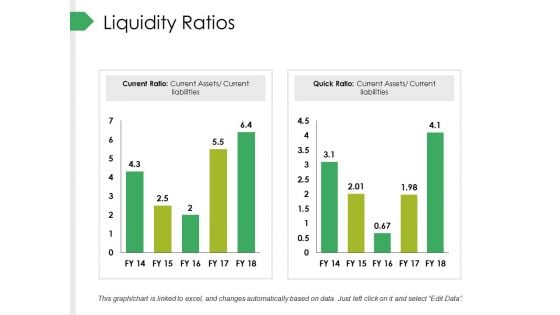
Liquidity Ratios Ppt PowerPoint Presentation Infographic Template Ideas
This is a liquidity ratios ppt powerpoint presentation infographic template ideas. This is a two stage process. The stages in this process are business, marketing, current ratio, quick ratio, finance.
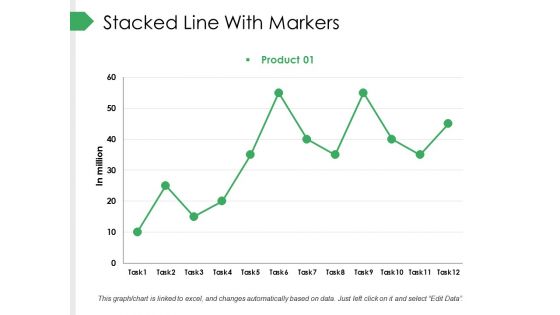
Stacked Line With Markers Ppt PowerPoint Presentation Pictures Design Templates
This is a stacked line with markers ppt powerpoint presentation pictures design templates. This is a one stage process. The stages in this process are business, marketing, finance, in million, graph.
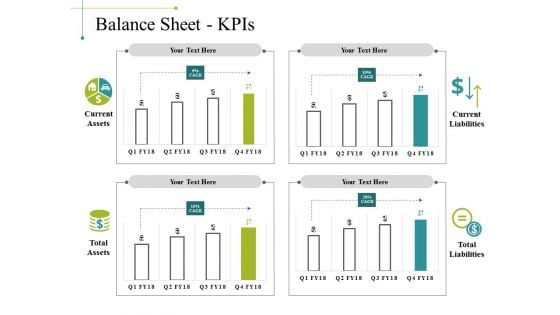
Balance Sheet Kpis Template 1 Ppt PowerPoint Presentation Show Inspiration
This is a balance sheet kpis template 1 ppt powerpoint presentation show inspiration. This is a four stage process. The stages in this process are business, marketing, graph, current liabilities, total liabilities.
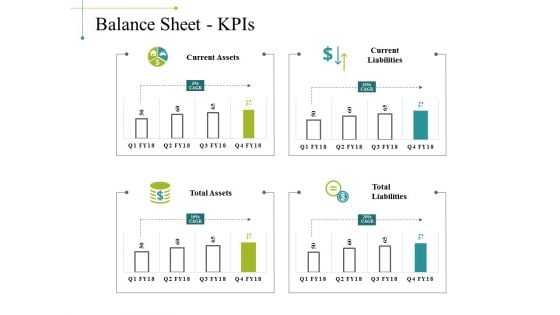
Balance Sheet Kpis Template 2 Ppt PowerPoint Presentation Gallery Example
This is a balance sheet kpis template 2 ppt powerpoint presentation gallery example. This is a four stage process. The stages in this process are business, marketing, graph, current liabilities, total liabilities.
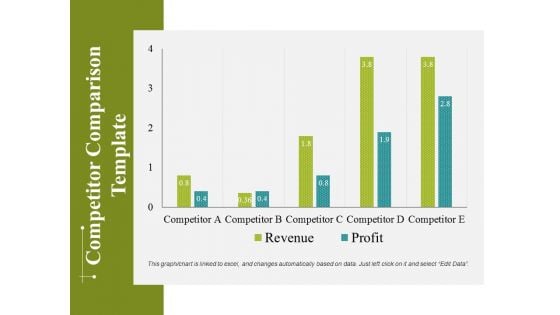
Competitor Comparison Template 2 Ppt PowerPoint Presentation Infographics Objects
This is a competitor comparison template 2 ppt powerpoint presentation infographics objects. This is a five stage process. The stages in this process are business, marketing, graph, finance, strategy.
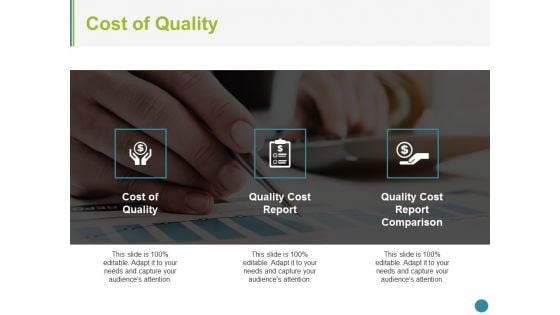
Cost Of Quality Template 1 Ppt PowerPoint Presentation Styles Example
This is a Cost Of Quality Template 1 Ppt PowerPoint Presentation Styles Example. This is a three stage process. The stages in this process are cost of quality, quality cost report, quality cost report comparison.
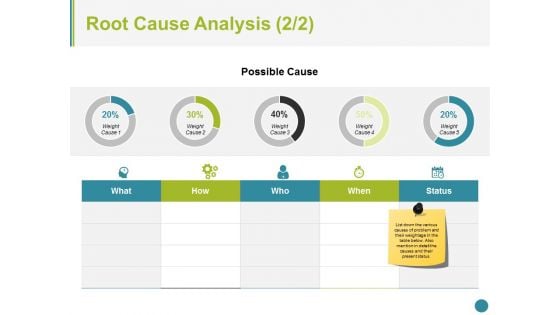
Root Cause Analysis Template 2 Ppt PowerPoint Presentation Styles Graphics
This is a root cause analysis template 2 ppt powerpoint presentation styles graphics. This is a five stage process. The stages in this process are business, icons, marketing, strategy, process.
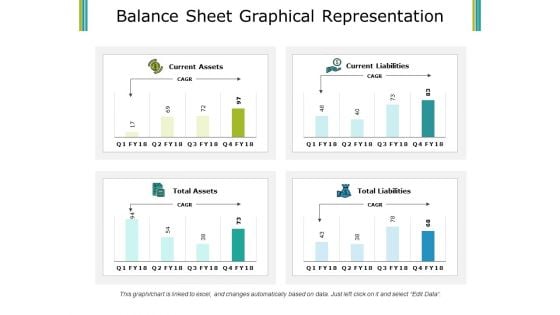
Balance Sheet Graphical Representation Ppt PowerPoint Presentation Gallery Design Templates
This is a balance sheet graphical representation ppt powerpoint presentation gallery design templates. This is a four stage process. The stages in this process are current assets, current liabilities, total assets, total liabilities.
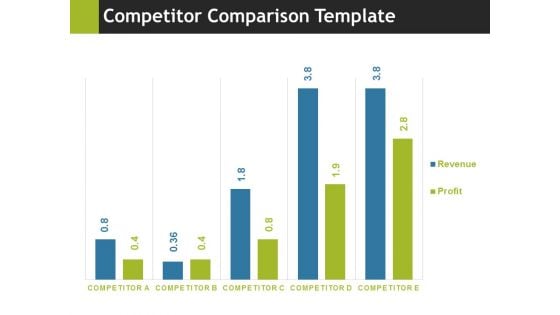
Competitor Comparison Template 2 Ppt PowerPoint Presentation Inspiration Images
This is a competitor comparison template 2 ppt powerpoint presentation inspiration images. This is a five stage process. The stages in this process are business, marketing, graph, finance, strategy.
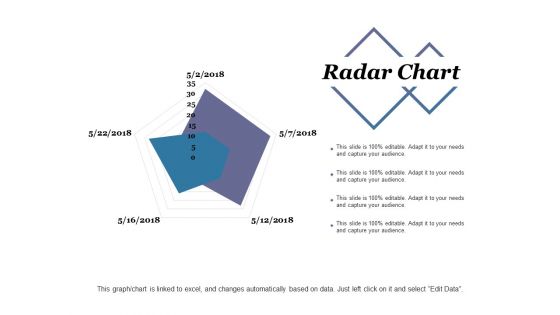
Radar Chart Ppt PowerPoint Presentation Infographic Template Sample
This is a radar chart ppt powerpoint presentation infographic template sample. This is a two stage process. The stages in this process are radar chart, finance, marketing, strategy, analysis.
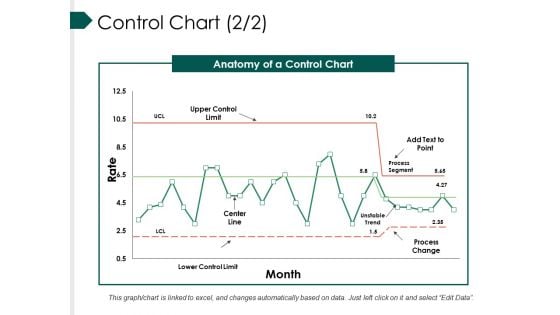
Control Chart Template Ppt PowerPoint Presentation Slides Smartart
This is a control chart template ppt powerpoint presentation slides smartart. This is a two stage process. The stages in this process are anatomy of a control chart, upper control limit, add text to point, process change, lower control limit.
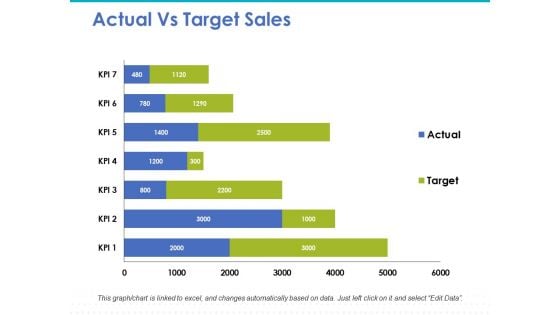
Actual Vs Target Sales Ppt PowerPoint Presentation Slides Template
This is a actual vs target sales ppt powerpoint presentation slides template. This is a seven stage process. The stages in this process are bar chart, marketing, strategy, finance, planning.
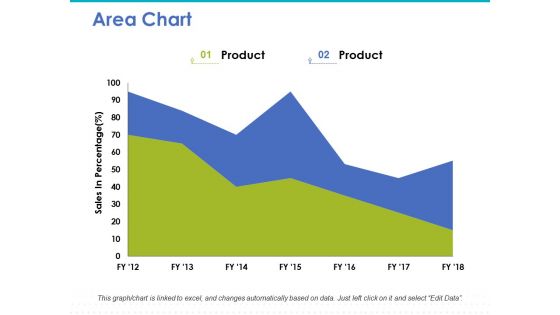
Area Chart Ppt PowerPoint Presentation Infographic Template Inspiration
This is a area chart ppt powerpoint presentation infographic template inspiration. This is a two stage process. The stages in this process are area chart, marketing, strategy, finance, planning.
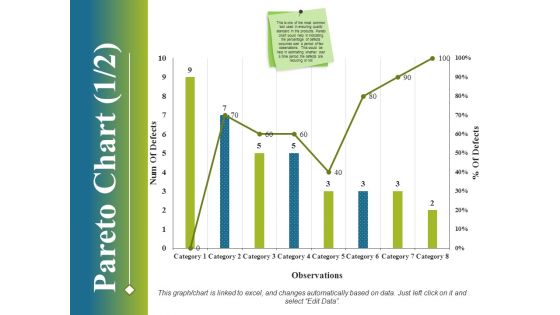
Pareto Chart Template 1 Ppt PowerPoint Presentation File Ideas
This is a pareto chart template 1 ppt powerpoint presentation file ideas. This is a eight stage process. The stages in this process are business, finance, marketing, strategy, analysis.

Area Chart Ppt PowerPoint Presentation Styles Design Templates
This is a area chart ppt powerpoint presentation styles design templates. This is a two stage process. The stages in this process are area chart, analysis, business, marketing, strategy.
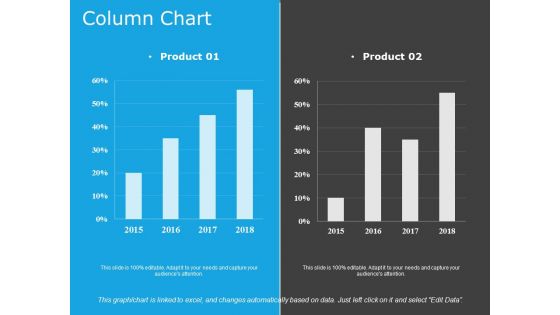
Column Chart Template 1 Ppt PowerPoint Presentation Portfolio Format
This is a column chart template 1 ppt powerpoint presentation portfolio format. This is a two stage process. The stages in this process are column chart, finance, marketing, strategy, business.
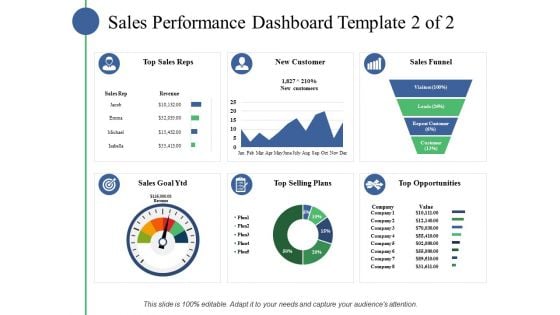
Sales Performance Dashboard Template Ppt PowerPoint Presentation Slides Example File
This is a sales performance dashboard template ppt powerpoint presentation slides example file. This is a eight stage process. The stages in this process are business, marketing, strategy, finance, planning.
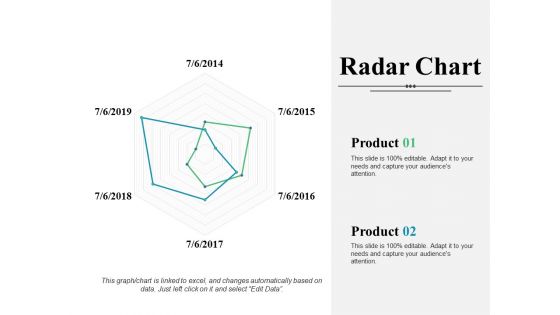
Radar Chart Ppt PowerPoint Presentation Infographic Template Introduction
This is a radar chart ppt powerpoint presentation infographic template introduction. This is a two stage process. The stages in this process are radar chart, finance, marketing, strategy, analysis, business.

Area Chart Ppt PowerPoint Presentation Infographic Template Designs
This is a area chart ppt powerpoint presentation infographic template designs. This is a two stage process. The stages in this process are area chart, finance, marketing, strategy, business.
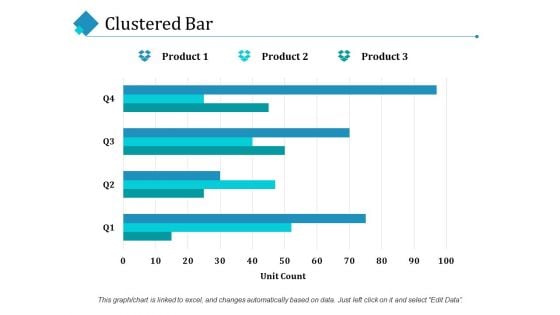
Clustered Bar Ppt PowerPoint Presentation Infographic Template Mockup
This is a clustered bar ppt powerpoint presentation infographic template mockup. This is a four stage process. The stages in this process are clustered bar, finance, marketing, planning, business.
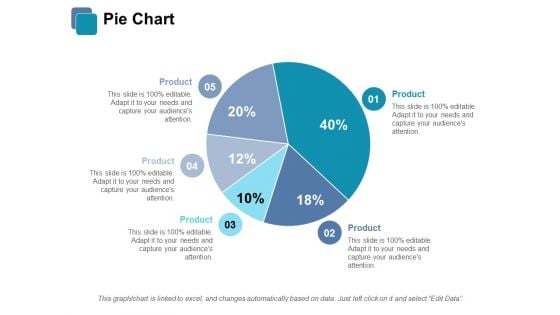
Pie Chart Ppt PowerPoint Presentation Infographic Template Vector
This is a pie chart ppt powerpoint presentation infographic template vector. This is a five stage process. The stages in this process are pie chart, finance, analysis, investment, business.

Clustered Column Ppt PowerPoint Presentation Ideas Infographic Template
This is a clustered column ppt powerpoint presentation ideas infographic template. This is a two stage process. The stages in this process are clustered column, growth, finance, business, product.
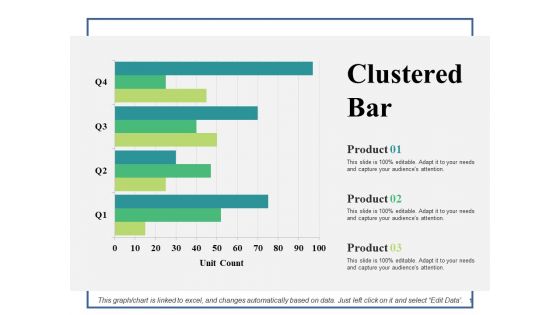
Clustered Bar Ppt PowerPoint Presentation Infographic Template Infographics
This is a clustered bar ppt powerpoint presentation infographic template infographics. This is a three stage process. The stages in this process are clustered bar, finance, planning, management, marketing.
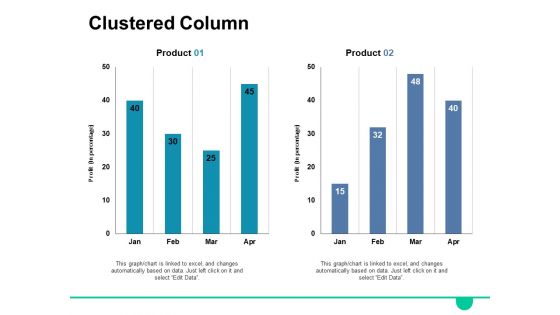
Clustered Column Ppt PowerPoint Presentation Infographic Template Background Images
This is a clustered column ppt powerpoint presentation infographic template background images. This is a eight stage process. The stages in this process are clustered column, finance, planning, marketing, strategy.
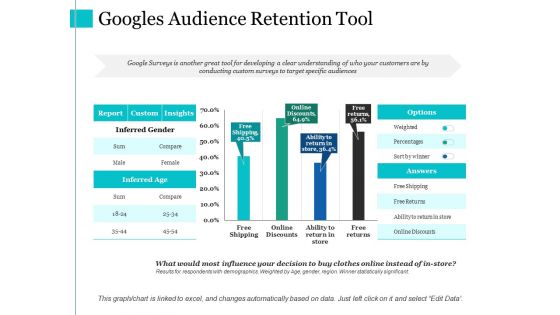
Googles Audience Retention Tool Ppt PowerPoint Presentation Infographic Template Infographics
This is a googles audience retention tool ppt powerpoint presentation infographic template infographics. This is a four stage process. The stages in this process are free shipping, online discounts, free returns, inferred age, custom.
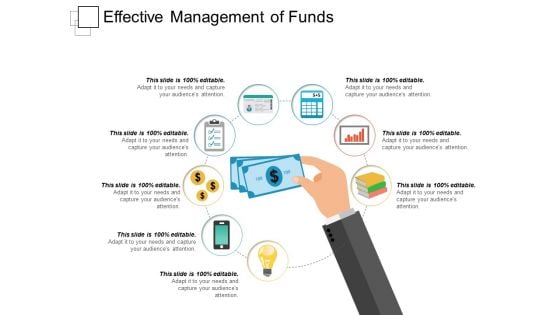
Effective Management Of Funds Ppt PowerPoint Presentation Infographic Template Model
This is a effective management of funds ppt powerpoint presentation infographic template model. This is a eight stage process. The stages in this process are support, assistance, hand holding.
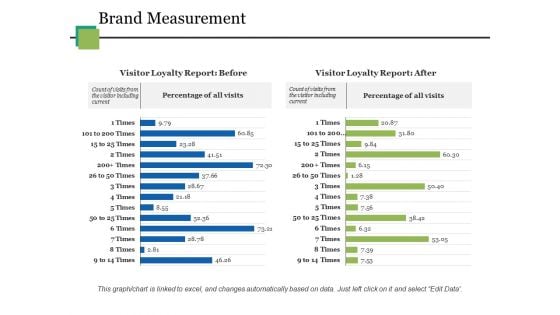
Brand Measurement Ppt PowerPoint Presentation Ideas Design Templates
This is a brand measurement ppt powerpoint presentation ideas design templates. This is a two stage process. The stages in this process are brand measurement, business, planning, marketing, management.


 Continue with Email

 Home
Home


