Financial Summary
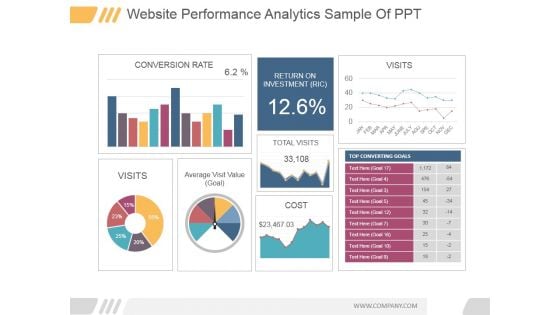
Website Performance Analytics Ppt PowerPoint Presentation Show
This is a website performance analytics ppt powerpoint presentation show. This is a three stage process. The stages in this process are conversion rate, visits, average visit value goal, return on investment ric, total visits, cost.
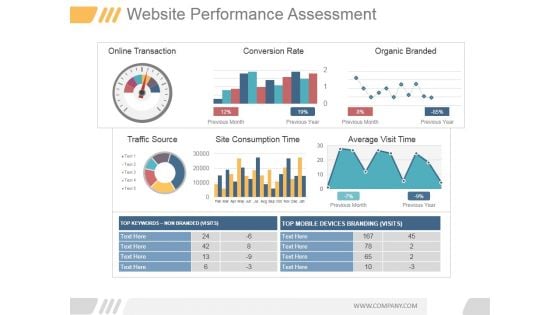
Website Performance Assessment Ppt PowerPoint Presentation Model
This is a website performance assessment ppt powerpoint presentation model. This is a three stage process. The stages in this process are online transaction, conversion rate, organic branded, traffic, source, site consumption time.
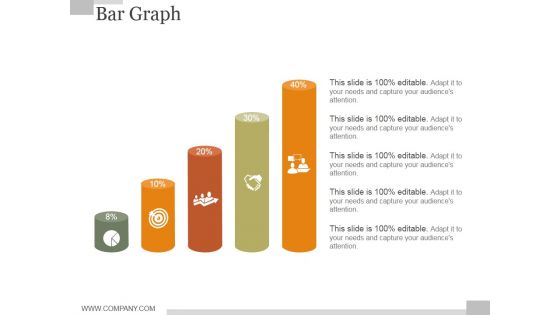
Bar Graph Ppt PowerPoint Presentation Inspiration
This is a bar graph ppt powerpoint presentation inspiration. This is a five stage process. The stages in this process are bar graph, finance, marketing, strategy, investment, analysis, business, success.
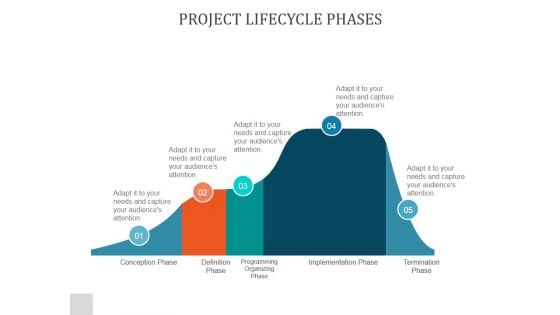
Project Lifecycle Phases Ppt PowerPoint Presentation Information
This is a project lifecycle phases ppt powerpoint presentation information. This is a five stage process. The stages in this process are conception phase, definition phase , programming organizing phase, implementation phase, termination phase.
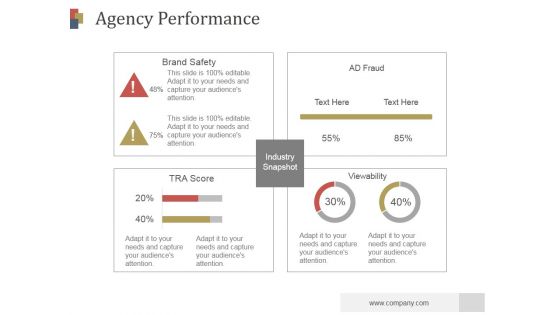
Agency Performance Ppt PowerPoint Presentation Model
This is a agency performance ppt powerpoint presentation model. This is a four stage process. The stages in this process are brand safety, ad fraud, tra score, view ability.
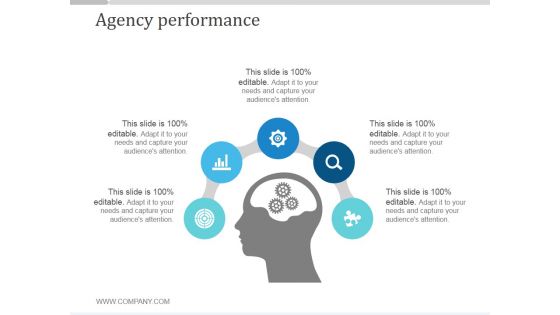
Agency Performance Slide2 Ppt PowerPoint Presentation Deck
This is a agency performance slide2 ppt powerpoint presentation deck. This is a four stage process. The stages in this process are tra store, ad fraud, brand safety, industry snapshot, viewability.
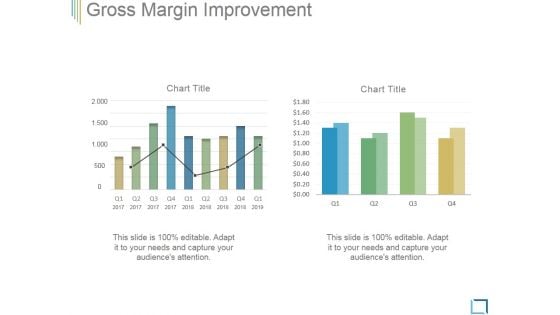
Gross Margin Improvement Ppt PowerPoint Presentation Guidelines
This is a gross margin improvement ppt powerpoint presentation guidelines. This is a two stage process. The stages in this process are business, bar graph, investment, marketing, strategy, success.
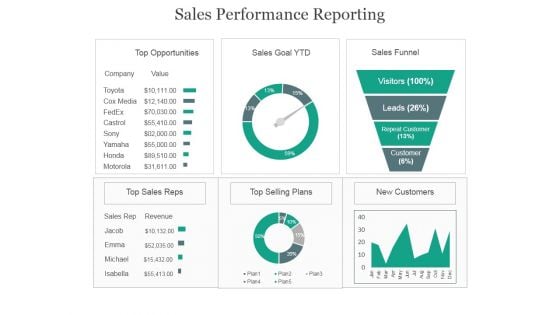
Sales Performance Reporting Ppt PowerPoint Presentation Model
This is a sales performance reporting ppt powerpoint presentation model. This is a six stage process. The stages in this process are top opportunities, sales goal ytd, sales funnel, top sales reps, top selling plans, new customers.
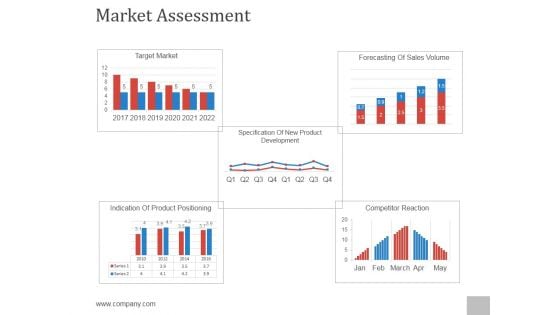
Market Assessment Ppt PowerPoint Presentation Files
This is a market assessment ppt powerpoint presentation files. This is a five stage process. The stages in this process are target market, forecasting of sales volume, indication of product positioning, competitor reaction, specification of new product development.
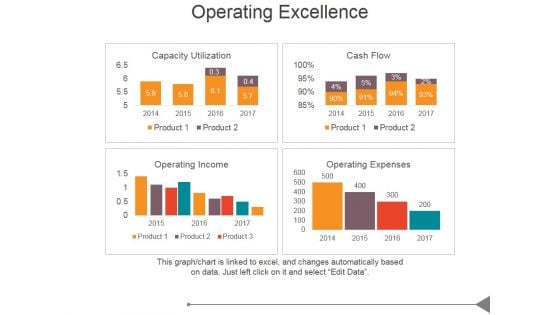
Operating Excellence Ppt PowerPoint Presentation Show
This is a operating excellence ppt powerpoint presentation show. This is a four stage process. The stages in this process are capacity utilization, cash flow, operating income, operating expenses.

Adoption Curve Ppt PowerPoint Presentation Clipart
This is a adoption curve ppt powerpoint presentation clipart. This is a five stage process. The stages in this process are innovators, early adopters, early majority, late majority, laggards.
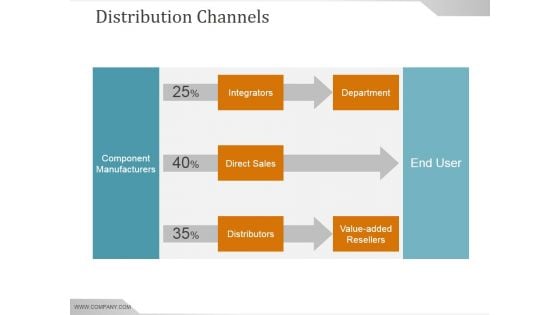
Distribution Channels Ppt PowerPoint Presentation Graphics
This is a distribution channels ppt powerpoint presentation graphics. This is a three stage process. The stages in this process are integrators, direct sales, distributors, value added, resellers, department, component manufacturers, end user.
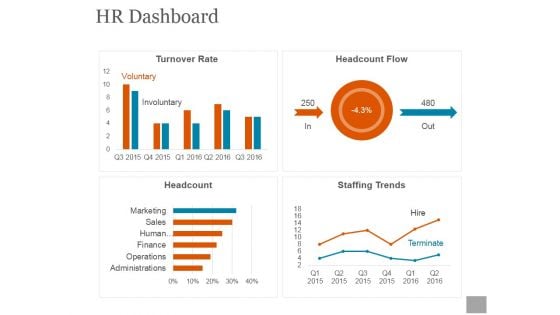
Hr Dashboard Ppt PowerPoint Presentation Shapes
This is a hr dashboard ppt powerpoint presentation shapes. This is a four stage process. The stages in this process are total employees, key metrics, employee churn, open positions by divisions.
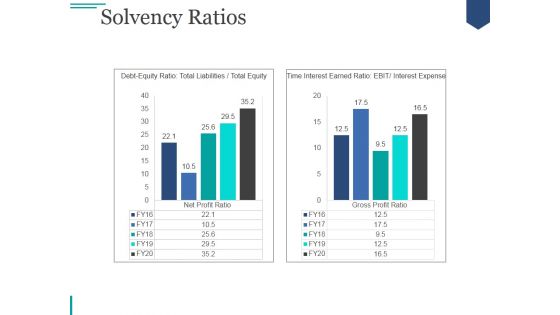
Solvency Ratios Ppt PowerPoint Presentation Example 2015
This is a solvency ratios ppt powerpoint presentation example 2015. This is a two stage process. The stages in this process are debt equity ratio, total liabilities, total equity.
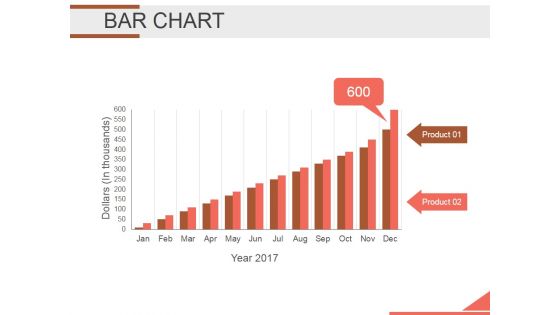
Bar Chart Ppt PowerPoint Presentation Background Designs
This is a bar chart ppt powerpoint presentation background designs. This is a twelve stage process. The stages in this process are bar graph, finance, marketing, strategy, analysis, investment.
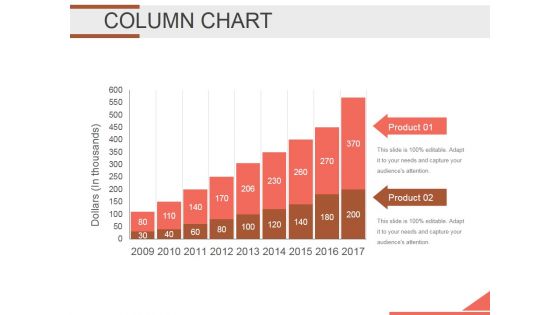
Column Chart Ppt PowerPoint Presentation Background Designs
This is a column chart ppt powerpoint presentation background designs. This is a two stage process. The stages in this process are bar graph, finance, marketing, strategy, analysis, business.
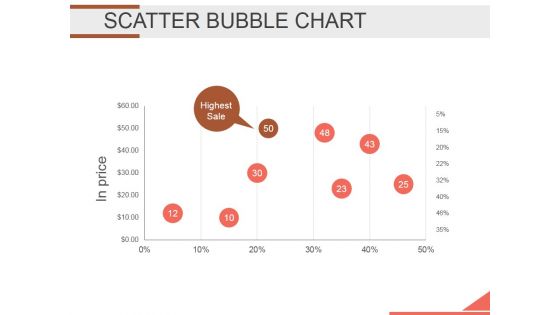
Scatter Bubble Chart Ppt PowerPoint Presentation Backgrounds
This is a scatter bubble chart ppt powerpoint presentation backgrounds. This is a one stage process. The stages in this process are bubble chart, finance, marketing, analysis, strategy, business.
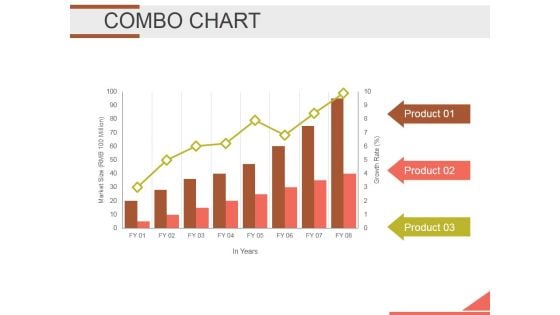
Combo Chart Ppt PowerPoint Presentation Infographics Infographics
This is a combo chart ppt powerpoint presentation infographics infographics. This is a three stage process. The stages in this process are bar graph, growth, finance, marketing, strategy, business.
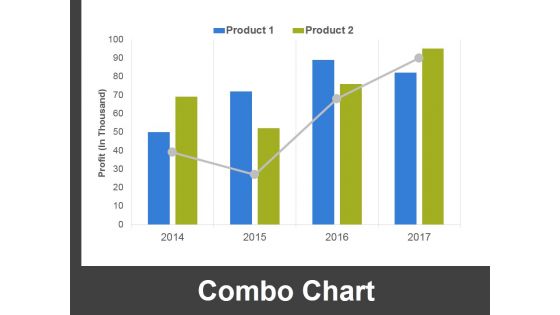
Combo Chart Ppt PowerPoint Presentation Ideas Outfit
This is a combo chart ppt powerpoint presentation ideas outfit. This is a four stage process. The stages in this process are combo chart, finance, analysis, marketing, strategy, business.
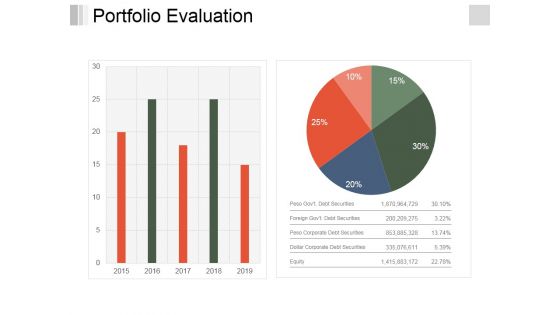
Portfolio Evaluation Ppt PowerPoint Presentation Infographics Objects
This is a portfolio evaluation ppt powerpoint presentation infographics objects. This is a two stage process. The stages in this process are business, finance, bar graph, pie chart, marketing, analysis, investment.
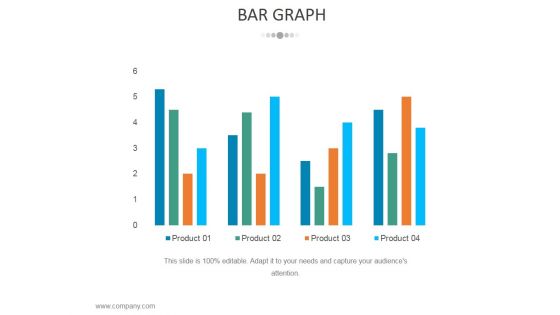
Bar Graph Ppt PowerPoint Presentation Ideas Sample
This is a bar graph ppt powerpoint presentation ideas sample. This is a four stage process. The stages in this process are business, strategy, marketing, analysis, chart and graph, bar graph.
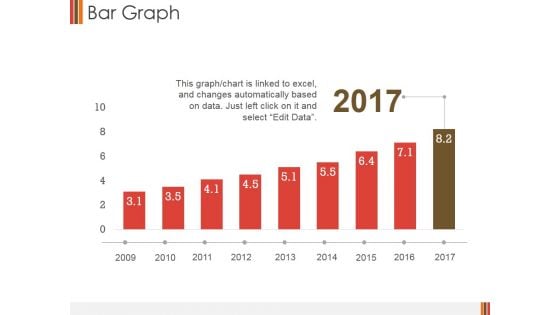
Bar Graph Ppt PowerPoint Presentation Show Topics
This is a bar graph ppt powerpoint presentation show topics. This is a nine stage process. The stages in this process are business, finance, marketing, strategy, bar graph, growth.
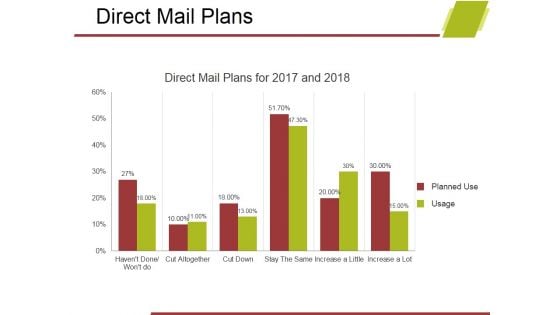
Direct Mail Plans Ppt PowerPoint Presentation Good
This is a direct mail plans ppt powerpoint presentation good. This is a two stage process. The stages in this process are planned use, usage, direct mail plans, marketing, business.
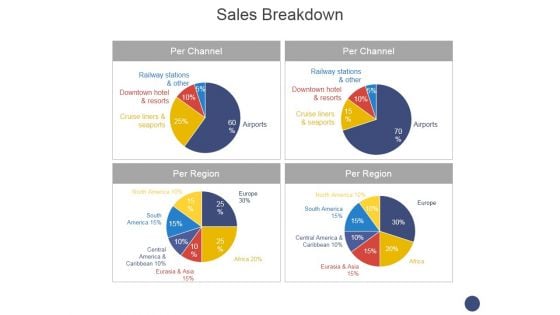
Sales Breakdown Ppt PowerPoint Presentation Ideas Show
This is a sales breakdown ppt powerpoint presentation ideas show. This is a four stage process. The stages in this process are railway stations and other, downtown hotel and resorts, cruise liners and seaports, airports.
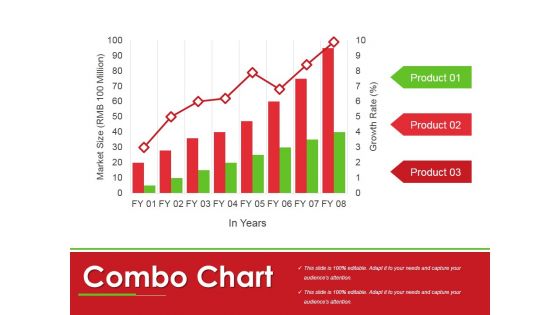
Combo Chart Ppt PowerPoint Presentation Portfolio Themes
This is a combo chart ppt powerpoint presentation portfolio themes. This is a three stage process. The stages in this process are market size, product, management, finance, chart, marketing.
Bar Chart Ppt PowerPoint Presentation Portfolio Icons
This is a bar chart ppt powerpoint presentation portfolio icons. This is a seven stage process. The stages in this process are in years, in percentage, finance, business marketing.
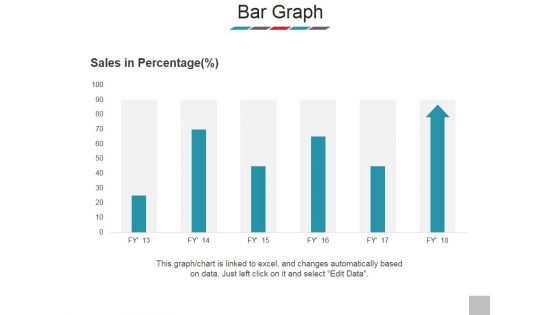
Bar Graph Ppt PowerPoint Presentation Model Clipart
This is a bar graph ppt powerpoint presentation model clipart. This is a six stage process. The stages in this process are sales in percentage, product, bar graph, business, marketing.
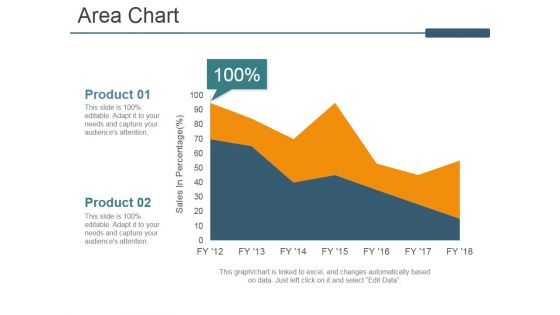
Area Chart Ppt PowerPoint Presentation Inspiration Rules
This is a area chart ppt powerpoint presentation inspiration rules. This is a two stage process. The stages in this process are area chart, business, marketing, sales in percentage, product.
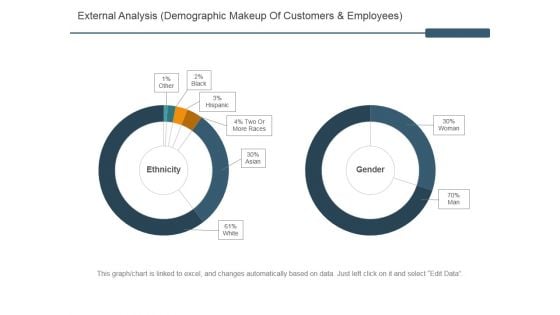
External Analysis Ppt PowerPoint Presentation Infographics Information
This is a external analysis ppt powerpoint presentation infographics information. This is a seven stage process. The stages in this process are education, police, hm forces, local government, civil service.
Distribution Growth Ppt PowerPoint Presentation Slides Icons
This is a distribution growth ppt powerpoint presentation slides icons. This is a six stage process. The stages in this process are business, bar graph, finance, marketing, strategy, growth.
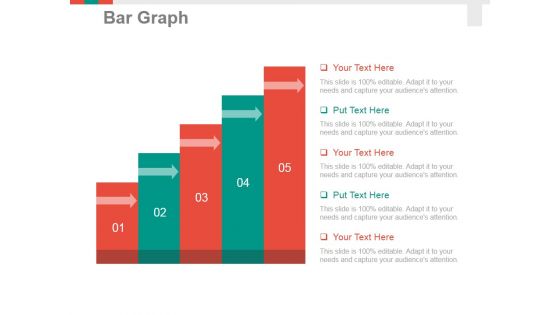
Bar Graph Ppt PowerPoint Presentation Pictures Tips
This is a bar graph ppt powerpoint presentation pictures tips. This is a five stage process. The stages in this process are bar graph, finance, marketing, strategy, analysis, business.
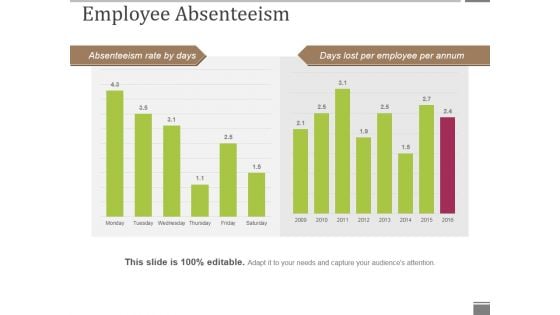
Employee Absenteeism Ppt PowerPoint Presentation Styles Show
This is a employee absenteeism ppt powerpoint presentation styles show. This is a two stage process. The stages in this process are absenteeism rate by days, days lost per employee per annum, business, planning, management.
Employee Turnover Ppt PowerPoint Presentation Gallery Icons
This is a employee turnover ppt powerpoint presentation gallery icons. This is a one stage process. The stages in this process are turnover, rate, number of employee separations during the year, total number of employees during the year.
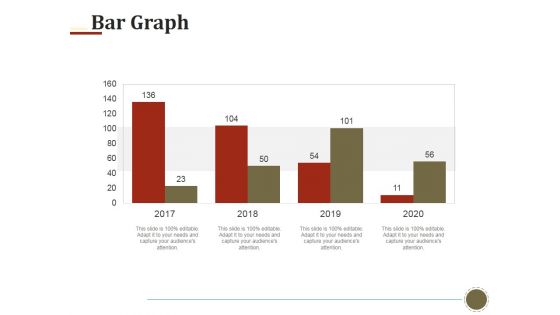
Bar Graph Ppt PowerPoint Presentation Styles Model
This is a bar graph ppt powerpoint presentation styles model. This is a four stage process. The stages in this process are bar graph, finance, marketing, analysis, investment, business.
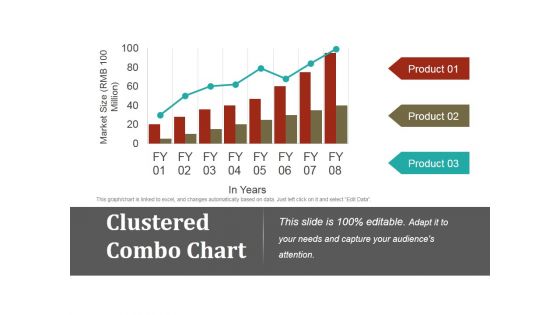
Clustered Combo Chart Ppt PowerPoint Presentation Show
This is a clustered combo chart ppt powerpoint presentation show. This is a eigth stage process. The stages in this process are clustered combo chart, finance, marketing, strategy, investment, business.
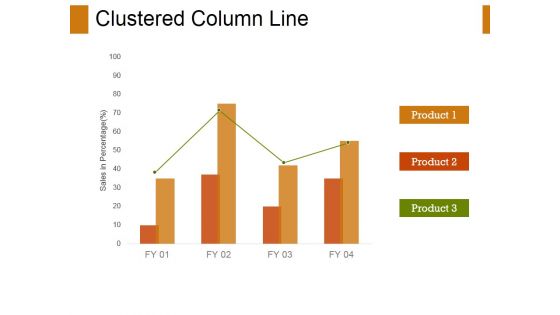
Clustered Column-Line Ppt PowerPoint Presentation Ideas Diagrams
This is a clustered column-line ppt powerpoint presentation ideas diagrams. This is a three stage process. The stages in this process are clustered column line, business, finance, marketing, strategy.
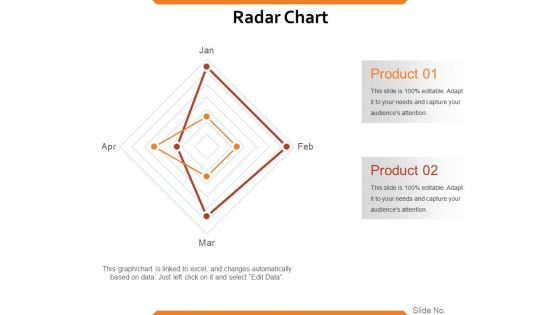
Radar Chart Ppt PowerPoint Presentation Gallery Skills
This is a radar chart ppt powerpoint presentation gallery skills. This is a two stage process. The stages in this process are product, radar chart, jan, feb, mar, apr.
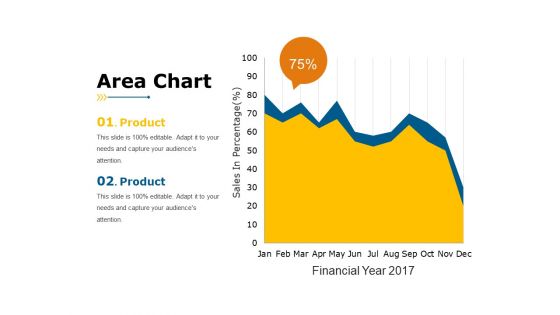
Area Chart Ppt PowerPoint Presentation Slides Rules
This is a area chart ppt powerpoint presentation slides rules. This is a two stage process. The stages in this process are sales in percentage, business, marketing, product, finance.
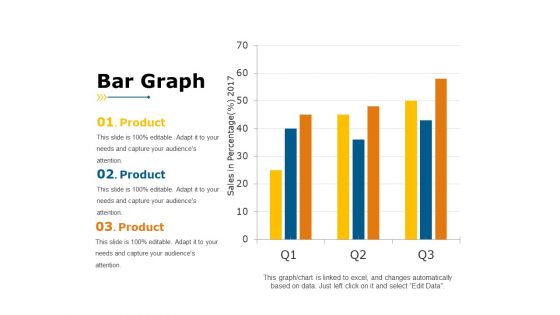
Bar Graph Ppt PowerPoint Presentation Portfolio Example
This is a bar graph ppt powerpoint presentation portfolio example. This is a three stage process. The stages in this process are sales in percentage, year, business, product, business, graph.
Bubble Chart Ppt PowerPoint Presentation Icon Slides
This is a bubble chart ppt powerpoint presentation icon slides. This is a three stage process. The stages in this process are product, finance, business, marketing, bubble chart .

Marketing Assessment Ppt PowerPoint Presentation Gallery Guidelines
This is a marketing assessment ppt powerpoint presentation gallery guidelines. This is a five stage process. The stages in this process are target market, forecasting of sales volume, indication of product positioning,, competitor reaction.
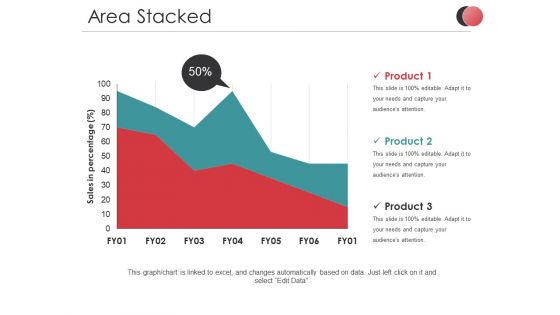
Area Stacked Ppt PowerPoint Presentation Diagram Images
This is a area stacked ppt powerpoint presentation diagram images. This is a two stage process. The stages in this process are sales in percentage, product, business, marketing, finance.
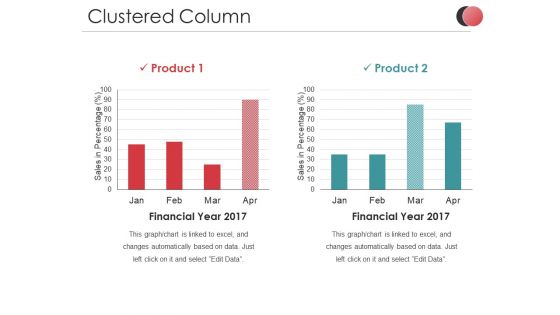
Clustered Column Ppt PowerPoint Presentation Slides Ideas
This is a clustered column ppt powerpoint presentation slides ideas. This is a two stage process. The stages in this process are sales in percentage, business, marketing, finance, graph.
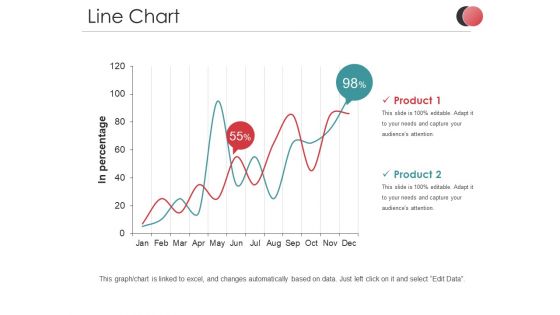
Line Chart Ppt PowerPoint Presentation Professional Ideas
This is a line chart ppt powerpoint presentation professional ideas. This is a two stage process. The stages in this process are in percentage, product, business, marketing, finance, percentage.
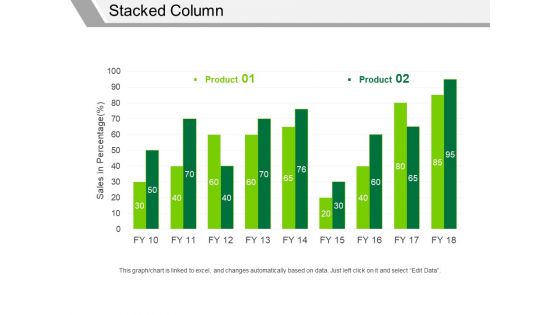
Stacked Column Ppt PowerPoint Presentation Infographics Samples
This is a stacked column ppt powerpoint presentation infographics samples. This is a two stage process. The stages in this process are product, sales in percentage, business, marketing, graph.
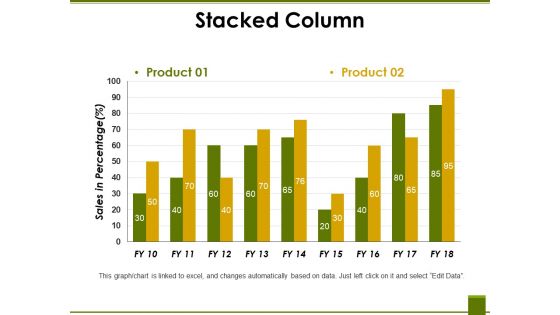
Stacked Column Ppt PowerPoint Presentation Professional Vector
This is a stacked column ppt powerpoint presentation professional vector. This is a two stage process. The stages in this process are product, sales in percentage, business, marketing, graph.
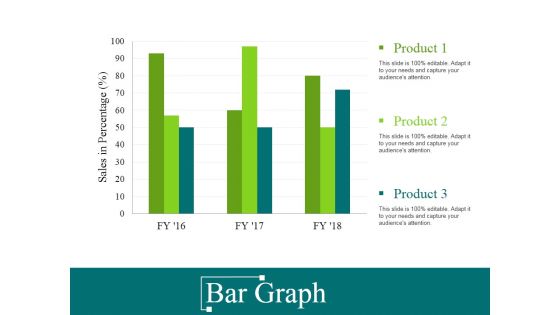
Bar Graph Ppt PowerPoint Presentation Gallery Grid
This is a bar graph ppt powerpoint presentation gallery grid. This is a three stage process. The stages in this process are sales in percentage, product, finance, business, marketing.
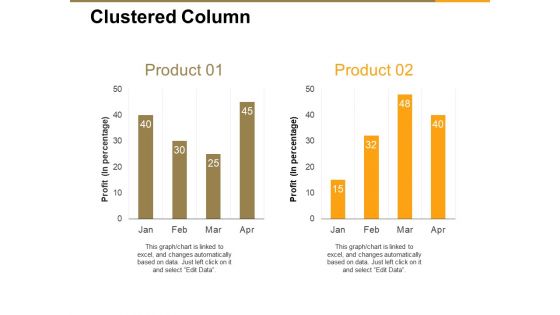
Clustered Column Ppt PowerPoint Presentation Inspiration Shapes
This is a clustered column ppt powerpoint presentation inspiration shapes. This is a two stage process. The stages in this process are profit in percentage, business, marketing, graph, finance.
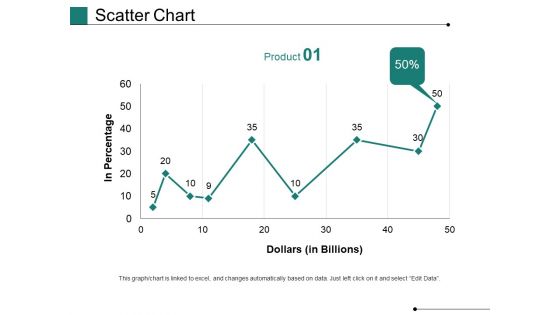
Scatter Chart Ppt PowerPoint Presentation Gallery Show
This is a scatter chart ppt powerpoint presentation gallery show. This is a one stage process. The stages in this process are in percentage, dollars, business, marketing, growth, graph.
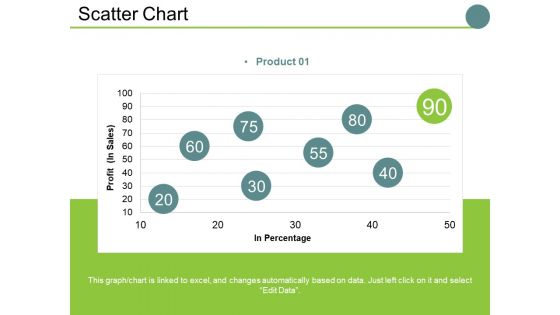
Scatter Chart Ppt PowerPoint Presentation Slides Examples
This is a scatter chart ppt powerpoint presentation slides examples. This is a one stage process. The stages in this process are profit , in percentage, business, marketing, finance, graph.
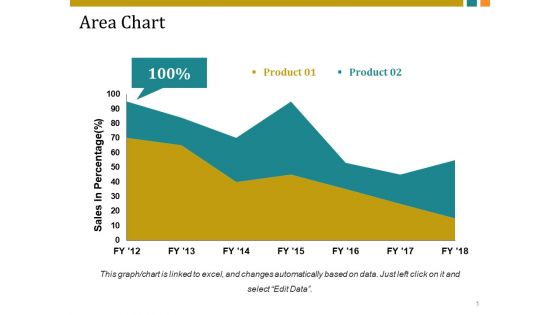
Area Chart Ppt PowerPoint Presentation Professional Brochure
This is a area chart ppt powerpoint presentation professional brochure. This is a two stage process. The stages in this process are sales in percentage, business, marketing, finance, graph.

Bar Chart Ppt PowerPoint Presentation Portfolio Diagrams
This is a bar chart ppt powerpoint presentation portfolio diagrams. This is a three stage process. The stages in this process are sales in percentage, business, marketing, graph, finance.
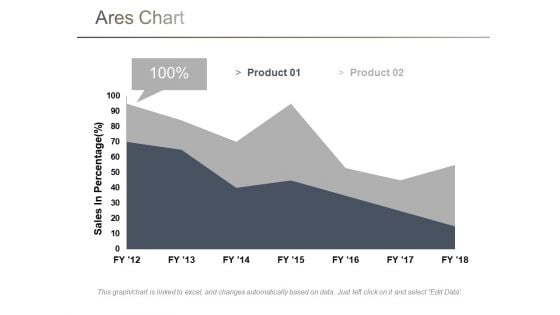
Area Chart Ppt PowerPoint Presentation Model Influencers
This is a area chart ppt powerpoint presentation model influencers. This is a two stage process. The stages in this process are sales in percentage, chart, business, marketing, finance.
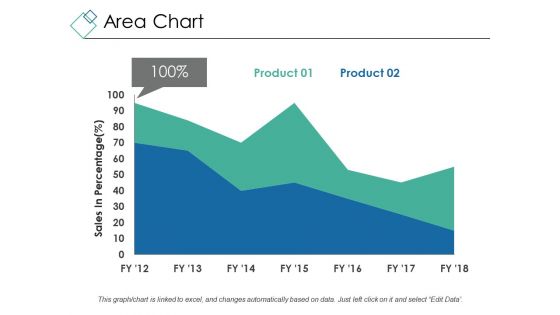
Area Chart Ppt PowerPoint Presentation Inspiration Demonstration
This is a area chart ppt powerpoint presentation inspiration demonstration. This is a two stage process. The stages in this process are sales in percentage, chart, percentage, business, marketing.
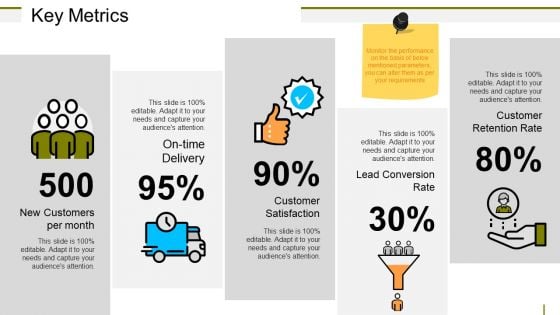
Key Metrics Ppt PowerPoint Presentation Model Portrait
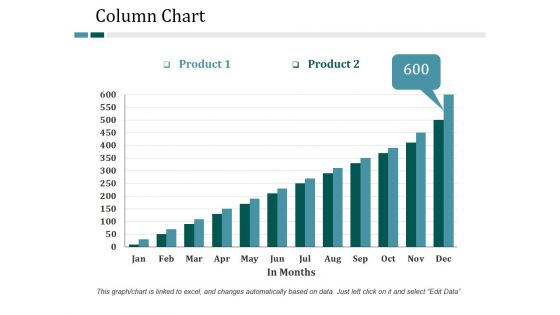
Column Chart Ppt PowerPoint Presentation File Show
This is a column chart ppt powerpoint presentation file show. This is a two stage process. The stages in this process are column chart, finance, marketing, growth, strategy, business.
Bar Chart Ppt PowerPoint Presentation Icon Introduction
This is a bar chart ppt powerpoint presentation icon introduction. This is a seven stage process. The stages in this process are in years, in percentage, business, marketing, graph.
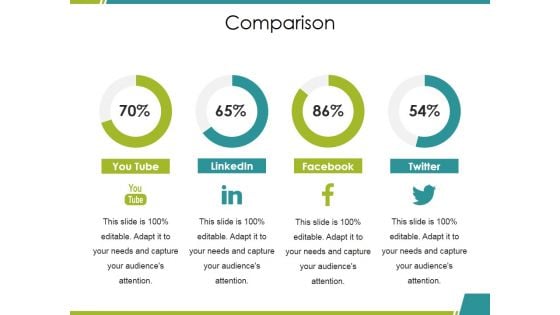
Comparison Ppt PowerPoint Presentation Styles Graphic Tips
This is a comparison ppt powerpoint presentation styles graphic tips. This is a four stage process. The stages in this process are you tube, linkedin, facebook, twitter, social media.
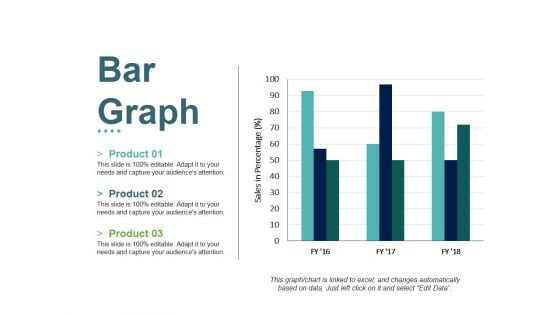
Bar Graph Ppt PowerPoint Presentation File Slides
This is a bar graph ppt powerpoint presentation file slides. This is a three stage process. The stages in this process are product, sales in percentage, bar graph, growth, success.
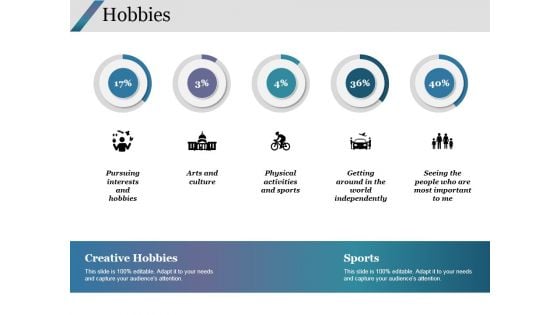
Hobbies Ppt PowerPoint Presentation Infographics Format
This is a hobbies ppt powerpoint presentation infographics format. This is a five stage process. The stages in this process are creative hobbies, sports, arts and culture, pursuing interests and hobbies, physical activities and sports.


 Continue with Email

 Home
Home


