Financial Summary
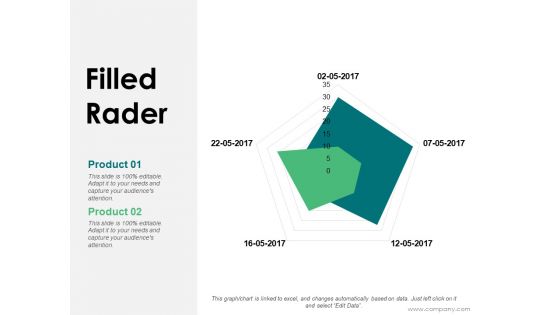
Filled Rader Ppt PowerPoint Presentation Visual Aids Example 2015
This is a filled rader ppt powerpoint presentation visual aids example 2015. This is a two stage process. The stages in this process are filled rader, finance, marketing, management, investment.
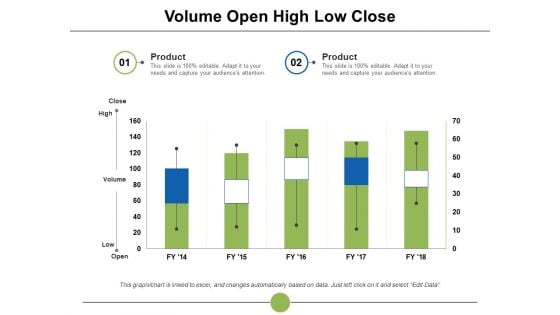
Volume Open High Low Close Ppt PowerPoint Presentation Slides Maker
This is a volume open high low close ppt powerpoint presentation slides maker. This is a two stage process. The stages in this process are volume, open, high, low, close, product.
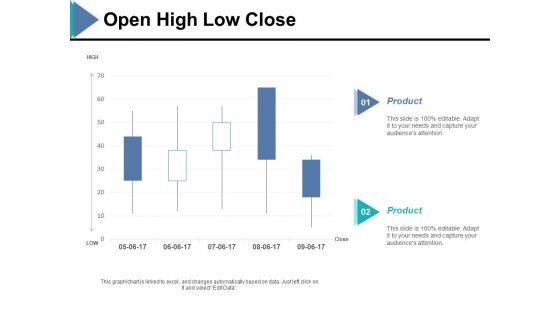
Open High Low Close Ppt PowerPoint Presentation Model Good
This is a open high low close ppt powerpoint presentation model good. This is a two stage process. The stages in this process are open, high, low, close, product.
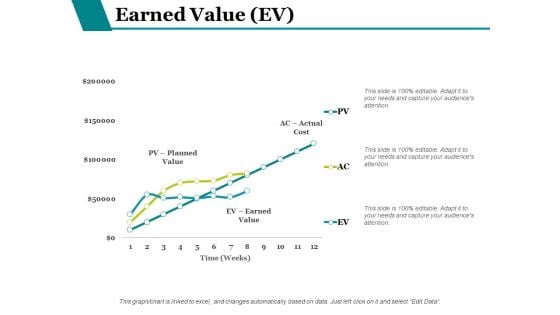
Earned Value Ev Ppt PowerPoint Presentation Inspiration Design Ideas
This is a earned value ev ppt powerpoint presentation inspiration design ideas. This is a three stage process. The stages in this process are earned value, finance, analysis, investment, business.
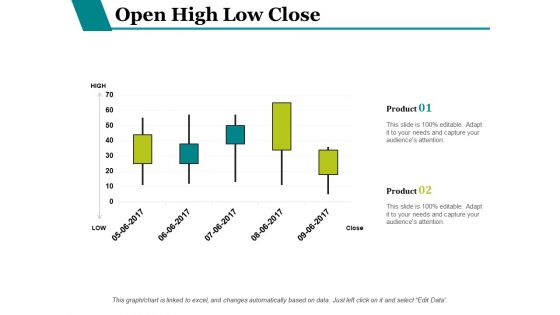
Open High Low Close Ppt PowerPoint Presentation Infographics Inspiration
This is a open high low close ppt powerpoint presentation infographics inspiration. This is a two stage process. The stages in this process are finance, analysis, investment, business, marketing.
Pie Chart Finance Ppt PowerPoint Presentation Slides Icon
This is a pie chart finance ppt powerpoint presentation slides icon. This is a three stage process. The stages in this process are pie chart, finance, analysis, investment, business.
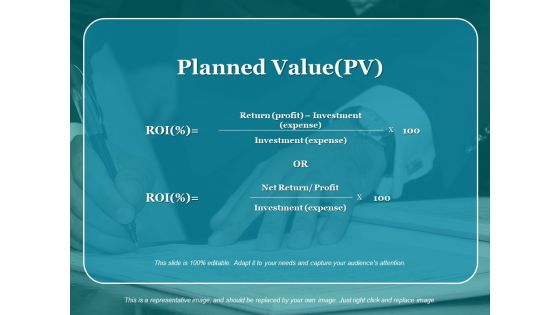
Planned Value Pv Ppt PowerPoint Presentation Portfolio Backgrounds
This is a planned value pv ppt powerpoint presentation portfolio backgrounds. This is a two stage process. The stages in this process are planned value, finance, analysis, investment, business.
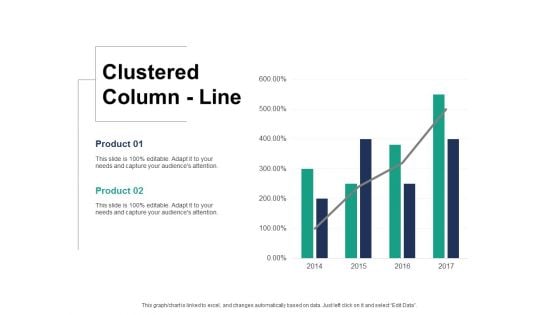
Clustered Column Line Ppt PowerPoint Presentation Inspiration Designs Download
This is a clustered column line ppt powerpoint presentation inspiration designs download. This is a two stage process. The stages in this process are finance, marketing, management, investment, analysis.
Stacked Area Clustered Column Ppt PowerPoint Presentation Icon Model
This is a stacked area clustered column ppt powerpoint presentation icon model. This is a three stage process. The stages in this process are finance, marketing, management, investment, analysis.
Scatter Bubble Chart Ppt PowerPoint Presentation Model Icon
This is a scatter bubble chart ppt powerpoint presentation model icon. This is a three stage process. The stages in this process are finance, business, management, marketing, chart and graph.
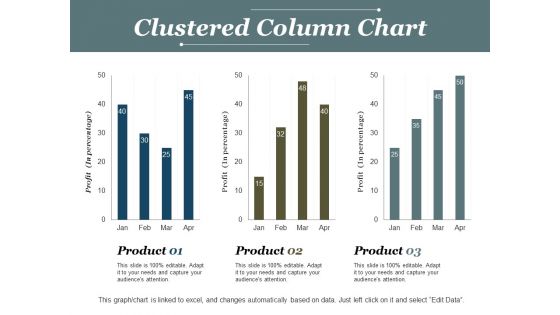
Clustered Column Chart Ppt PowerPoint Presentation Model Deck
This is a clustered column chart ppt powerpoint presentation model deck. This is a three stage process. The stages in this process are clustered column chart, product, finance, profit, business.
Net Promoter Score Tracker Ppt PowerPoint Presentation File Pictures
This is a net promoter score tracker ppt powerpoint presentation file pictures. This is a three stage process. The stages in this process are detractors, passives, promoters, business, management.
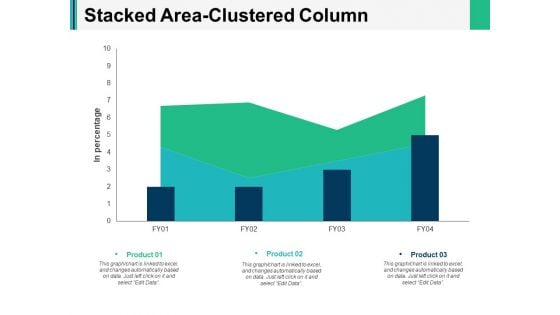
Stacked Area Clustered Column Ppt PowerPoint Presentation Infographics Backgrounds
This is a stacked area clustered column ppt powerpoint presentation infographics backgrounds. This is a three stage process. The stages in this process are finance, marketing, management, investment, analysis.
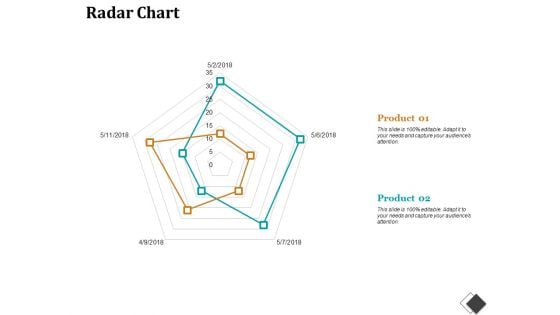
Radar Chart Enterprise Model Canvas Ppt PowerPoint Presentation File Slides
This is a radar chart enterprise model canvas ppt powerpoint presentation file slides. This is a two stage process. The stages in this process are radar chart, finance, marketing, strategy, business.
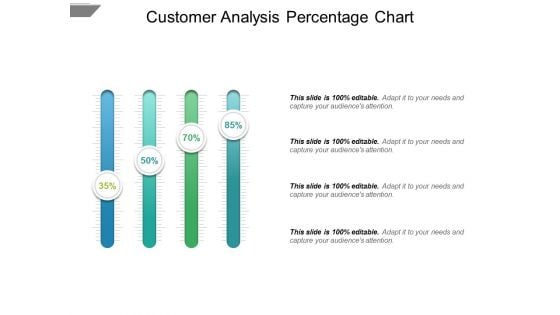
Customer Analysis Percentage Chart Ppt PowerPoint Presentation Infographics Master Slide
This is a customer analysis percentage chart ppt powerpoint presentation infographics master slide. This is a four stage process. The stages in this process are comparison chart, comparison table, comparison matrix.
Survey Results Ppt PowerPoint Presentation Icon Clipart Images
This is a survey results ppt powerpoint presentation icon clipart images. This is a four stage process. The stages in this process are survey results, business, planning, marketing, strategy, management.
Column Chart Analysis Ppt PowerPoint Presentation Icon Structure
This is a column chart analysis ppt powerpoint presentation icon structure. This is a three stage process. The stages in this process are column chart, finance, marketing, management, investment.
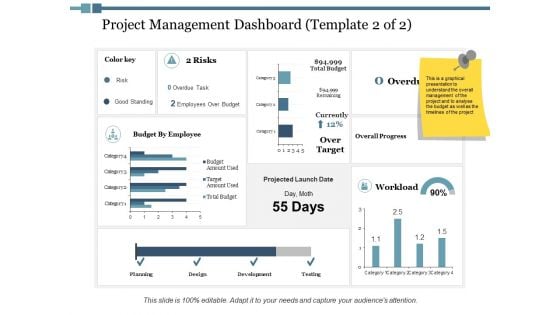
Project Management Dashboard Workload Ppt PowerPoint Presentation Inspiration Show
This is a project management dashboard workload ppt powerpoint presentation inspiration show. This is a four stage process. The stages in this process are finance, marketing, management, investment, analysis.
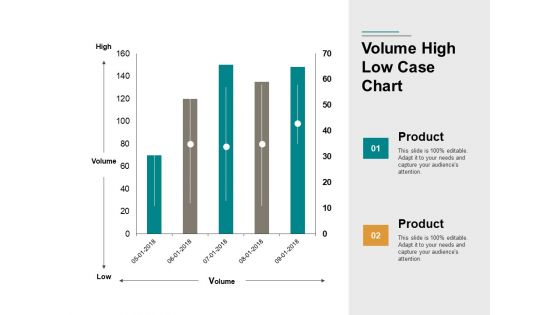
Volume High Low Case Chart Ppt PowerPoint Presentation Portfolio Images
This is a volume high low case chart ppt powerpoint presentation portfolio images. This is a two stage process. The stages in this process are finance, business, marketing, management.
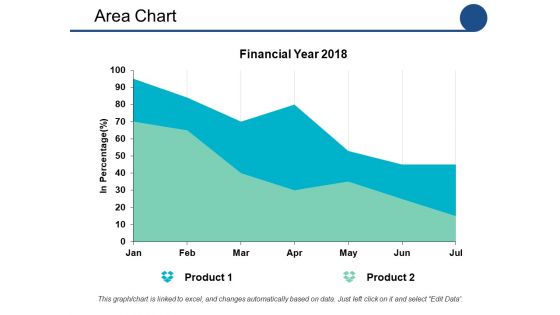
Area Chart Ppt PowerPoint Presentation Show Graphics Tutorials
This is a area chart ppt powerpoint presentation show graphics tutorials. This is a two stage process. The stages in this process are area chart, percentage, product, marketing, management.
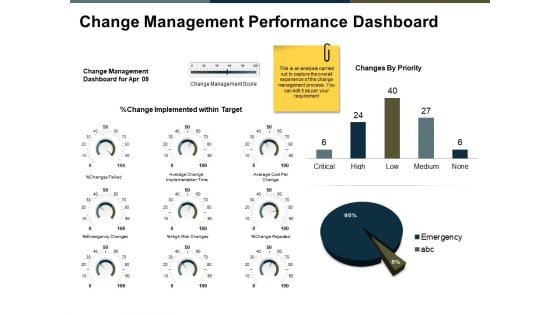
Change Management Performance Dashboard Ppt PowerPoint Presentation Professional Portrait
This is a change management performance dashboard ppt powerpoint presentation professional portrait. This is a three stage process. The stages in this process are finance, marketing, analysis, business, investment.
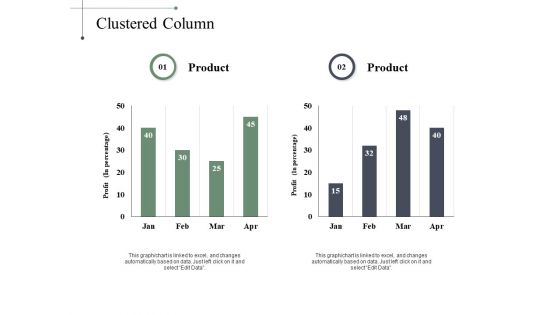
Clustered Column Finance Ppt PowerPoint Presentation Portfolio Guide
This is a clustered column finance ppt powerpoint presentation portfolio guide. This is a two stage process. The stages in this process are clustered column, finance, marketing, analysis, investment.
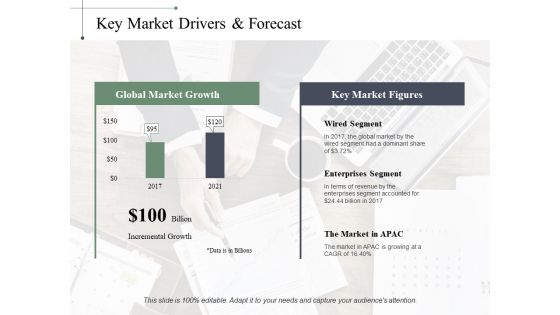
Key Market Drivers Forecast Ppt PowerPoint Presentation Inspiration Graphic Tips
This is a key market drivers forecast ppt powerpoint presentation inspiration graphic tips. This is a two stage process. The stages in this process are wired segment, enterprises segment, incremental growth, business, management.
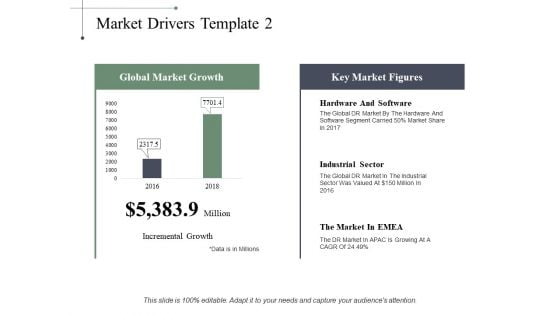
Market Drivers Industrial Sector Ppt PowerPoint Presentation File Microsoft
This is a market drivers industrial sector ppt powerpoint presentation file microsoft. This is a two stage process. The stages in this process are industrial sector, incremental growth, marketing, management, strategy.
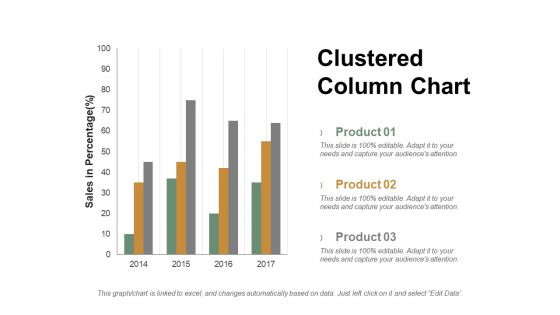
Clustered Column Chart Ppt PowerPoint Presentation Professional Ideas
This is a clustered column chart ppt powerpoint presentation professional ideas. This is a three stage process. The stages in this process are product, sales in percentage, column, years.
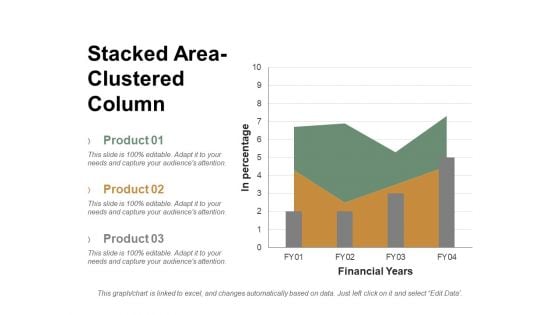
Stacked Area Clustered Column Ppt PowerPoint Presentation Inspiration Slide Portrait
This is a stacked area clustered column ppt powerpoint presentation inspiration slide portrait. This is a three stage process. The stages in this process are product, finance, business, management.
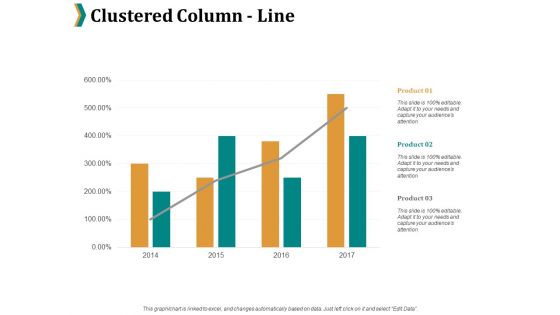
Clustered Column Line Ppt PowerPoint Presentation Visual Aids Ideas
This is a clustered column line ppt powerpoint presentation visual aids ideas. This is a three stage process. The stages in this process are product, percentage, marketing, business, management.
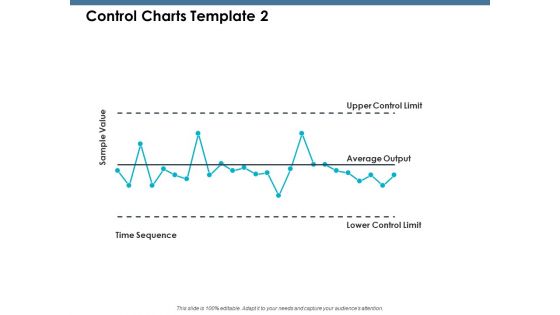
Control Charts Sample Value Ppt PowerPoint Presentation Infographics Demonstration
This is a control charts sample value ppt powerpoint presentation infographics demonstration. This is a five stage process. The stages in this process are product, percentage, marketing, business, management.
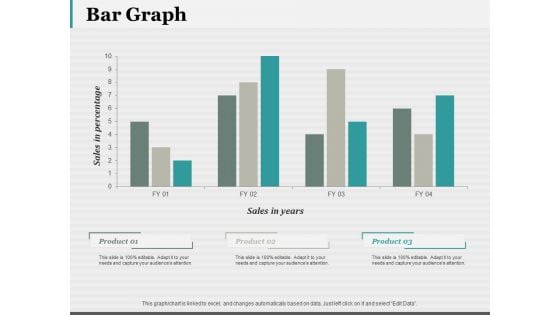
Bar Graph 7 QC Tools Ppt PowerPoint Presentation Styles Structure
This is a bar graph 7 qc tools ppt powerpoint presentation styles structure. This is a three stage process. The stages in this process are bar graph, finance, marketing, analysis, investment.
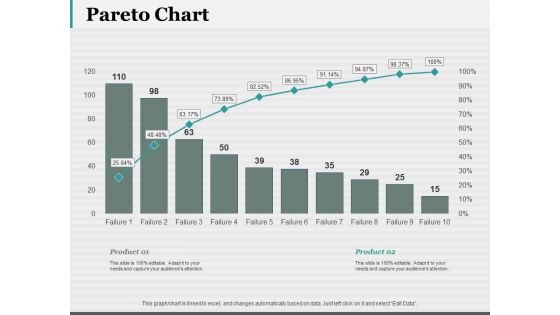
Pareto Chart Ppt PowerPoint Presentation Visual Aids Pictures
This is a pareto chart ppt powerpoint presentation visual aids pictures. This is a two stage process. The stages in this process are pareto chart, finance, marketing, strategy, business.
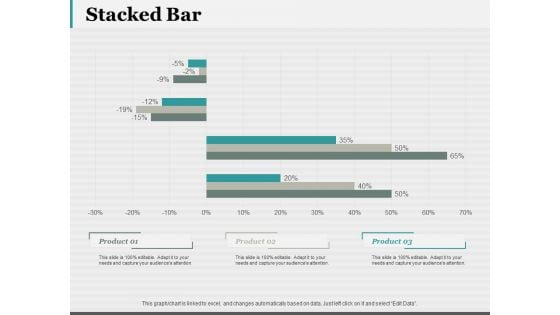
Stacked Bar 7 QC Tools Ppt PowerPoint Presentation Portfolio Smartart
This is a stacked bar 7 qc tools ppt powerpoint presentation portfolio smartart. This is a three stage process. The stages in this process are stacked bar, finance, marketing, strategy, business.
Stacked Column 7 QC Tools Ppt PowerPoint Presentation Icon
This is a stacked column 7 qc tools ppt powerpoint presentation icon. This is a three stage process. The stages in this process are stacked column, finance, marketing, strategy, business.

Bubble Chart Analysis Ppt PowerPoint Presentation Gallery Introduction
This is a bubble chart analysis ppt powerpoint presentation gallery introduction. This is a two stage process. The stages in this process are bubble chart, finance, marketing, strategy, business.
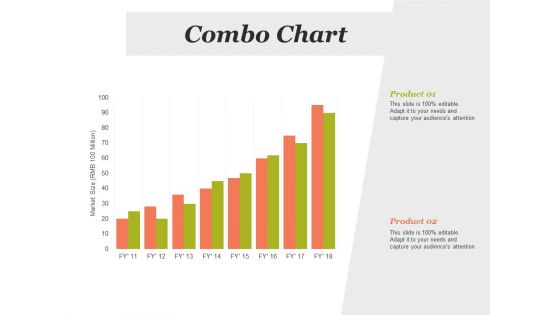
Combo Chart Process Ppt PowerPoint Presentation Model Clipart
This is a combo chart process ppt powerpoint presentation model clipart. This is a two stage process. The stages in this process are combo chart, finance, marketing, strategy, business.
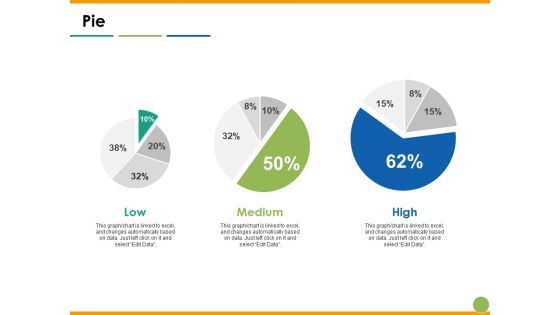
Pie Capability Maturity Matrix Ppt PowerPoint Presentation Infographics Visual Aids
This is a pie capability maturity matrix ppt powerpoint presentation infographics visual aids. This is a three stage process. The stages in this process are pie, low, medium, high, percentage.
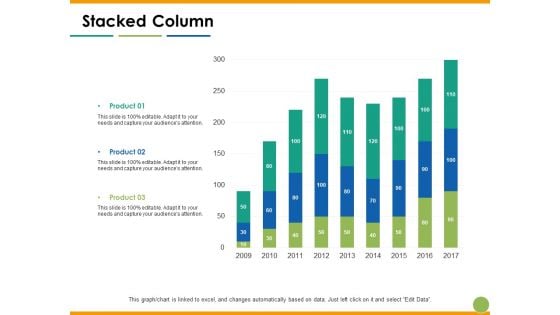
Stacked Column Capability Maturity Matrix Ppt PowerPoint Presentation Model Shapes
This is a stacked column capability maturity matrix ppt powerpoint presentation model shapes. This is a three stage process. The stages in this process are stacked column, product, year, finance, business.
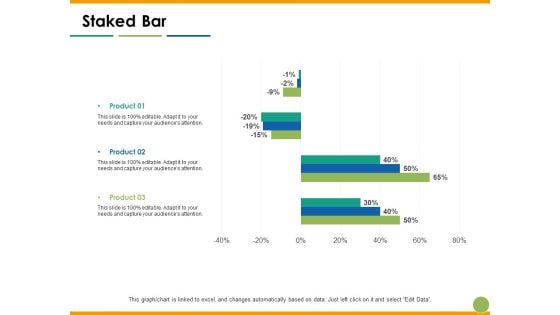
Staked Bar Capability Maturity Matrix Ppt PowerPoint Presentation Slides Outfit
This is a staked bar capability maturity matrix ppt powerpoint presentation slides outfit. This is a three stage process. The stages in this process are staked bar, product, year, finance, percentage.
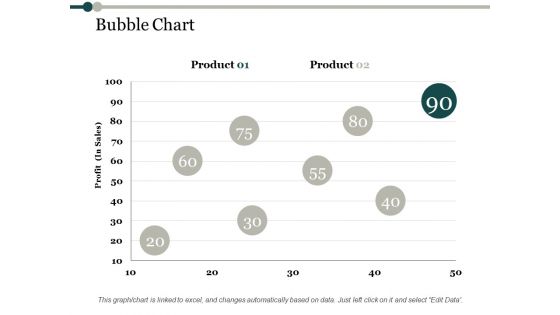
Bubble Chart Process Analysis Ppt PowerPoint Presentation Ideas Files
This is a bubble chart process analysis ppt powerpoint presentation ideas files. This is a two stage process. The stages in this process are bubble chart, product, profit, finance, business.
Clustered Bar Process Analysis Ppt PowerPoint Presentation Icon Influencers
This is a clustered bar process analysis ppt powerpoint presentation icon influencers. This is a two stage process. The stages in this process are clustered bar, profit, product, finance, business.
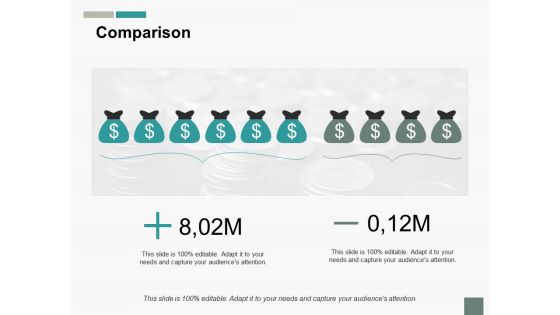
Comparison Currency Ppt PowerPoint Presentation File Background Images
This is a comparison currency ppt powerpoint presentation file background images. This is a two stage process. The stages in this process are comparison, finance, marketing, management, investment, analysis.
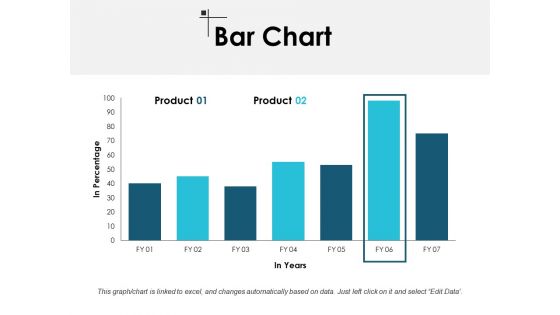
Bar Chart Finance Ppt PowerPoint Presentation Model Master Slide
This is a bar chart finance ppt powerpoint presentation model master slide. This is a two stage process. The stages in this process are finance, marketing, management, investment, analysis.
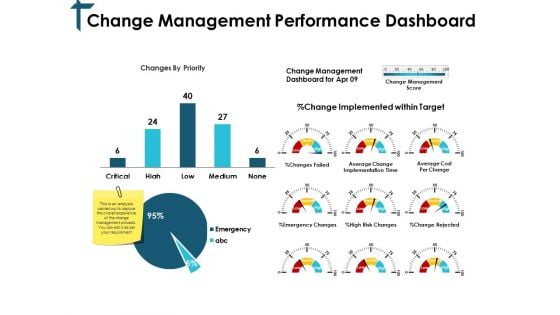
Change Management Performance Dashboard Ppt PowerPoint Presentation Professional Slides
This is a change management performance dashboard ppt powerpoint presentation professional slides. This is a three stage process. The stages in this process are finance, marketing, management, investment, analysis.
Stacked Area Clustered Column Ppt PowerPoint Presentation Inspiration Icon
This is a stacked area clustered column ppt powerpoint presentation inspiration icon. This is a three stage process. The stages in this process are stacked area clustered column, product, year, in dollars, business.
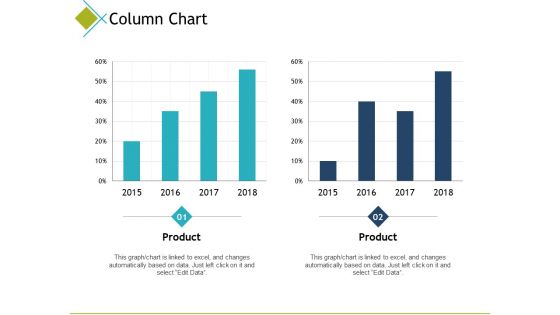
Column Chart Finance Ppt PowerPoint Presentation Model Examples
This is a column chart finance ppt powerpoint presentation model examples. This is a two stage process. The stages in this process are column chart, finance, marketing, analysis, investment.
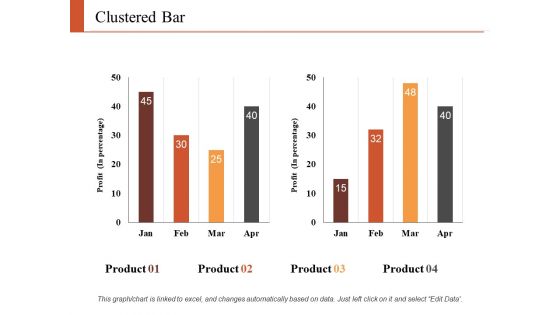
Clustered Bar Finance Ppt PowerPoint Presentation Gallery Background Images
This is a clustered bar finance ppt powerpoint presentation gallery background images. This is a four stage process. The stages in this process are finance, marketing, analysis, business, investment.
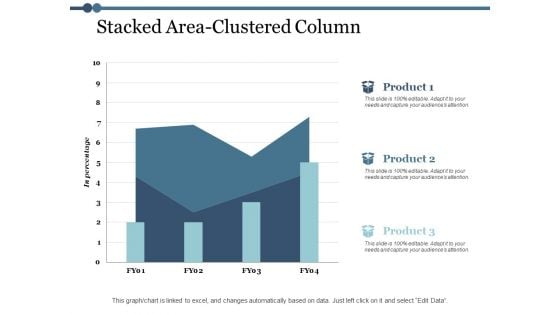
Stacked Area Clustered Column Ppt PowerPoint Presentation Model Topics
This is a stacked area clustered column ppt powerpoint presentation model topics. This is a three stage process. The stages in this process are area chart, finance, marketing, management, investment.
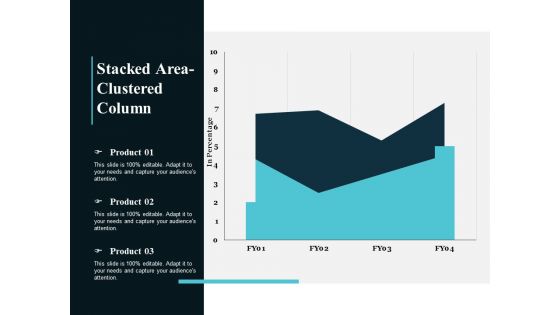
Stacked Area Clustered Column Ppt PowerPoint Presentation Slides Background Designs
This is a stacked area clustered column ppt powerpoint presentation slides background designs. This is a three stage process. The stages in this process are percentage, product, business, management.
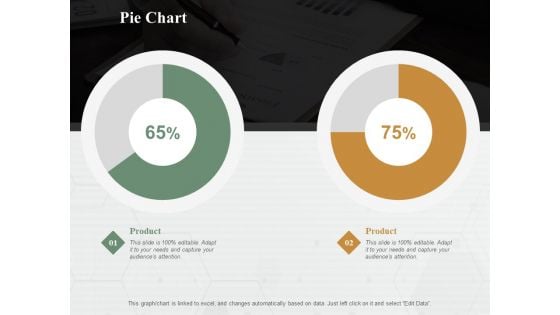
Pie Chart Finance Ppt PowerPoint Presentation Diagram Lists
This is a pie chart finance ppt powerpoint presentation diagram lists. This is a two stage process. The stages in this process are pie chart, finance, marketing, analysis, business.
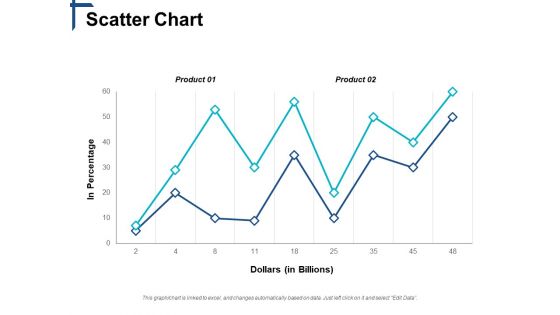
Scatter Chart Competitive Differentiation Ppt PowerPoint Presentation Show Slides
This is a scatter chart competitive differentiation ppt powerpoint presentation show slides. This is a two stage process. The stages in this process are business, management, marketing, strategy, sales.
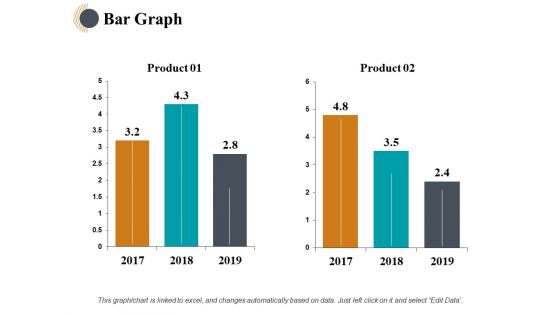
Bar Graph Finance Ppt PowerPoint Presentation Infographics Background Designs
This is a bar graph finance ppt powerpoint presentation infographics background designs. This is a two stage process. The stages in this process are finance, analysis, business, investment, marketing.
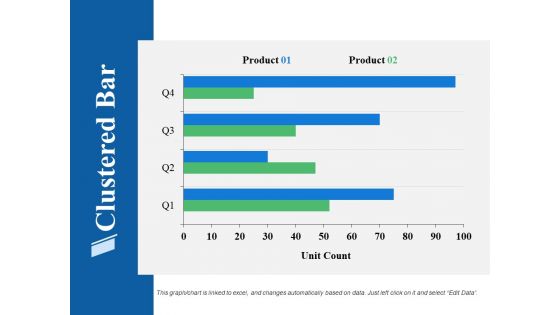
Clustered Bar Finance Ppt PowerPoint Presentation Show Background Image
This is a clustered bar finance ppt powerpoint presentation show background image. This is a two stage process. The stages in this process are finance, analysis, business, investment, marketing.
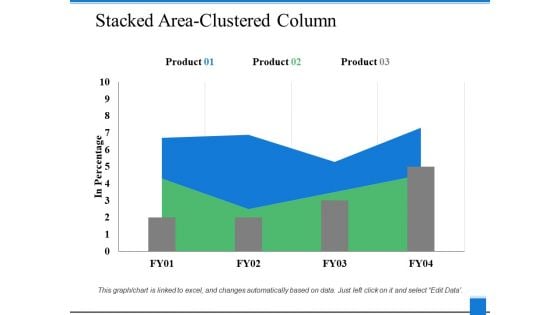
Stacked Area Clustered Column Finance Ppt PowerPoint Presentation Good
This is a stacked area clustered column finance ppt powerpoint presentation good. This is a three stage process. The stages in this process are finance, analysis, business, investment, marketing.
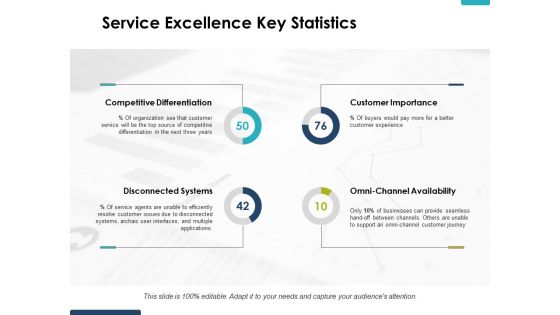
Service Excellence Key Statistics Ppt PowerPoint Presentation Gallery Format Ideas
This is a service excellence key statistics ppt powerpoint presentation gallery format ideas. This is a four stage process. The stages in this process are competitive differentiation, disconnected systems, customer importance.
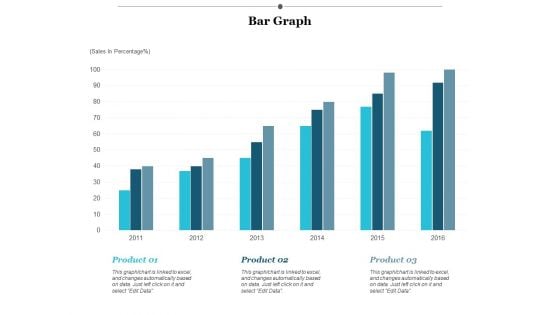
Bar Graph Finance Ppt PowerPoint Presentation Infographics Designs Download
This is a bar graph finance ppt powerpoint presentation infographics designs download. This is a three stage process. The stages in this process are finance, marketing, management, investment, analysis.
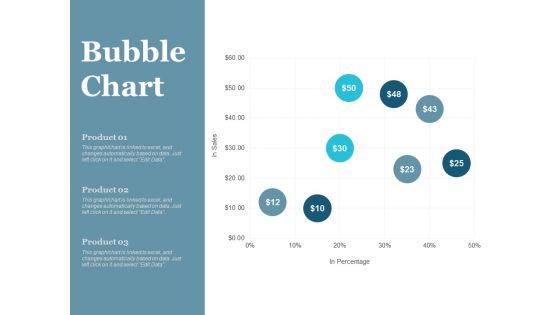
Bubble Chart Finance Ppt PowerPoint Presentation File Master Slide
This is a bubble chart finance ppt powerpoint presentation file master slide. This is a three stage process. The stages in this process are finance, marketing, management, investment, analysis.
Clustered Column Finance Ppt PowerPoint Presentation Icon Graphics Tutorials
This is a clustered column finance ppt powerpoint presentation icon graphics tutorial. This is a three stage process. The stages in this process are finance, marketing, management, investment, analysis.
Stacked Area Clustered Column Ppt PowerPoint Presentation Icon Examples
This is a stacked area clustered column ppt powerpoint presentation icon examples. This is a three stage process. The stages in this process are percentage, product, management, marketing, business.
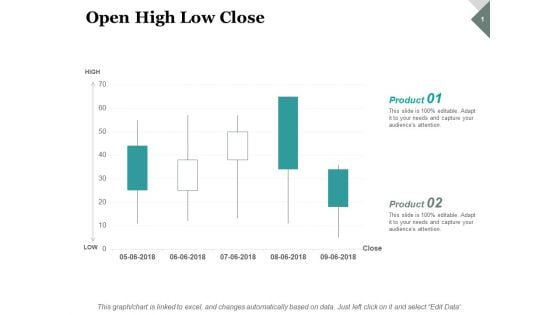
Open High Low Close Investment Ppt PowerPoint Presentation Slides Portrait
This is a open high low close investment ppt powerpoint presentation slides portrait. This is a two stage process. The stages in this process are finance, analysis, business, investment, marketing.
Pie Chart Investment Ppt PowerPoint Presentation Gallery Icon
This is a pie chart investment ppt powerpoint presentation gallery icon. This is a three stage process. The stages in this process are pie chart, finance, marketing, analysis, investment.
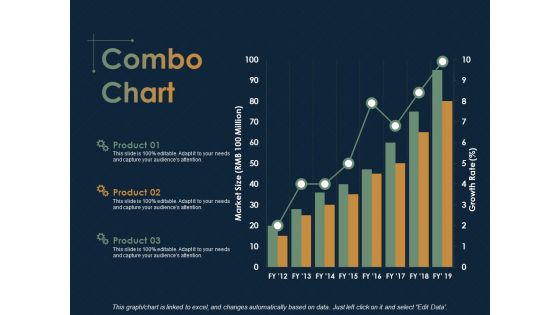
Combo Chart Finance Ppt PowerPoint Presentation Ideas Microsoft
This is a combo chart finance ppt powerpoint presentation ideas microsoft. This is a three stage process. The stages in this process are combo chart, Finance, Analysis, Business, Investment.


 Continue with Email

 Home
Home


