Financial Technology

Online Advertising Firm Business Profile Our Management Team Microsoft PDF
This slide focuses on management team which includes chief executive officer, co-founder, chief financial and operations officer, chairperson of the board, chief technology officer, etc. Explore a selection of the finest Online Advertising Firm Business Profile Our Management Team Microsoft PDF here. With a plethora of professionally designed and pre made slide templates, you can quickly and easily find the right one for your upcoming presentation. You can use our Online Advertising Firm Business Profile Our Management Team Microsoft PDF to effectively convey your message to a wider audience. Slidegeeks has done a lot of research before preparing these presentation templates. The content can be personalized and the slides are highly editable. Grab templates today from Slidegeeks.
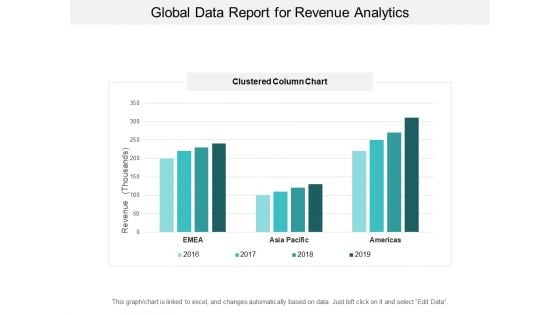
Global Data Report For Revenue Analytics Ppt PowerPoint Presentation Inspiration Visuals
This is a global data report for revenue analytics ppt powerpoint presentation inspiration visuals. This is a four stage process. The stages in this process are financial analysis, quantitative, statistical modelling.
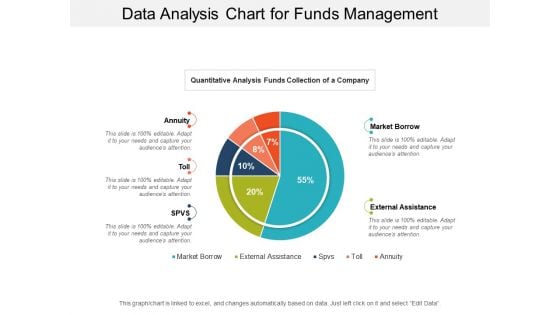
Data Analysis Chart For Funds Management Ppt PowerPoint Presentation Infographic Template Files
This is a data analysis chart for funds management ppt powerpoint presentation infographic template files. This is a five stage process. The stages in this process are financial analysis, quantitative, statistical modelling.
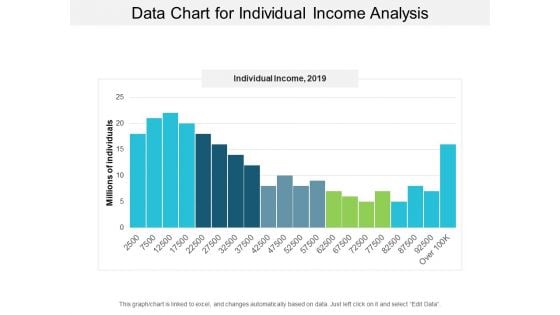
Data Chart For Individual Income Analysis Ppt PowerPoint Presentation Layouts Visual Aids
This is a data chart for individual income analysis ppt powerpoint presentation layouts visual aids. This is a five stage process. The stages in this process are financial analysis, quantitative, statistical modelling.
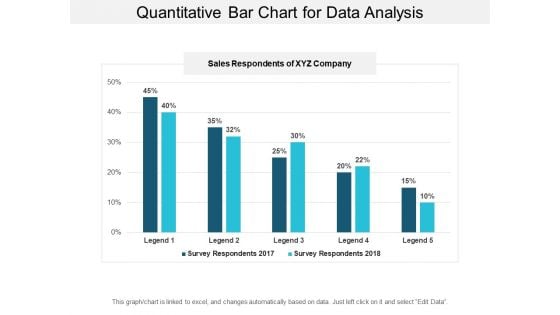
Quantitative Bar Chart For Data Analysis Ppt PowerPoint Presentation Model Graphic Tips
This is a quantitative bar chart for data analysis ppt powerpoint presentation model graphic tips. This is a two stage process. The stages in this process are financial analysis, quantitative, statistical modelling.
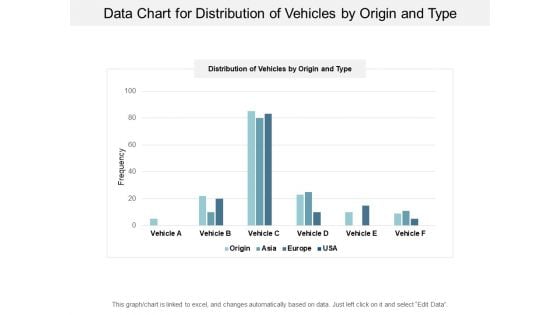
Data Chart For Distribution Of Vehicles By Origin And Type Ppt PowerPoint Presentation Infographics Topics
This is a data chart for distribution of vehicles by origin and type ppt powerpoint presentation infographics topics. This is a four stage process. The stages in this process are financial analysis, quantitative, statistical modelling.
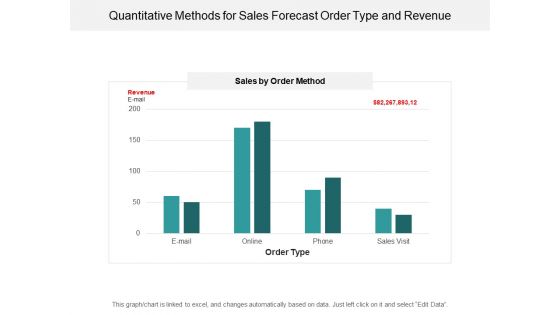
Quantitative Methods For Sales Forecast Order Type And Revenue Ppt PowerPoint Presentation Styles Show
This is a quantitative methods for sales forecast order type and revenue ppt powerpoint presentation styles show. This is a four stage process. The stages in this process are financial analysis, quantitative, statistical modelling.
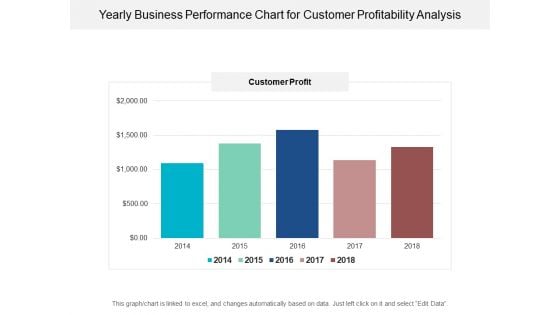
Yearly Business Performance Chart For Customer Profitability Analysis Ppt PowerPoint Presentation Ideas Picture
This is a yearly business performance chart for customer profitability analysis ppt powerpoint presentation ideas picture. This is a five stage process. The stages in this process are financial analysis, quantitative, statistical modelling.
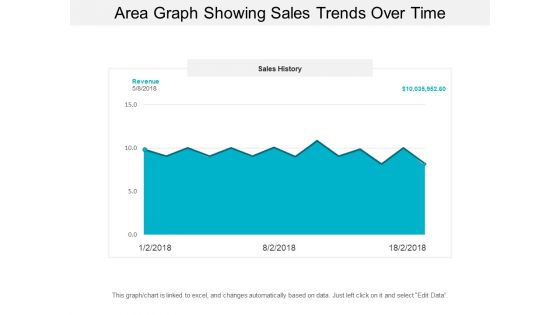
Area Graph Showing Sales Trends Over Time Ppt PowerPoint Presentation Model Background Designs
This is a area graph showing sales trends over time ppt powerpoint presentation model background designs. This is a three stage process. The stages in this process are financial analysis, quantitative, statistical modelling.
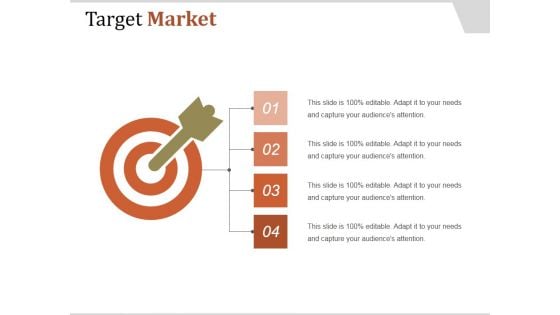
Target Market Ppt PowerPoint Presentation Sample
This is a target market ppt powerpoint presentation sample. This is a four stage process. The stages in this process are competitive brands market share, target market shares, financial years.
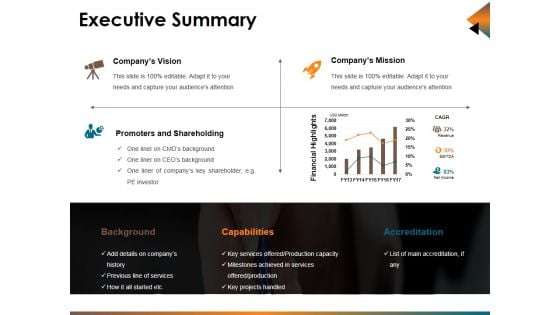
Executive Summary Ppt PowerPoint Presentation Styles Professional
This is a executive summary ppt powerpoint presentation styles professional. This is a four stage process. The stages in this process are company vision, promoters and shareholding, company mission, financial highlights.
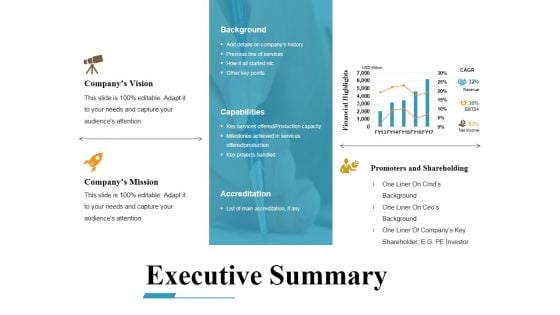
Executive Summary Ppt PowerPoint Presentation Ideas Example File
This is a executive summary ppt powerpoint presentation ideas example file. This is a three stage process. The stages in this process are company vision, company mission, promoters and shareholding, financial highlights.
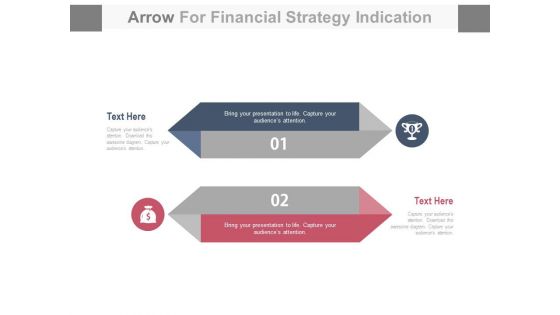
Two Arrows Tags For Financial1 Success Strategy PowerPoint Slides
This PowerPoint Template can be used for multiple purposes. The slide can be a part of your presentation and because of its modern and creative design, it is bound to leave an everlasting impression on the audience. The two figures are vertical diamonds and relevant text and icons can be placed on each side to explain any process. Similarly, you can use the diagram to describe the raw materials and in the diagram, you can explain the process. At the end of the diagram an icon or symbol of the finished or the final product can be placed to explain the conclusion of the process. \n
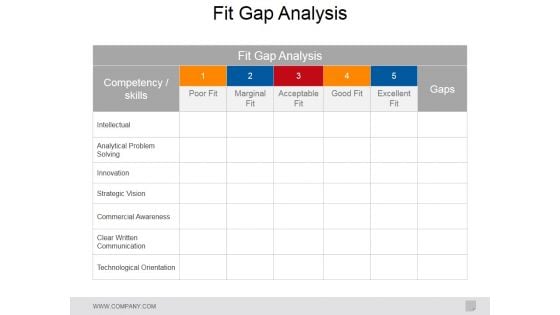
Fit Gap Analysis Ppt PowerPoint Presentation File Graphics Tutorials
This is a fit gap analysis ppt powerpoint presentation file graphics tutorials. This is a five stage process. The stages in this process are intellectual, analytical problem solving, innovation, strategic vision, commercial awareness, clear written communication, technological orientation.
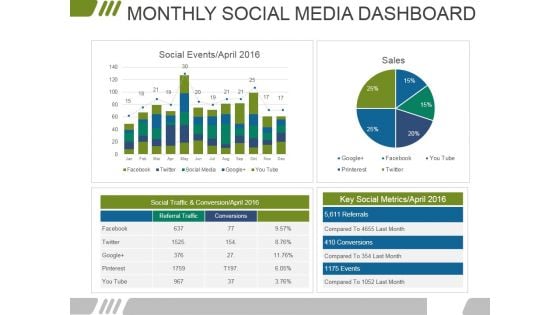
Monthly Social Media Dashboard Ppt PowerPoint Presentation Infographics Files
This is a monthly social media dashboard ppt powerpoint presentation infographics files. This is a four stage process. The stages in this process are marketing, business, financial, data analysis, management.
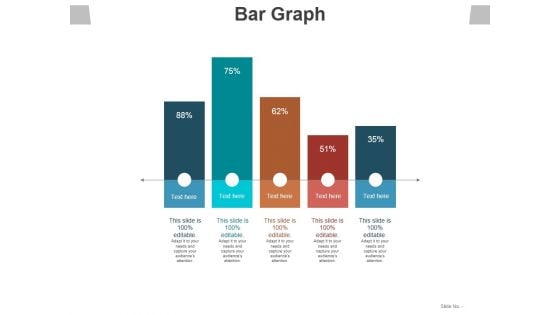
Bar Graph Ppt PowerPoint Presentation Slides Designs
This is a bar graph ppt powerpoint presentation slides designs. This is a five stage process. The stages in this process are bar graph, business, marketing, plan, financial.

Crm Dashboard Current Lead Status Ppt PowerPoint Presentation Guide
This is a crm dashboard current lead status ppt powerpoint presentation guide. This is a six stage process. The stages in this process are business, marketing, success, presentation, financial.
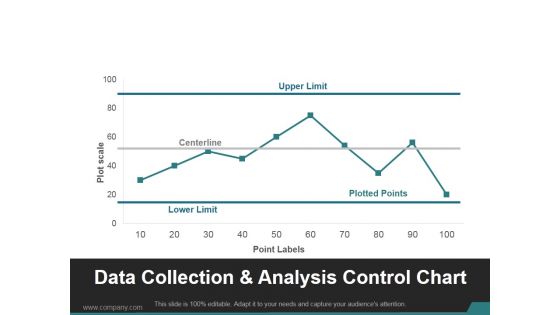
Data Collection And Analysis Control Chart Ppt PowerPoint Presentation Visuals
This is a data collection and analysis control chart ppt powerpoint presentation visuals. This is a ten stage process. The stages in this process are upper limit, centerline, lower limit, plotted points.
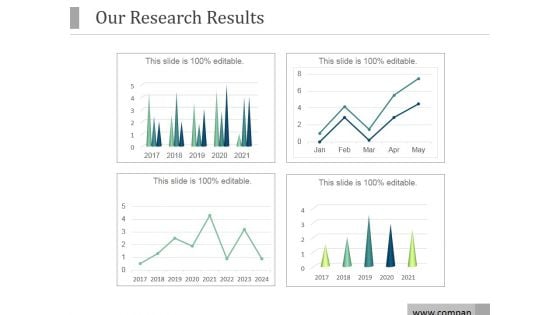
Our Research Results Ppt PowerPoint Presentation Model
This is a our research results ppt powerpoint presentation model. This is a four stage process. The stages in this process are research, financials, business, marketing, management, success.
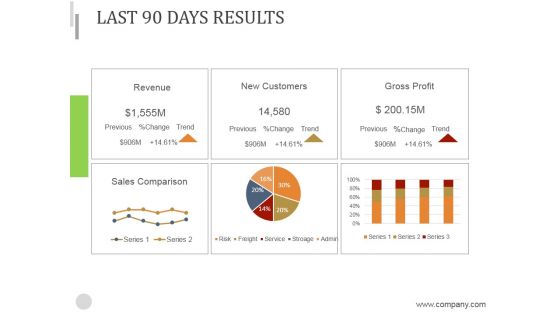
Last 90 Days Results Ppt PowerPoint Presentation Introduction
This is a last 90 days results ppt powerpoint presentation introduction. This is a six stage process. The stages in this process are revenue, new customers, gross profit, sales comparison.
Software Development Project Comparative Analysis Of Actual Cost And Budget Table Mockup PDF
Presenting Software Development Project Comparative Analysis Of Actual Cost And Budget Table Mockup PDF to dispense important information. This template comprises three stages. It also presents valuable insights into the topics including Software Development, Project Comparative Analysis, Budget Table. This is a completely customizable PowerPoint theme that can be put to use immediately. So, download it and address the topic impactfully.
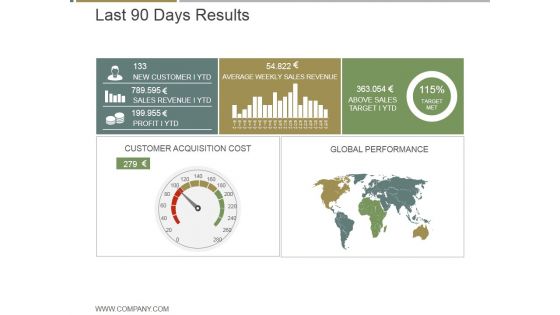
Last 90 Days Results Ppt PowerPoint Presentation Graphics
This is a last 90 days results ppt powerpoint presentation graphics. This is a five stage process. The stages in this process are new customer ytd, average weekly sales revenue, above sales target i ytd, customer acquisition cost, global performance.
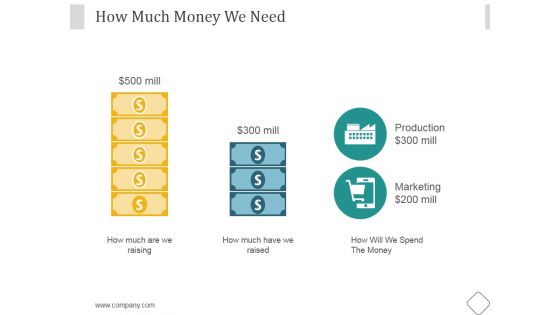
How Much Money We Need Ppt PowerPoint Presentation Outline
This is a how much money we need ppt powerpoint presentation outline. This is a three stage process. The stages in this process are business, marketing, management, production, sales.
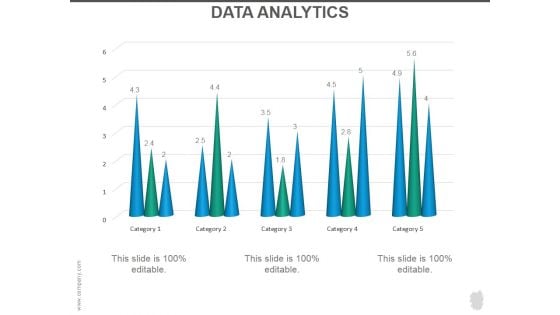
Data Analytics Ppt PowerPoint Presentation Graphics
This is a data analytics ppt powerpoint presentation graphics. This is a five stage process. The stages in this process are data analysis, business, marketing, success, graph.
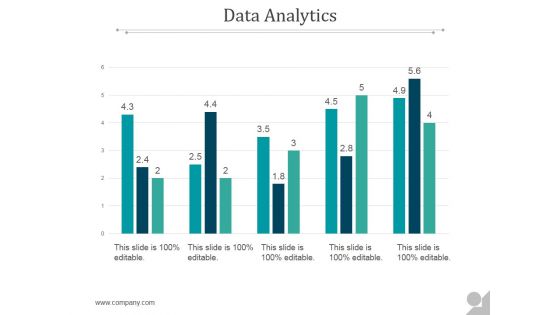
Data Analytics Ppt PowerPoint Presentation Themes
This is a data analytics ppt powerpoint presentation themes. This is a five stage process. The stages in this process are business, marketing, presentation, data analyst, management.
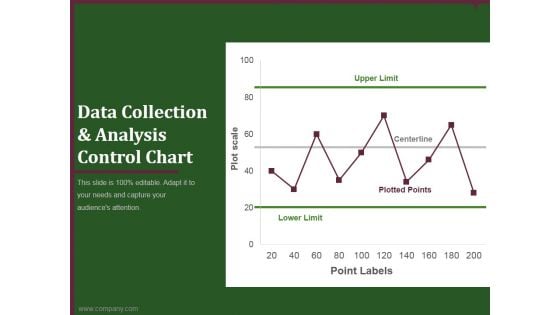
data collection and analysis control chart ppt powerpoint presentation styles
This is a data collection and analysis control chart ppt powerpoint presentation styles. This is a one stage process. The stages in this process are upper limit, centerline, plotted points, lower limit, point labels.
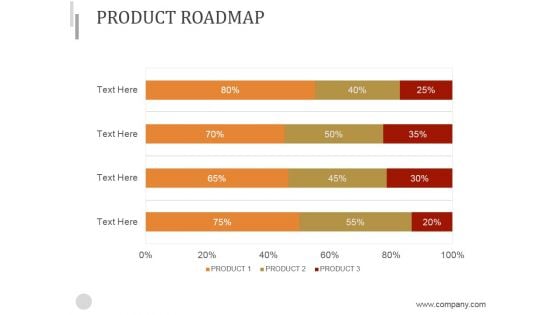
Product Roadmap Ppt PowerPoint Presentation Inspiration
This is a product roadmap ppt powerpoint presentation inspiration. This is a four stage process. The stages in this process are roadmap, finance, strategy, success, management.
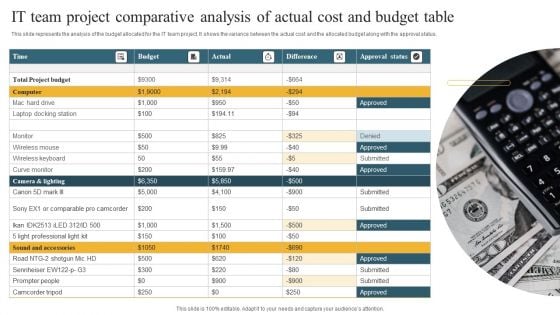
IT Team Project Comparative Analysis Of Actual Cost And Budget Table Template PDF
This slide represents the analysis of the budget allocated for the IT team project. It shows the variance between the actual cost and the allocated budget along with the approval status. Persuade your audience using this IT Team Project Comparative Analysis Of Actual Cost And Budget Table Template PDF. This PPT design covers one stages, thus making it a great tool to use. It also caters to a variety of topics including Budget Table, Actual Cost, Approval Status. Download this PPT design now to present a convincing pitch that not only emphasizes the topic but also showcases your presentation skills.
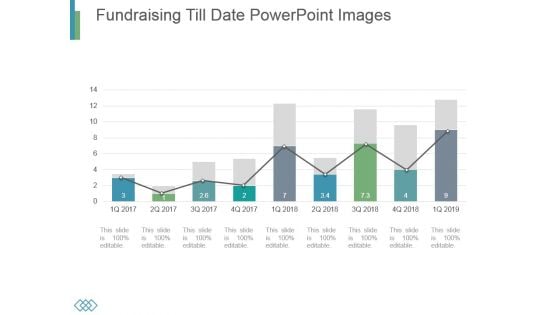
Fundraising Till Date Powerpoint Images
This is a fundraising till date powerpoint images. This is a nine stage process. The stages in this process are business, marketing, growth, timeline, management.
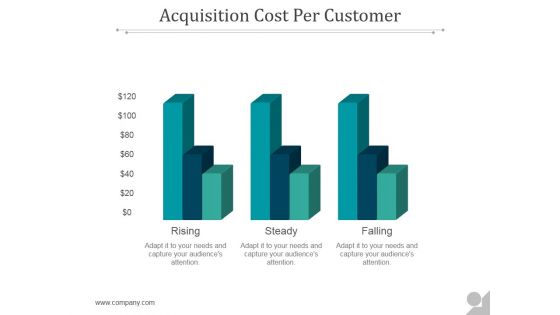
Acquisition Cost Per Customer Ppt PowerPoint Presentation Example 2015
This is a acquisition cost per customer ppt powerpoint presentation example 2015. This is a three stage process. The stages in this process are rising, steady, falling.
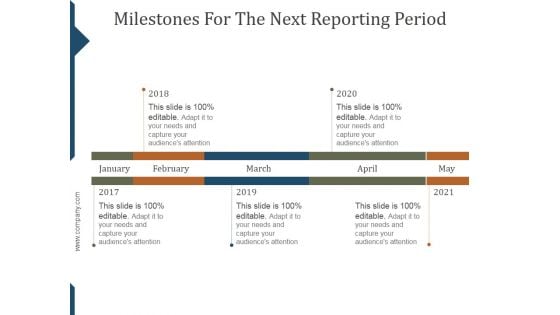
Milestones For The Next Reporting Period Template Ppt PowerPoint Presentation Background Images
This is a milestones for the next reporting period template ppt powerpoint presentation background images. This is a six stage process. The stages in this process are jan, feb, mar, apr, may, jun.
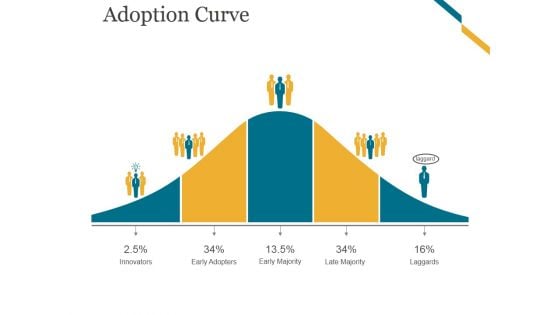
Adoption Curve Ppt PowerPoint Presentation Designs
This is a adoption curve ppt powerpoint presentation designs. This is a five stage process. The stages in this process are innovators, early adopters, early majority, late majority, laggards.
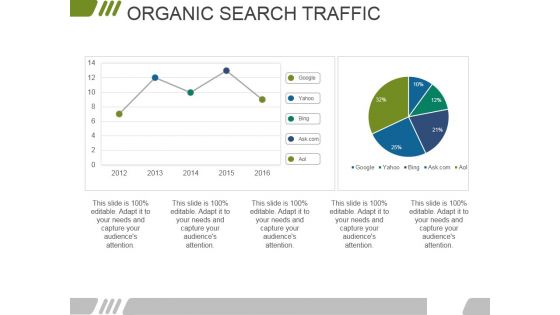
Organic Search Traffic Ppt PowerPoint Presentation Model Slideshow
This is a organic search traffic ppt powerpoint presentation model slideshow. This is a two stage process. The stages in this process are business, marketing, finance, management, organic.
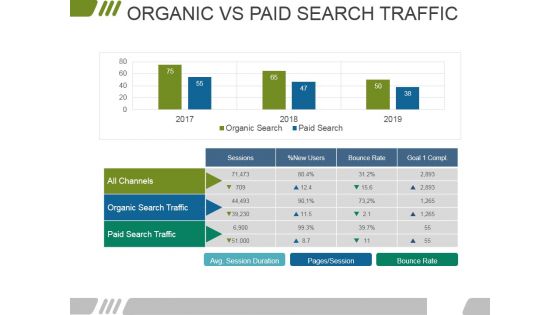
Organic Vs Paid Search Traffic Ppt PowerPoint Presentation Summary Visuals
This is a organic vs paid search traffic ppt powerpoint presentation summary visuals. This is a two stage process. The stages in this process are all channels, organic search traffic, paid search traffic, sessions, bounce rate.
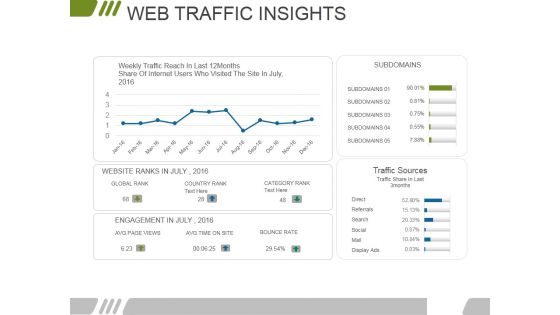
Web Traffic Insights Ppt PowerPoint Presentation Pictures Portrait
This is a web traffic insights ppt powerpoint presentation pictures portrait. This is a four stage process. The stages in this process are subdomains, traffic sources, category rank, country rank, global rank.
Website Performance Review Template 1 Ppt PowerPoint Presentation Slides Icons
This is a website performance review template 1 ppt powerpoint presentation slides icons. This is a three stage process. The stages in this process are online transaction, conversion rate, traffic source, site consumption time, organic branded.
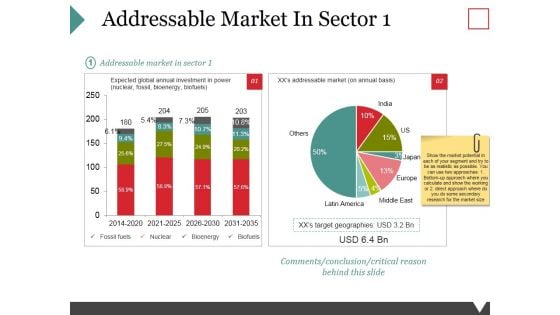
Addressable Market In Sector 1 Ppt PowerPoint Presentation Outline Shapes
This is a addressable market in sector 1 ppt powerpoint presentation outline shapes. This is a two stage process. The stages in this process are fossil fuels, nuclear, bioenergy, biofuels.
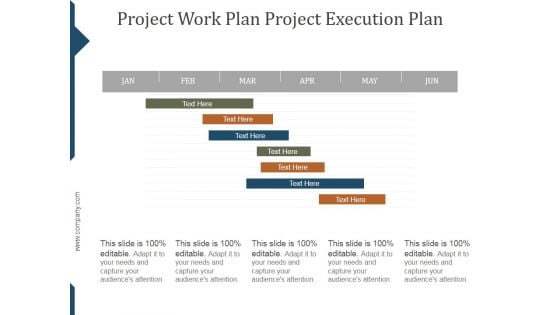
Project Work Plan Project Execution Plan Template Ppt PowerPoint Presentation Styles
This is a project work plan project execution plan template ppt powerpoint presentation styles. This is a seven stage process. The stages in this process are project, management, business, marketing, success.
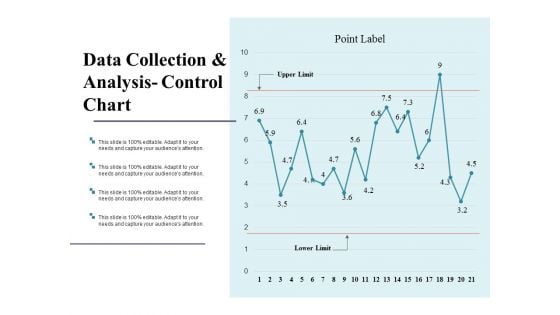
Data Collection And Analysis Control Chart Ppt PowerPoint Presentation Model Backgrounds
This is a data collection and analysis control chart ppt powerpoint presentation model backgrounds. This is a two stage process. The stages in this process are business, marketing, strategy, finance, analysis.
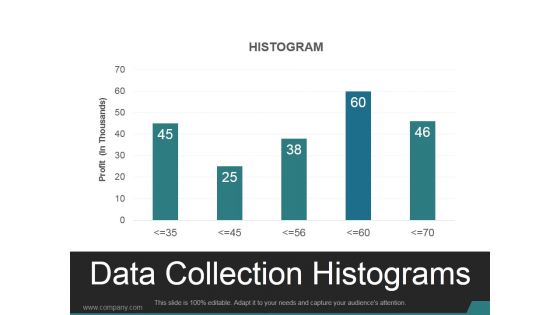
Data Collection Histograms Ppt PowerPoint Presentation Design Templates
This is a data collection histograms ppt powerpoint presentation design templates. This is a five stage process. The stages in this process are histogram, business, marketing, analysis, chart.
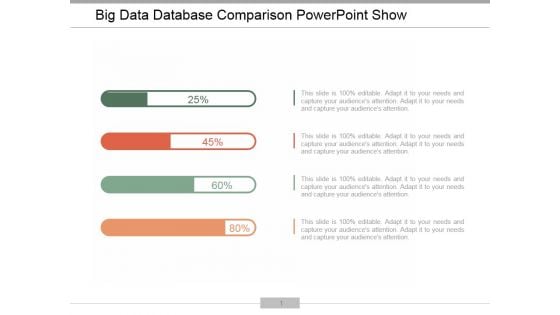
Big Data Database Comparison Ppt PowerPoint Presentation Outline
This is a big data database comparison ppt powerpoint presentation outline. This is a four stage process. The stages in this process are business, finance, management, percentage, growth.
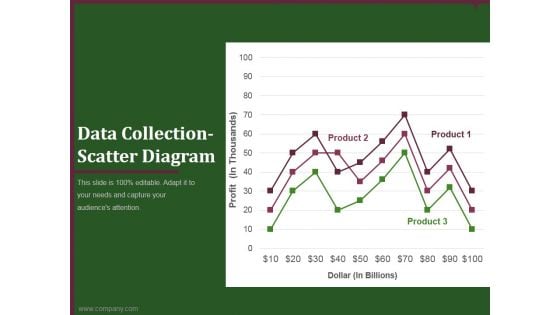
data collection scatter diagram ppt powerpoint presentation inspiration
This is a data collection scatter diagram ppt powerpoint presentation inspiration. This is a three stage process. The stages in this process are business, planning, marketing, scatter diagram, finance.
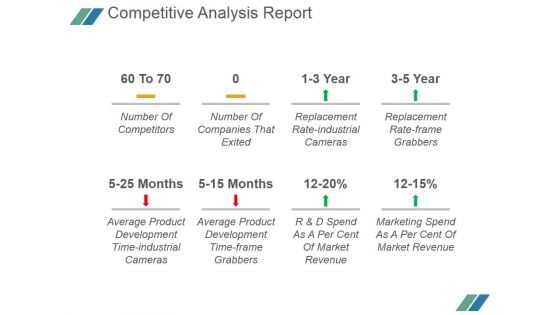
Competitive Analysis Report Ppt PowerPoint Presentation Tips
This is a competitive analysis report ppt powerpoint presentation tips. This is a eight stage process. The stages in this process are number of competitors, number of companies that exited, replacement rate industrial cameras, replacement rate frame grabbers, average product development time industrial cameras, average product development time frame grabbers, r and d spend as a per cent of market revenue, marketing spend as a per cent of market revenue.
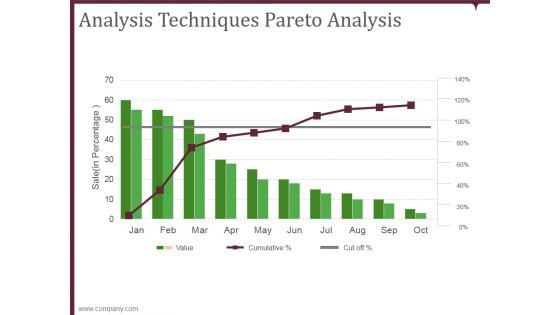
analysis techniques pareto analysis ppt powerpoint presentation backgrounds
This is a analysis techniques pareto analysis ppt powerpoint presentation backgrounds. This is a ten stage process. The stages in this process are business, marketing, decline, analysis, techniques.
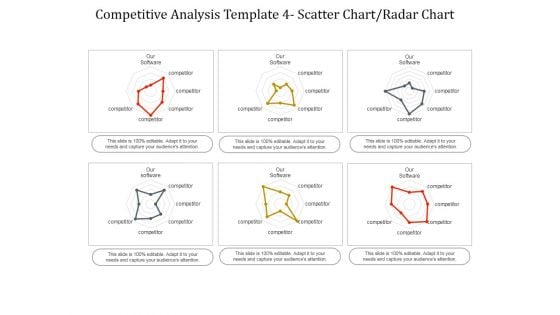
Competitive Analysis Scatter Chart Radar Chart Ppt PowerPoint Presentation Infographics
This is a competitive analysis scatter chart radar chart ppt powerpoint presentation infographics. This is a eight stage process. The stages in this process are users interface, data import, example, pricing, support, update, tutorials, easy to use.
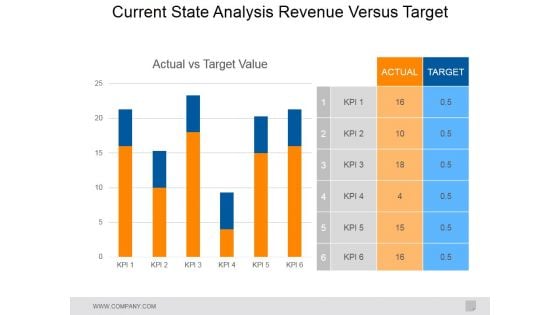
Current State Analysis Revenue Versus Target Ppt PowerPoint Presentation Model Smartart
This is a current state analysis revenue versus target ppt powerpoint presentation model smartart. This is a two stage process. The stages in this process are actual, target, actual vs target value.
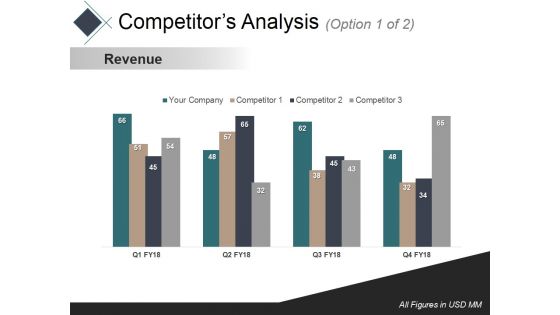
Competitors Analysis 1 Ppt PowerPoint Presentation Outline Templates
This is a competitors analysis 1 ppt powerpoint presentation outline templates. This is a four stage process. The stages in this process are revenue, business, marketing, bar, success.
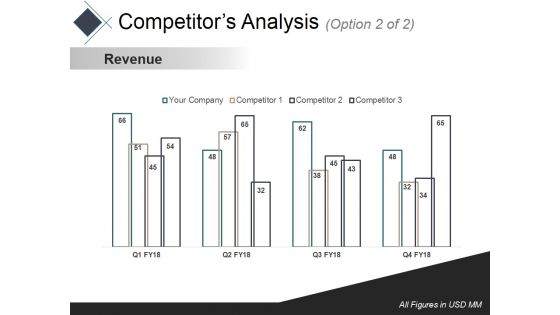
Competitors Analysis 2 Ppt PowerPoint Presentation Slides Gallery
This is a competitors analysis 2 ppt powerpoint presentation slides gallery. This is a four stage process. The stages in this process are revenue, business, marketing, bar, success.
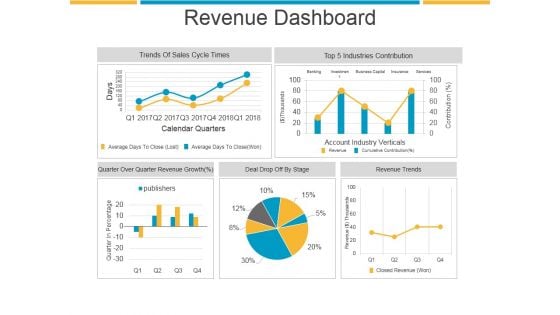
Revenue Dashboard Ppt PowerPoint Presentation Sample
This is a revenue dashboard ppt powerpoint presentation sample. This is a five stage process. The stages in this process are trends of sales cycle times, industries contribution, revenue trends, deal drop off by stage.
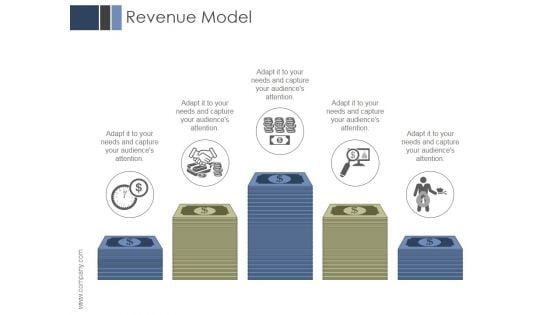
Revenue Model Ppt PowerPoint Presentation Visual Aids
This is a revenue model ppt powerpoint presentation visual aids. This is a five stage process. The stages in this process are business, marketing, management, finance, planning.
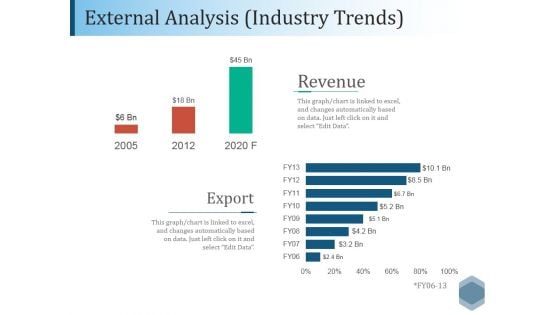
External Analysis Industry Trends Ppt PowerPoint Presentation File Outfit
This is a external analysis industry trends ppt powerpoint presentation file outfit. This is a two stage process. The stages in this process are revenue, export, bar, finance, analysis.
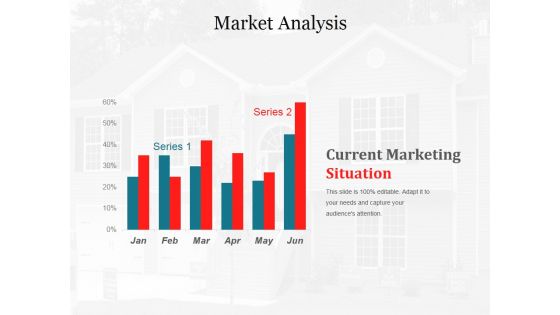
Market Analysis Ppt PowerPoint Presentation Inspiration Template
This is a market analysis ppt powerpoint presentation inspiration template. This is a six stage process. The stages in this process are current marketing situation, strategic, management, planning, business.
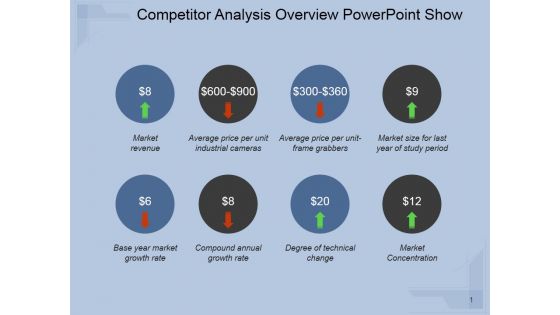
Competitor Analysis Overview Ppt PowerPoint Presentation Images
This is a competitor analysis overview ppt powerpoint presentation images. This is a eight stage process. The stages in this process are number of competitors, number of companies that exited, replacement, rate, industrial cameras, replacement, rate frame, grabbe.
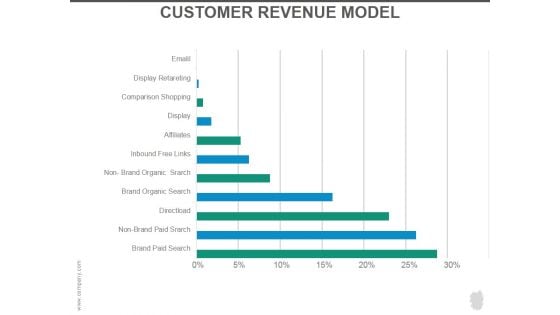
Customer Revenue Model Ppt PowerPoint Presentation Layouts
This is a customer revenue model ppt powerpoint presentation layouts. This is a six stage process. The stages in this process are brand paid search, display, business, email, display retargeting.
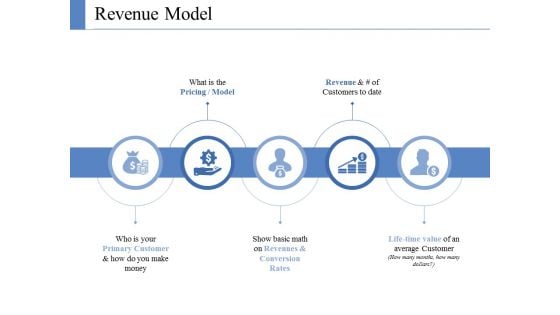
Revenue Model Template Ppt PowerPoint Presentation Ideas Structure
This is a revenue model template ppt powerpoint presentation ideas structure. This is a six stage process. The stages in this process are icons, marketing, strategy, planning, shapes.
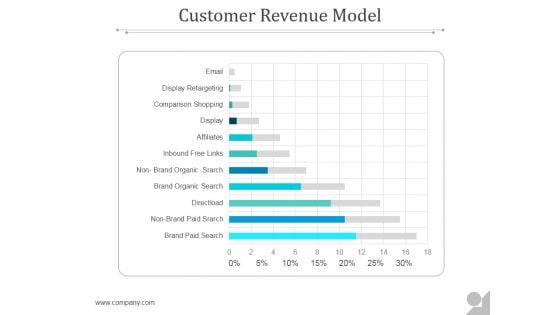
Customer Revenue Model Ppt PowerPoint Presentation Designs Download
This is a customer revenue model ppt powerpoint presentation designs download. This is a eleven stage process. The stages in this process are email, display, brand paid search, comparison shopping, business, non brand paid search.
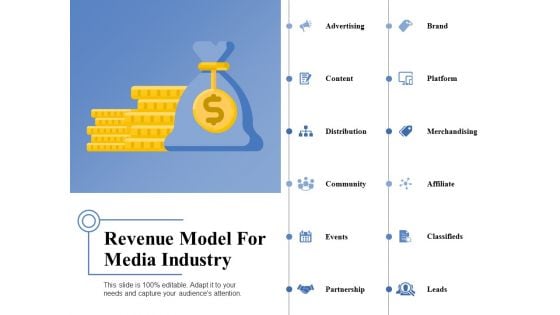
Revenue Model For Media Industry Ppt PowerPoint Presentation Outline Topics
This is a revenue model for media industry ppt powerpoint presentation outline topics. This is a twelve stage process. The stages in this process are advertising, content, distribution, community, events.
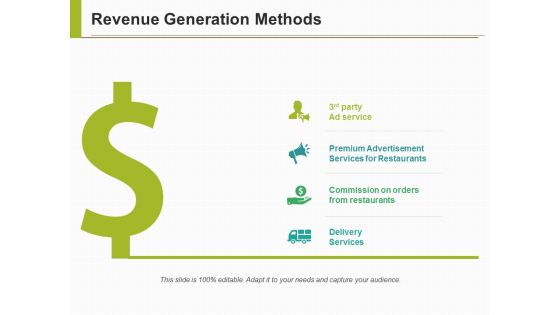
Revenue Generation Methods Ppt PowerPoint Presentation Slides Tips
This is a revenue generation methods ppt powerpoint presentation slides tips. This is a four stage process. The stages in this process are premium advertisement services for restaurants, commission on orders from restaurants, delivery services.
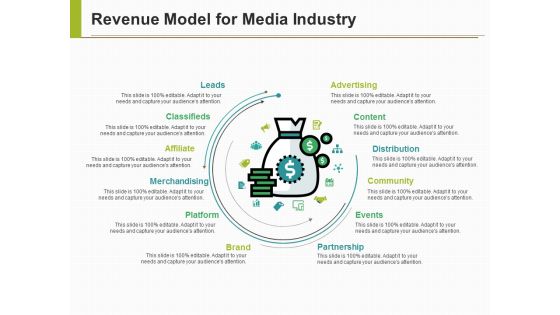
Revenue Model For Media Industry Ppt PowerPoint Presentation Ideas Guide
This is a revenue model for media industry ppt powerpoint presentation ideas guide. This is a one stage process. The stages in this process are leads, classifieds, affiliate, merchandising, platform.
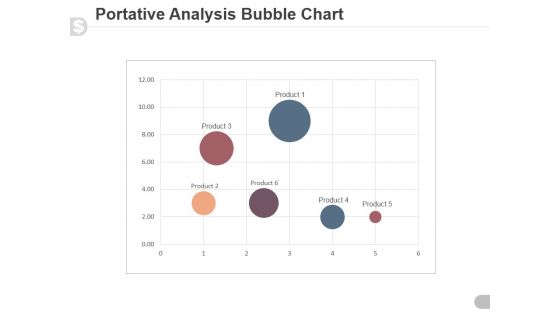
Portative Analysis Bubble Chart Ppt PowerPoint Presentation Slide
This is a portative analysis bubble chart ppt powerpoint presentation slide. This is a six stage process. The stages in this process are portative, analysis, business, graph, bubble chart.


 Continue with Email

 Home
Home


