Financial Technology

Column Chart Ppt PowerPoint Presentation Styles Graphic Tips
This is a column chart ppt powerpoint presentation styles graphic tips. This is a six stage process. The stages in this process are slide bar, business, marketing, strategy, finance.
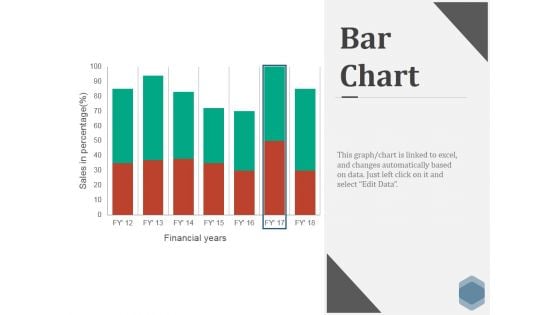
Bar Chart Ppt PowerPoint Presentation Infographics Skills
This is a bar chart ppt powerpoint presentation infographics skills. This is a seven stage process. The stages in this process are business, marketing, strategy, finance, bar.
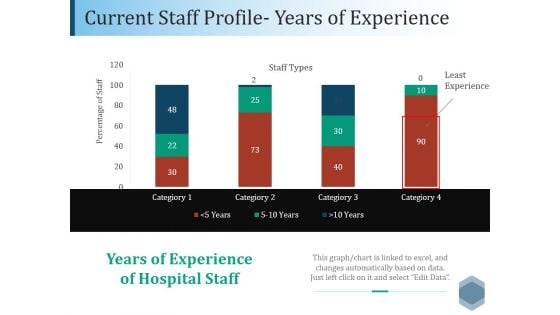
Current Staff Profile Years Of Experience Ppt PowerPoint Presentation File Graphics Tutorials
This is a current staff profile years of experience ppt powerpoint presentation file graphics tutorials. This is a four stage process. The stages in this process are business, marketing, strategy, finance, bar.
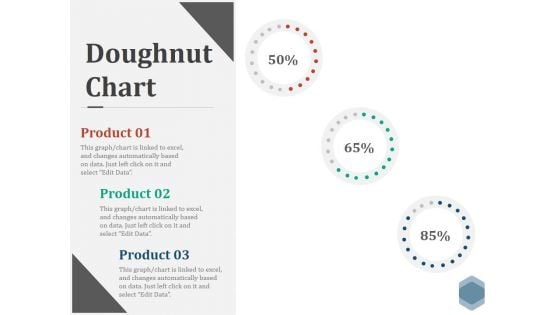
Doughnut Chart Ppt PowerPoint Presentation Visual Aids Files
This is a doughnut chart ppt powerpoint presentation visual aids files. This is a three stage process. The stages in this process are finance, donut, percentage, business, marketing.
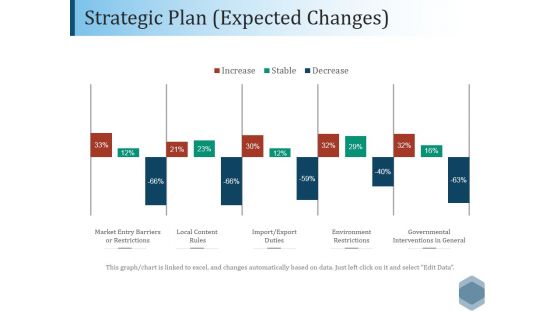
Strategic Plan Expected Changes Ppt PowerPoint Presentation Pictures Outline
This is a strategic plan expected changes ppt powerpoint presentation pictures outline. This is a five stage process. The stages in this process are market entry barriers or restrictions, local content, rules, import export, duties, environment restrictions, governmental interventions in general.
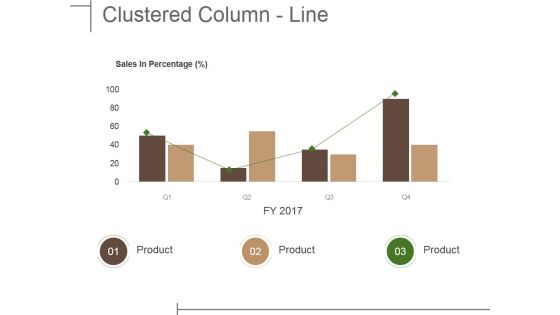
Clustered Column Line Ppt PowerPoint Presentation File Shapes
This is a clustered column line ppt powerpoint presentation file shapes. This is a four stage process. The stages in this process are business, marketing, strategy, bar, success.
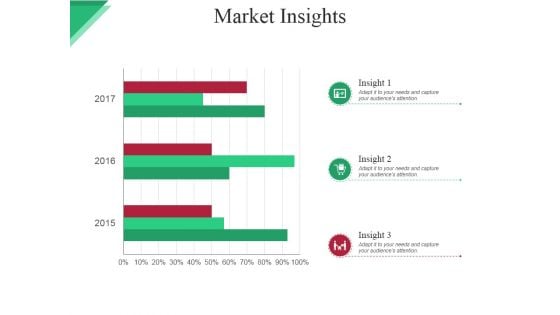
Market Insights Ppt PowerPoint Presentation Infographics Graphics
This is a market insights ppt powerpoint presentation infographics graphics. This is a three stage process. The stages in this process are icons, business, bar, marketing, strategy.
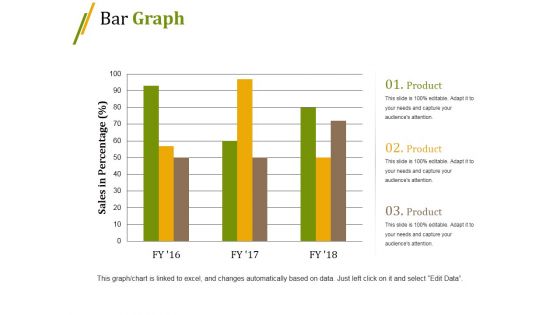
Bar Graph Ppt PowerPoint Presentation Professional Gridlines
This is a bar graph ppt powerpoint presentation professional gridlines. This is a three stage process. The stages in this process are bar, marketing, strategy, planning, growth.
Brand Tracking Info Graphics Ppt PowerPoint Presentation Model Example
This is a brand tracking info graphics ppt powerpoint presentation model example. This is a four stage process. The stages in this process are finance, marketing, percentage, business, icons.
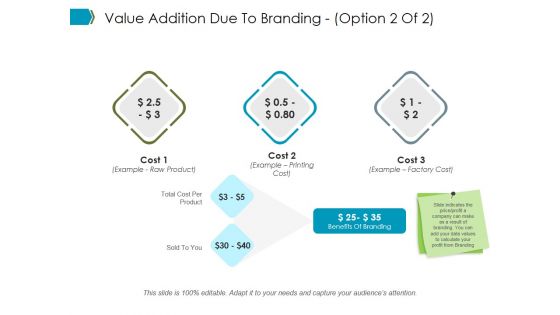
Value Addition Due To Branding Template 1 Ppt PowerPoint Presentation Pictures Inspiration
This is a value addition due to branding template 1 ppt powerpoint presentation pictures inspiration. This is a three stage process. The stages in this process are business, marketing, strategy, finance, planning.
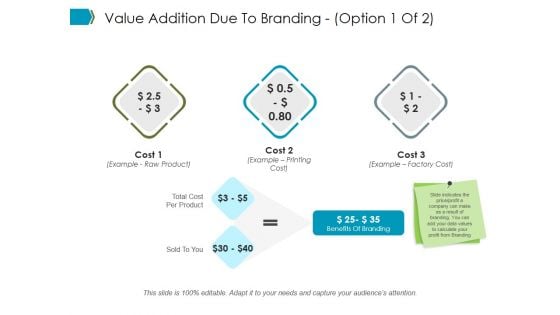
Value Addition Due To Branding Template Ppt PowerPoint Presentation Slide
This is a value addition due to branding template ppt powerpoint presentation slide. This is a three stage process. The stages in this process are business, marketing, strategy, finance, planning.
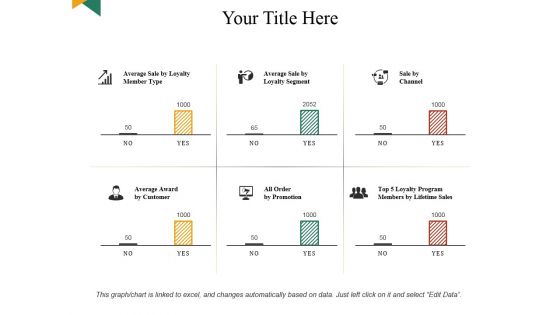
Your Title Here Ppt PowerPoint Presentation Professional File Formats
This is a your title here ppt powerpoint presentation professional file formats. This is a six stage process. The stages in this process are business, marketing, strategy, finance, planning.
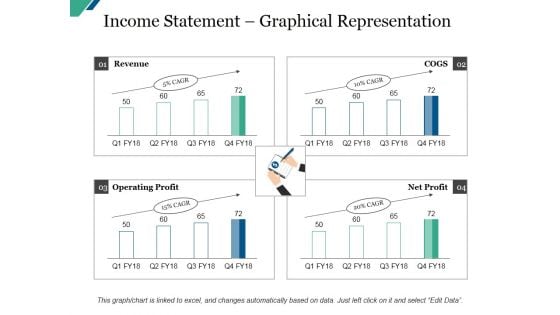
Income Statement Graphical Representation Ppt PowerPoint Presentation Summary Gallery
This is a income statement graphical representation ppt powerpoint presentation summary gallery. This is a four stage process. The stages in this process are current assets, current liabilities, total assets, total liabilities.
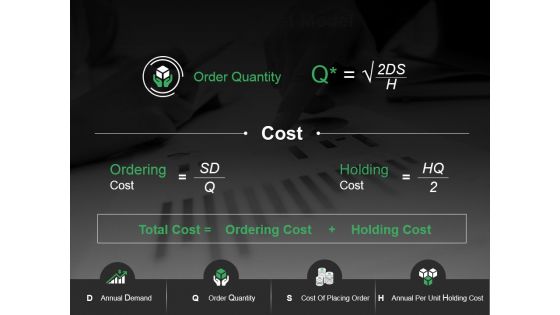
Eoq Cost Model Ppt PowerPoint Presentation Gallery Infographic Template
This is a eoq cost model ppt powerpoint presentation gallery infographic template. This is a two stage process. The stages in this process are ordering cost, holding cost, order quantity, total cost, order quantity.
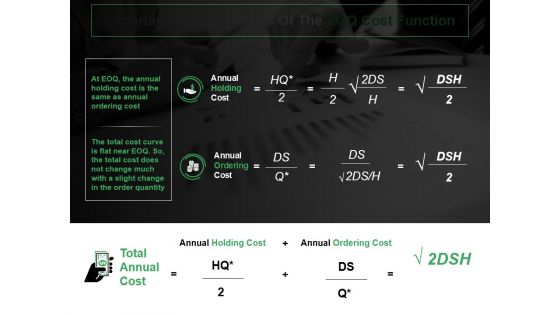
Important Characteristics Of The Eoq Cost Function Ppt PowerPoint Presentation Diagram Images
This is a important characteristics of the eoq cost function ppt powerpoint presentation diagram images. This is a two stage process. The stages in this process are annual holding cos, annual ordering cost, total annual cost.
Health Scorecard Ppt PowerPoint Presentation Layouts Icons
This is a health scorecard ppt powerpoint presentation layouts icons. This is a three stage process. The stages in this process are plan, marketing, finance, planning, strategy.
Company Xx Has Wide Range Of Products Services Ppt PowerPoint Presentation Inspiration Topics
This is a company xx has wide range of products services ppt powerpoint presentation inspiration topics. This is a three stage process. The stages in this process are business, marketing, strategy, planning, finance.
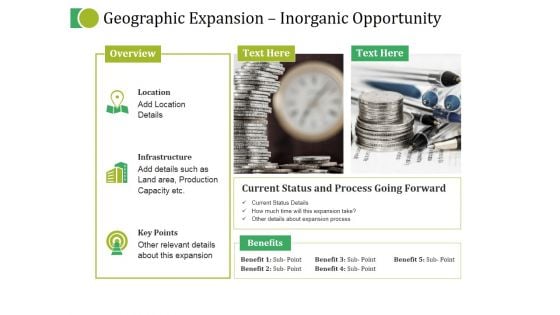
Geographic Expansion Inorganic Opportunity Ppt PowerPoint Presentation Summary
This is a geographic expansion inorganic opportunity ppt powerpoint presentation summary. This is a three stage process. The stages in this process are overview, benefits, current status and process going forward, location, infrastructure.
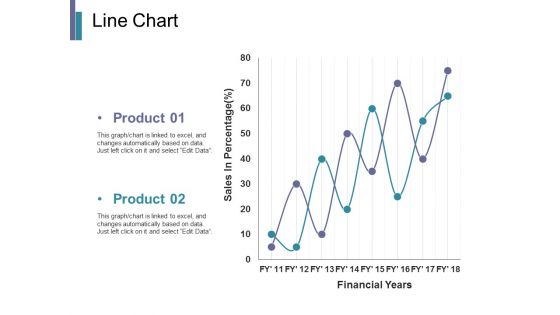
Line Chart Ppt PowerPoint Presentation Portfolio Inspiration
This is a line chart ppt powerpoint presentation portfolio inspiration. This is a two stage process. The stages in this process are business, marketing, strategy, planning, finance.
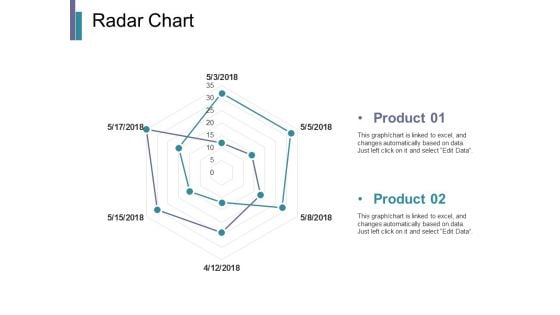
Radar Chart Ppt PowerPoint Presentation Infographics Pictures
This is a radar chart ppt powerpoint presentation infographics pictures. This is a two stage process. The stages in this process are business, marketing, strategy, planning, finance.
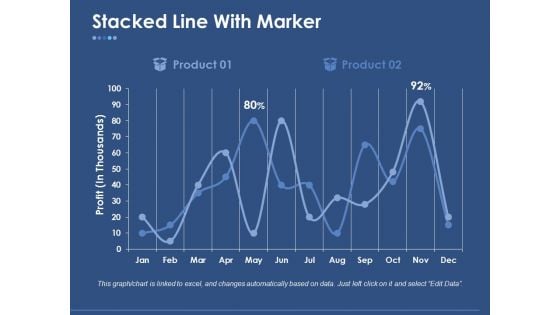
Stacked Line With Marker Ppt PowerPoint Presentation Layouts Summary
This is a stacked line with marker ppt powerpoint presentation layouts summary. This is a two stage process. The stages in this process are finance, marketing, strategy, planning, management.
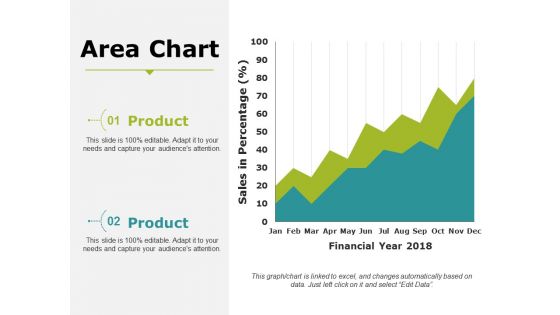
Area Chart Ppt PowerPoint Presentation Infographic Template Portrait
This is a area chart ppt powerpoint presentation infographic template portrait. This is a two stage process. The stages in this process are business, marketing, strategy, planning, finance.
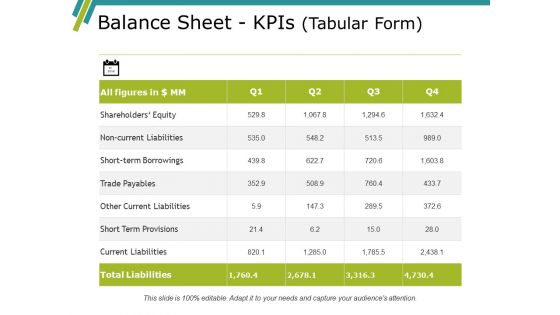
Balance Sheet Kpis Template 1 Ppt PowerPoint Presentation Professional Graphics Download
This is a balance sheet kpis template 1 ppt powerpoint presentation professional graphics download. This is a four stage process. The stages in this process are current assets, current liabilities, total assets, total liabilities.
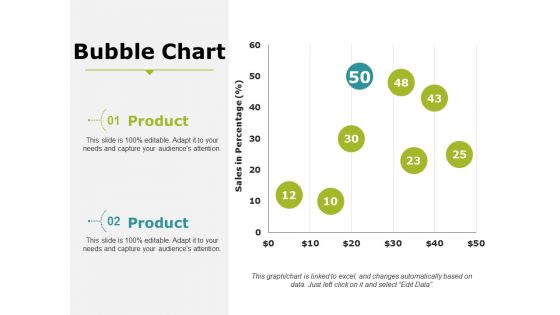
Bubble Chart Ppt PowerPoint Presentation Portfolio Show
This is a bubble chart ppt powerpoint presentation portfolio show. This is a two stage process. The stages in this process are business, marketing, strategy, planning, finance.
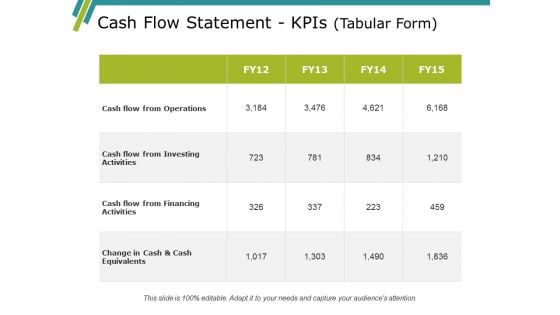
Cash Flow Statement Kpis Template Ppt PowerPoint Presentation Pictures Diagrams
This is a cash flow statement kpis template ppt powerpoint presentation pictures diagrams. This is a four stage process. The stages in this process are operations, financing activities, investing activities, net increase in cash.
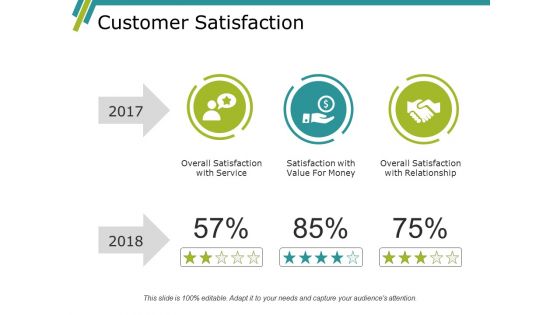
Customer Satisfaction Ppt PowerPoint Presentation Gallery Rules
This is a customer satisfaction ppt powerpoint presentation gallery rules. This is a three stage process. The stages in this process are business, marketing, strategy, planning, finance.

Taxation Ppt PowerPoint Presentation Infographics Graphics Example
This is a taxation ppt powerpoint presentation infographics graphics example. This is a one stage process. The stages in this process are finance, marketing, strategy, management, planning.
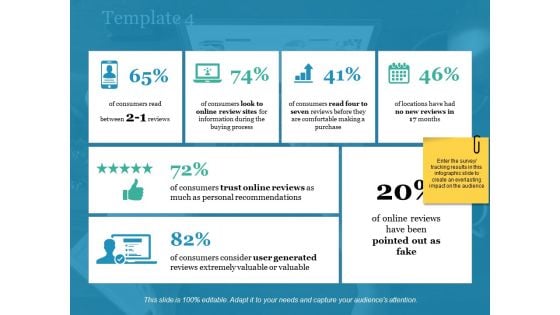
Template 4 Ppt PowerPoint Presentation Summary Demonstration
This is a template 4 ppt powerpoint presentation summary demonstration. This is a six stage process. The stages in this process are look to online review sites, read four to seven reviews before, no new reviews in 17, pointed out as fake.
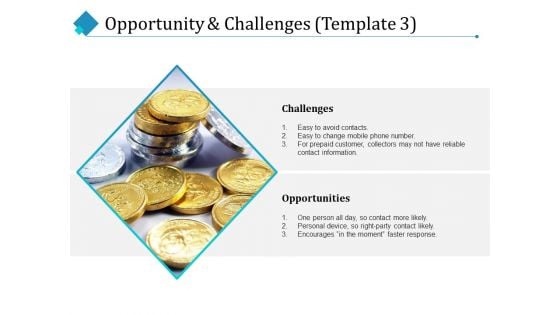
Opportunity And Challenges Finance Ppt PowerPoint Presentation Layouts Format
This is a opportunity and challenges finance ppt powerpoint presentation layouts format. This is a two stage process. The stages in this process are challenges, opportunities, business, planning, marketing.
Cash Flow Green Drop With Dollar Symbol Ppt PowerPoint Presentation Professional Graphic Tips
This is a cash flow green drop with dollar symbol ppt powerpoint presentation professional graphic tips. This is a four stage process. The stages in this process are liquidity, cash assets, solvency.
Quality Audit Report Vector Icon Ppt PowerPoint Presentation Slides Graphics PDF
Presenting this set of slides with name quality audit report vector icon ppt powerpoint presentation slides graphics pdf. This is a three stage process. The stages in this process are quality audit report vector icon. This is a completely editable PowerPoint presentation and is available for immediate download. Download now and impress your audience.
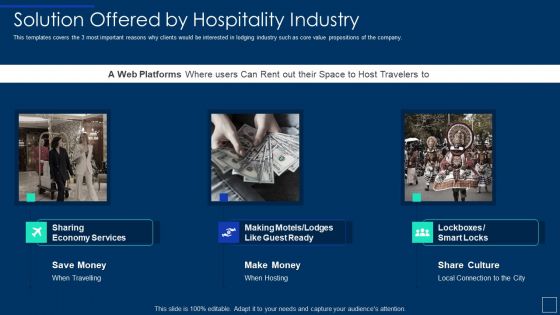
Solution Offered By Hospitality Industry Ppt Guidelines PDF
This templates covers the 3 most important reasons why clients would be interested in lodging industry such as core value propositions of the company. Presenting solution offered by hospitality industry ppt guidelines pdf to provide visual cues and insights. Share and navigate important information on three stages that need your due attention. This template can be used to pitch topics like solution offered by hospitality industry . In addtion, this PPT design contains high resolution images, graphics, etc, that are easily editable and available for immediate download.
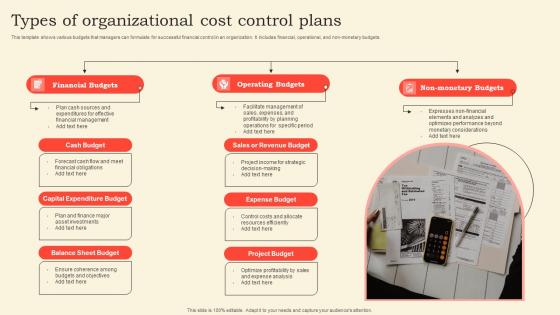
Types Of Organizational Cost Control Plans Inspiration Pdf
This template shows various budgets that managers can formulate for successful financial control in an organization. It includes financial, operational, and non monetary budgets. Pitch your topic with ease and precision using this Types Of Organizational Cost Control Plans Inspiration Pdf. This layout presents information on Financial Budgets, Cash Budget, Expenditure Budget. It is also available for immediate download and adjustment. So, changes can be made in the color, design, graphics or any other component to create a unique layout. This template shows various budgets that managers can formulate for successful financial control in an organization. It includes financial, operational, and non monetary budgets.
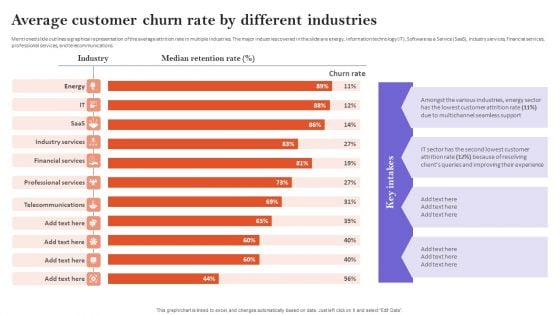
Average Customer Churn Rate By Different Industries Designs PDF
Mentioned slide outlines a graphical representation of the average attrition rate in multiple industries. The major industries covered in the slide are energy, information technology IT, Software as a Service SaaS, industry services, financial services, professional services, and telecommunications. Slidegeeks is one of the best resources for PowerPoint templates. You can download easily and regulate Average Customer Churn Rate By Different Industries Designs PDF for your personal presentations from our wonderful collection. A few clicks is all it takes to discover and get the most relevant and appropriate templates. Use our Templates to add a unique zing and appeal to your presentation and meetings. All the slides are easy to edit and you can use them even for advertisement purposes.
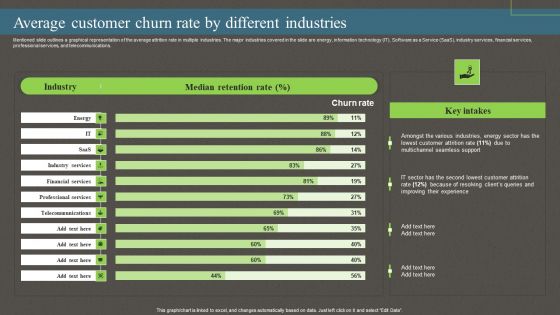
Average Customer Churn Rate By Different Industries Ppt PowerPoint Presentation File Example PDF
Mentioned slide outlines a graphical representation of the average attrition rate in multiple industries. The major industries covered in the slide are energy, information technology IT, Software as a Service SaaS, industry services, financial services, professional services, and telecommunications. Whether you have daily or monthly meetings, a brilliant presentation is necessary. Average Customer Churn Rate By Different Industries Ppt PowerPoint Presentation File Example PDF can be your best option for delivering a presentation. Represent everything in detail using Average Customer Churn Rate By Different Industries Ppt PowerPoint Presentation File Example PDF and make yourself stand out in meetings. The template is versatile and follows a structure that will cater to your requirements. All the templates prepared by Slidegeeks are easy to download and edit. Our research experts have taken care of the corporate themes as well. So, give it a try and see the results.
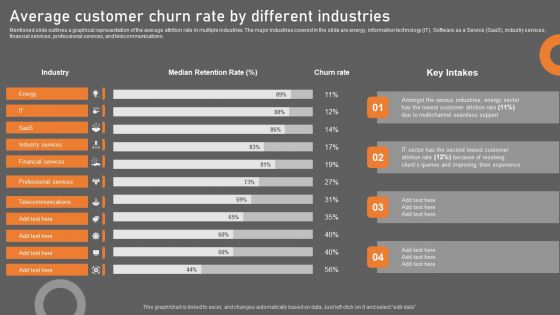
Average Customer Churn Rate By Different Industries Diagrams PDF
Mentioned slide outlines a graphical representation of the average attrition rate in multiple industries. The major industries covered in the slide are energy, information technology IT, Software as a Service SaaS, industry services, financial services, professional services, and telecommunications. Presenting this PowerPoint presentation, titled Average Customer Churn Rate By Different Industries Diagrams PDF, with topics curated by our researchers after extensive research. This editable presentation is available for immediate download and provides attractive features when used. Download now and captivate your audience. Presenting this Average Customer Churn Rate By Different Industries Diagrams PDF. Our researchers have carefully researched and created these slides with all aspects taken into consideration. This is a completely customizable Average Customer Churn Rate By Different Industries Diagrams PDF that is available for immediate downloading. Download now and make an impact on your audience. Highlight the attractive features available with our PPTs.
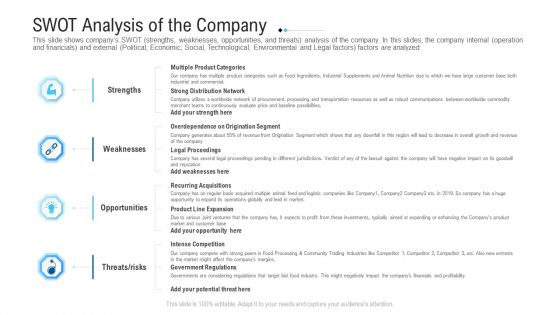
Funding Deck To Raise Grant Funds From Public Organizations SWOT Analysis Of The Company Background PDF
This slide shows companys SWOT strengths, weaknesses, opportunities, and threats analysis of the company. In this slides, the company internal operation and financials and external Political, Economic, Social, Technological, Environmental and Legal factors factors are analyzed. This is a funding deck to raise grant funds from public organizations SWOT analysis of the company background pdf template with various stages. Focus and dispense information on four stages using this creative set, that comes with editable features. It contains large content boxes to add your information on topics like origination segment, product line expansion, intense competition, opportunity, multiple product categories. You can also showcase facts, figures, and other relevant content using this PPT layout. Grab it now.
Mode Of Finance Description Sample Ppt PowerPoint Presentation Example 2015
This is a mode of finance description sample ppt powerpoint presentation example 2015. This is a four stage process. The stages in this process are mode of finance, financial description, financial modes.
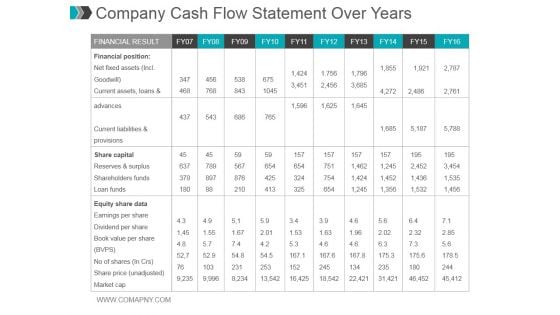
Company Cash Flow Statement Over Years Ppt PowerPoint Presentation Gallery
This is a company cash flow statement over years ppt powerpoint presentation gallery. This is ten stage process. The stages in this process are financial result, financial position, share capital, equity share data.
Decision Making Process In Managerial Economics PPT PowerPoint Presentation Complete Deck With Slides
This is a decision making process in managerial economics ppt powerpoint presentation complete deck with slides. This is a one stage process. The stages in this process are financial, financial analysis, economics, decision, process making.
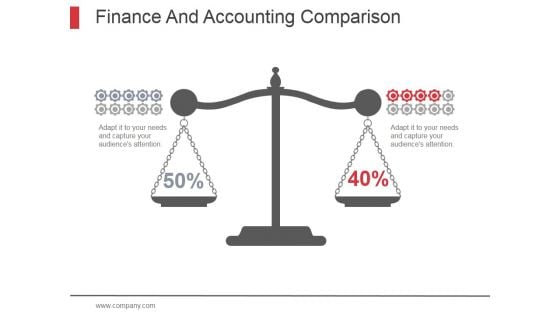
Finance And Accounting Comparison Ppt PowerPoint Presentation Gallery
This is a finance and accounting comparison ppt powerpoint presentation gallery. This is a two stage process. The stages in this process are financial planning, accounting comparison, financial comparison.

Magnifying Glass Ppt PowerPoint Presentation Designs Download
This is a magnifying glass ppt powerpoint presentation designs download. This is a two stage process. The stages in this process are magnifying glass, business, marketing, finance, management.
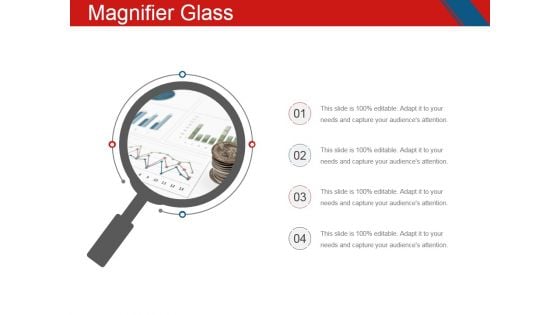
Magnifier Glass Ppt PowerPoint Presentation Inspiration Example
This is a magnifier glass ppt powerpoint presentation inspiration example. This is a four stage process. The stages in this process are magnifying glass, business, marketing, management, planning.

Key Techniques To Enhance Cost Efficiency Strategies For Reducing Wastage Of Time And Money Elements PDF
The slide carries various ways to enhance the cost efficiency of business by reducing the wastage of time and money. Various strategies included are use appropriate technology, implement modern marketing methods, reduce financial expenditure and undertake time management practices Create an editable Key Techniques To Enhance Cost Efficiency Strategies For Reducing Wastage Of Time And Money Elements PDF that communicates your idea and engages your audience. Whether youre presenting a business or an educational presentation, pre designed presentation templates help save time. Key Techniques To Enhance Cost Efficiency Strategies For Reducing Wastage Of Time And Money Elements PDF is highly customizable and very easy to edit, covering many different styles from creative to business presentations. Slidegeeks has creative team members who have crafted amazing templates. So, go and get them without any delay.
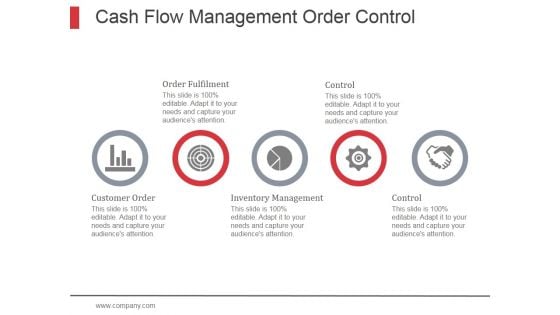
Cash Flow Management Order Control Ppt PowerPoint Presentation Design Ideas
This is a cash flow management order control ppt powerpoint presentation design ideas. This is a five stage process. The stages in this process are management, cash flow management, budget, financial analysis.
Bar Graph Icon For Data Analysis Ppt PowerPoint Presentation Pictures Ideas
This is a bar graph icon for data analysis ppt powerpoint presentation pictures ideas. This is a four stage process. The stages in this process are financial analysis, quantitative, statistical modelling.
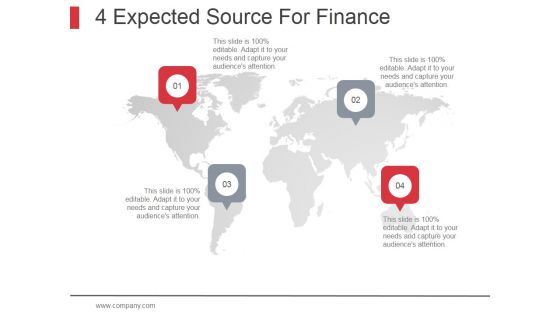
4 Expected Source For Finance Ppt PowerPoint Presentation Tips
This is a 4 expected source for finance ppt powerpoint presentation tips. This is a four stage process. The stages in this process are financial modes, mode of finance.
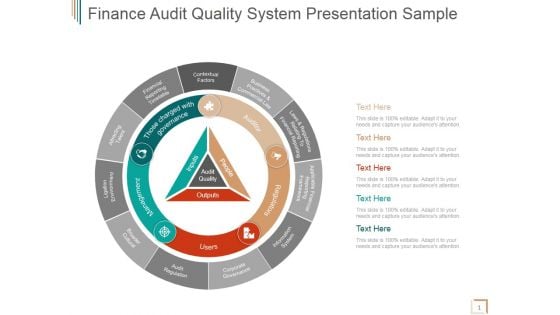
Finance Audit Quality System Ppt PowerPoint Presentation Slides
This is a finance audit quality system ppt powerpoint presentation slides. This is a six stage process. The stages in this process are contextual factors, financial reporting timetable, attracting talent, ligation environment, broader cultural, audit regulation.
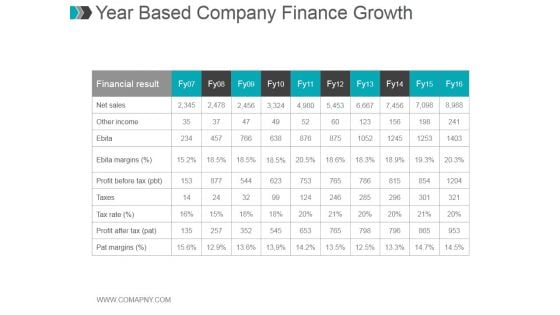
Year Based Company Finance Growth Ppt PowerPoint Presentation Layouts
This is a year based company finance growth ppt powerpoint presentation layouts. This is a ten stage process. The stages in this process are financial result, net sales, other income, ebita, ebita margins, profit before tax, taxes, tax rate, profit after tax, pat margins.
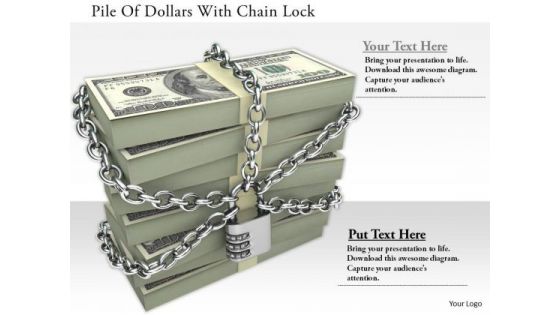
Stock Photo Pile Of Dollars With Chain Lock PowerPoint Slide
This image displays dollars locked with chain. This PowerPoint template contains the concept of financial security. Use this slide to represent topics related to financial security.
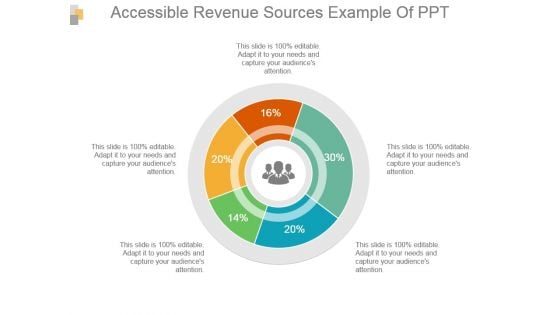
Accessible Revenue Sources Example Of Ppt
This is a accessible revenue sources example of ppt. This is a five stage process. The stages in this process are business, process, financial, percentage, revenue.
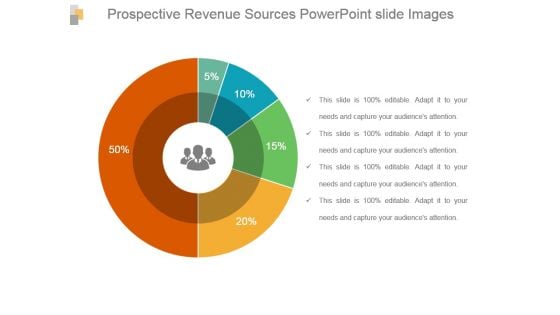
Prospective Revenue Sources Powerpoint Slide Images
This is a prospective revenue sources powerpoint slide images. This is a five stage process. The stages in this process are business, process, financial, percentage, revenue.
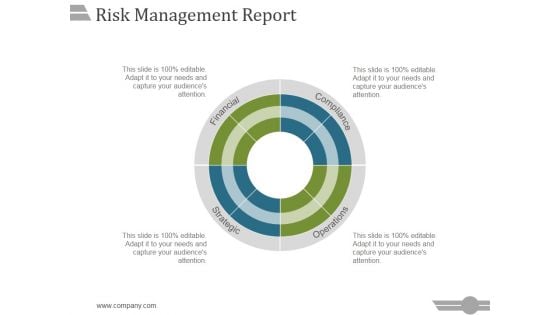
Risk Management Report Template 1 Ppt PowerPoint Presentation Inspiration
This is a risk management report template 1 ppt powerpoint presentation inspiration. This is a four stage process. The stages in this process are financial, compliance, strategic, operations.
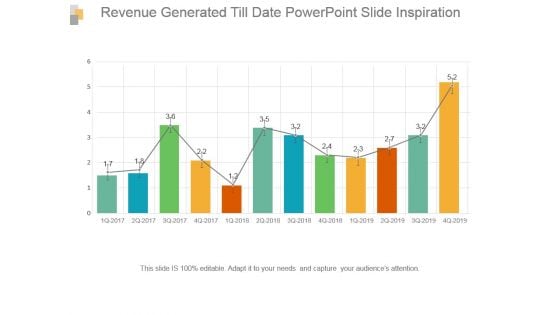
Revenue Generated Till Date Powerpoint Slide Inspiration
This is a revenue generated till date powerpoint slide inspiration. This is a twelve stage process. The stages in this process are bar graph, growth, success, data, analysis.
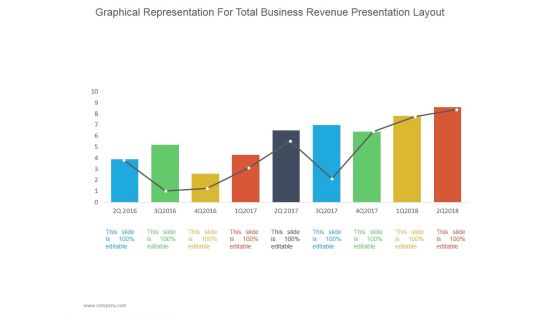
Graphical Representation For Total Business Revenue Ppt PowerPoint Presentation Diagrams
This is a graphical representation for total business revenue ppt powerpoint presentation diagrams. This is a nine stage process. The stages in this process are business, strategy, line chart, bar graph, marketing, management.
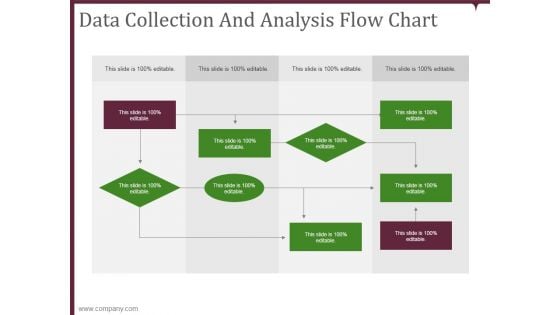
data collection and analysis flow chart ppt powerpoint presentation microsoft
This is a data collection and analysis flow chart ppt powerpoint presentation microsoft. This is a nine stage process. The stages in this process are business, planning, marketing, strategy, management.
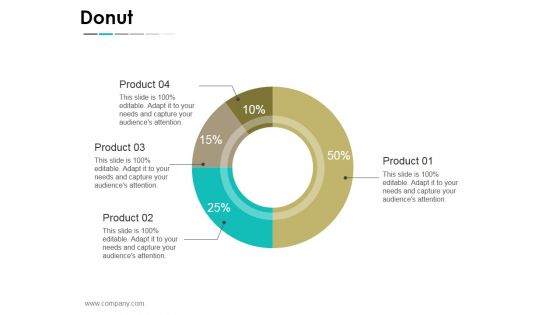
Donut Ppt PowerPoint Presentation Portfolio Examples
This is a donut ppt powerpoint presentation portfolio examples. This is a four stage process. The stages in this process are business, strategy, analysis, planning, donut, product.

Donut Pie Chart Ppt PowerPoint Presentation File Slideshow
This is a donut pie chart ppt powerpoint presentation file slideshow. This is a four stage process. The stages in this process are business, strategy, analysis, planning, donut pie chart.
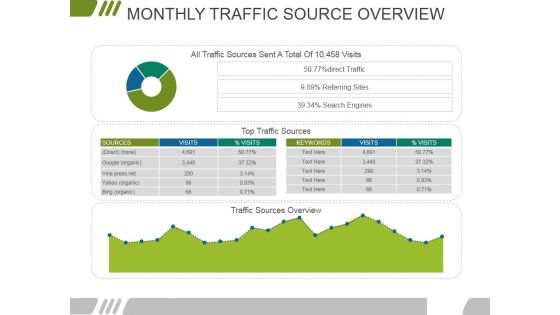
Monthly Traffic Source Overview Ppt PowerPoint Presentation Layouts Show
This is a monthly traffic source overview ppt powerpoint presentation layouts show. This is a three stage process. The stages in this process are google, vine press net, yahoo, bing, sources.
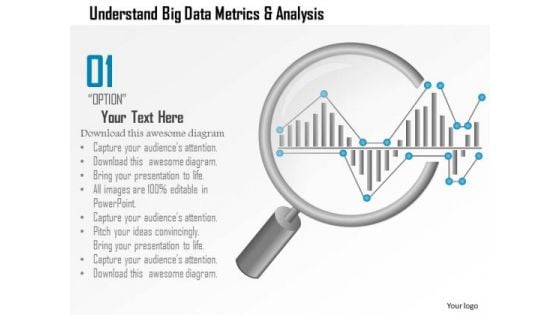
Business Diagram Understand Big Data Metrics And Analysis Showing By Magnifying Glass Ppt Slide
This PPT slide has been designed with big data metrics and magnifying glass. This diagram helps to portray concept of data analysis and data search. Download this diagram to make professional presentations.


 Continue with Email

 Home
Home


