Financial
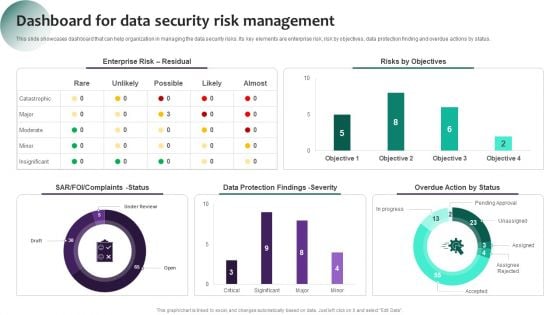
Information Systems Security And Risk Management Plan Dashboard For Data Security Risk Management Information PDF
This slide showcases dashboard that can help organization in managing the data security risks. Its key elements are enterprise risk, risk by objectives, data protection finding and overdue actions by status. If you are looking for a format to display your unique thoughts, then the professionally designed Information Systems Security And Risk Management Plan Dashboard For Data Security Risk Management Information PDF is the one for you. You can use it as a Google Slides template or a PowerPoint template. Incorporate impressive visuals, symbols, images, and other charts. Modify or reorganize the text boxes as you desire. Experiment with shade schemes and font pairings. Alter, share or cooperate with other people on your work. Download Information Systems Security And Risk Management Plan Dashboard For Data Security Risk Management Information PDF and find out how to give a successful presentation. Present a perfect display to your team and make your presentation unforgettable.
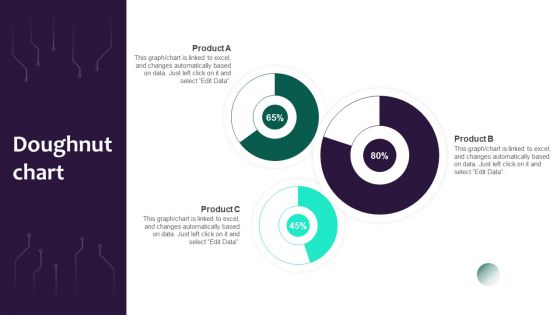
Information Systems Security And Risk Management Plan Doughnut Chart Rules PDF
Are you in need of a template that can accommodate all of your creative concepts This one is crafted professionally and can be altered to fit any style. Use it with Google Slides or PowerPoint. Include striking photographs, symbols, depictions, and other visuals. Fill, move around, or remove text boxes as desired. Test out color palettes and font mixtures. Edit and save your work, or work with colleagues. Download Information Systems Security And Risk Management Plan Doughnut Chart Rules PDF and observe how to make your presentation outstanding. Give an impeccable presentation to your group and make your presentation unforgettable.
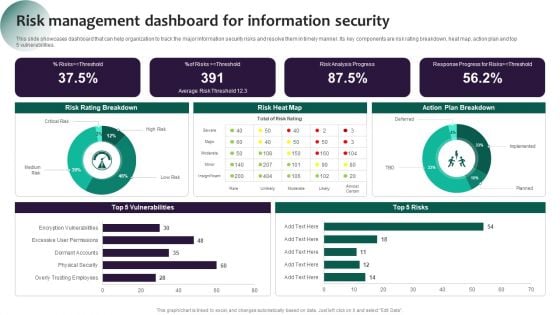
Information Systems Security And Risk Management Plan Risk Management Dashboard For Information Security Pictures PDF
This slide showcases dashboard that can help organization to track the major information security risks and resolve them in timely manner. Its key components are risk rating breakdown, heat map, action plan and top 5 vulnerabilities. The best PPT templates are a great way to save time, energy, and resources. Slidegeeks have 100 percent editable powerpoint slides making them incredibly versatile. With these quality presentation templates, you can create a captivating and memorable presentation by combining visually appealing slides and effectively communicating your message. Download Information Systems Security And Risk Management Plan Risk Management Dashboard For Information Security Pictures PDF from Slidegeeks and deliver a wonderful presentation.
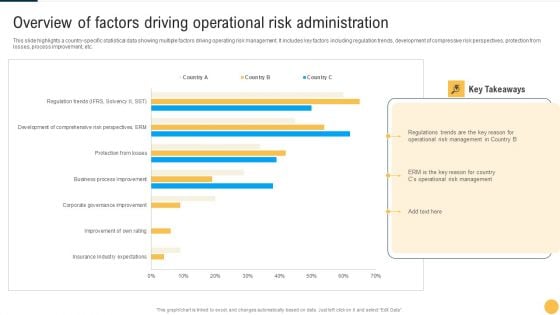
Overview Of Factors Driving Operational Risk Administration Summary PDF
This slide highlights a country specific statistical data showing multiple factors driving operating risk management. It includes key factors including regulation trends, development of compressive risk perspectives, protection from losses, process improvement, etc. Pitch your topic with ease and precision using this Overview Of Factors Driving Operational Risk Administration Summary PDF This layout presents information on Key Takeaways, Risk Management, Administration. It is also available for immediate download and adjustment. So, changes can be made in the color, design, graphics or any other component to create a unique layout.
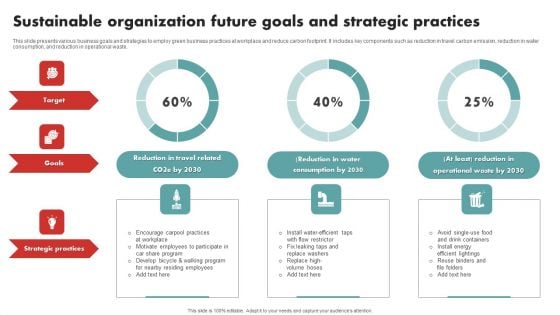
Sustainable Organization Future Goals And Strategic Practices Sample PDF
This slide presents various business goals and strategies to employ green business practices at workplace and reduce carbon footprint. It includes key components such as reduction in travel carbon emission, reduction in water consumption, and reduction in operational waste. Pitch your topic with ease and precision using this Sustainable Organization Future Goals And Strategic Practices Sample PDF This layout presents information on Goals, Target, Strategic Practices. It is also available for immediate download and adjustment. So, changes can be made in the color, design, graphics or any other component to create a unique layout.
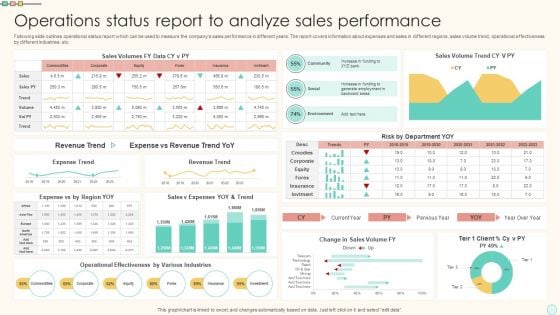
Operations Status Report To Analyze Sales Performance Portrait PDF
Following slide outlines operational status report which can be used to measure the companys sales performance in different years. The report covers information about expenses and sales in different regions, sales volume trend, operational effectiveness by different industries, etc. Showcasing this set of slides titled Operations Status Report To Analyze Sales Performance Portrait PDF. The topics addressed in these templates are Operations Status Report, Analyze Sales Performance. All the content presented in this PPT design is completely editable. Download it and make adjustments in color, background, font etc. as per your unique business setting.
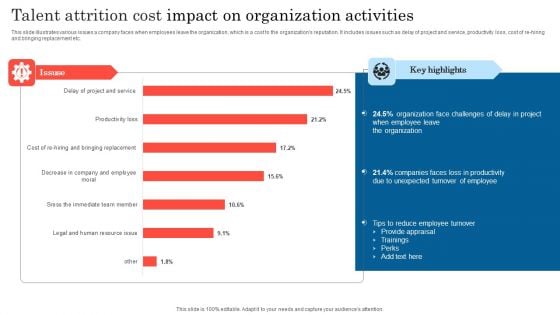
Talent Attrition Cost Impact On Organization Activities Ideas PDF
This slide illustrates various issues a company faces when employees leave the organization, which is a cost to the organizations reputation. It includes issues such as delay of project and service, productivity loss, cost of re-hiring and bringing replacement etc. Showcasing this set of slides titled Talent Attrition Cost Impact On Organization Activities Ideas PDF. The topics addressed in these templates are Organization, Employee Leave, Productivity. All the content presented in this PPT design is completely editable. Download it and make adjustments in color, background, font etc. as per your unique business setting.
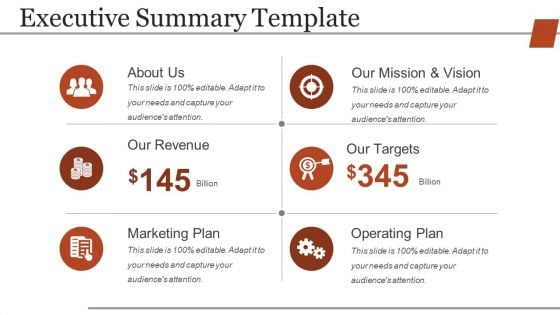
Executive Summary Template Ppt PowerPoint Presentation Slides Themes
This is a executive summary template ppt powerpoint presentation slides themes. This is a six stage process. The stages in this process are about us, our revenue, marketing plan, our mission and vision, our targets, operating plan.
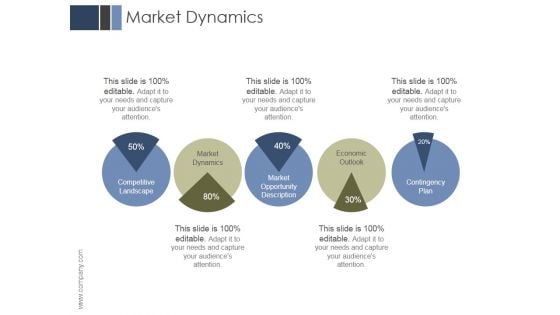
Market Dynamics Ppt PowerPoint Presentation Influencers
This is a market dynamics ppt powerpoint presentation influencers. This is a five stage process. The stages in this process are competitive landscape, market dynamics, market opportunity description, economic outlook, contingency plan.
Business Diagram Icons For Integrated Business Model Presentation Template
This business diagram has been designed with graphics of computer screen with tags. This diagram can be used to depict integrated business model. Download this diagram slide to make professional presentations.
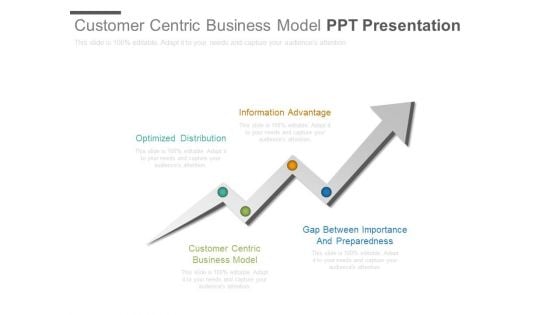
Customer Centric Business Model Ppt Presentation
This is a customer centric business model ppt presentation. This is a four stage process. The stages in this process are success, arrows, business.
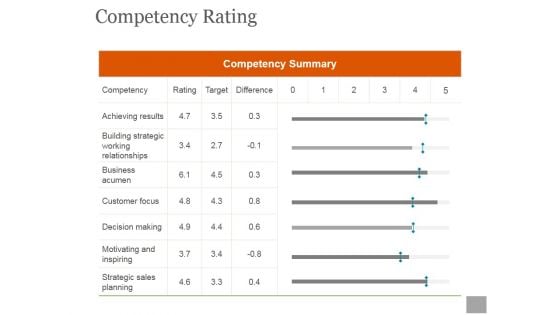
Competency Rating Ppt PowerPoint Presentation Designs
This is a competency rating ppt powerpoint presentation designs. This is a eight stage process. The stages in this process are managerial efficiency, resource planning, develop and implements, financial accounting, financial analysis.
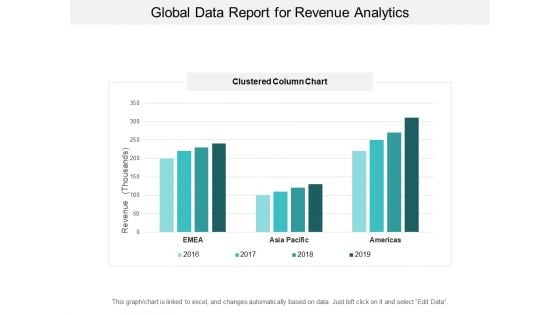
Global Data Report For Revenue Analytics Ppt PowerPoint Presentation Inspiration Visuals
This is a global data report for revenue analytics ppt powerpoint presentation inspiration visuals. This is a four stage process. The stages in this process are financial analysis, quantitative, statistical modelling.
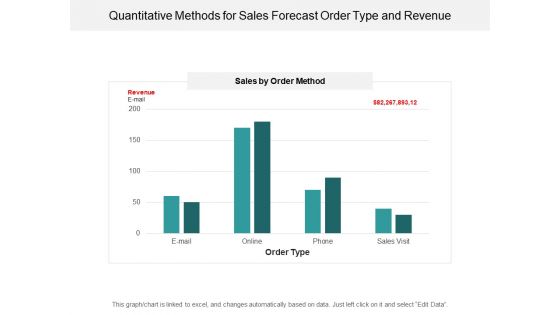
Quantitative Methods For Sales Forecast Order Type And Revenue Ppt PowerPoint Presentation Styles Show
This is a quantitative methods for sales forecast order type and revenue ppt powerpoint presentation styles show. This is a four stage process. The stages in this process are financial analysis, quantitative, statistical modelling.
Target Market Ppt PowerPoint Presentation Sample
This is a target market ppt powerpoint presentation sample. This is a four stage process. The stages in this process are competitive brands market share, target market shares, financial years.
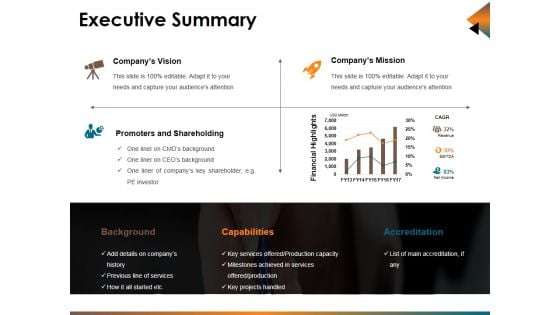
Executive Summary Ppt PowerPoint Presentation Styles Professional
This is a executive summary ppt powerpoint presentation styles professional. This is a four stage process. The stages in this process are company vision, promoters and shareholding, company mission, financial highlights.
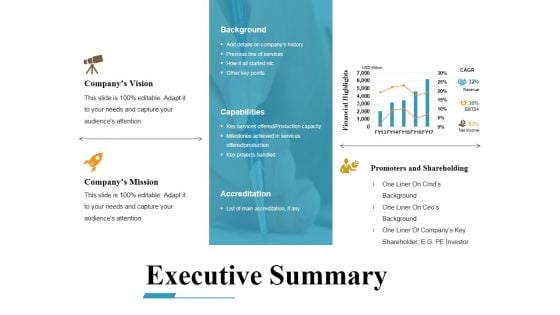
Executive Summary Ppt PowerPoint Presentation Ideas Example File
This is a executive summary ppt powerpoint presentation ideas example file. This is a three stage process. The stages in this process are company vision, company mission, promoters and shareholding, financial highlights.
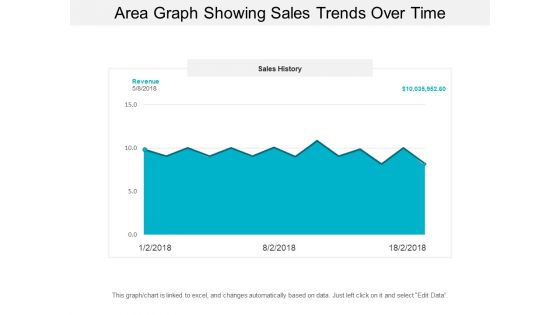
Area Graph Showing Sales Trends Over Time Ppt PowerPoint Presentation Model Background Designs
This is a area graph showing sales trends over time ppt powerpoint presentation model background designs. This is a three stage process. The stages in this process are financial analysis, quantitative, statistical modelling.
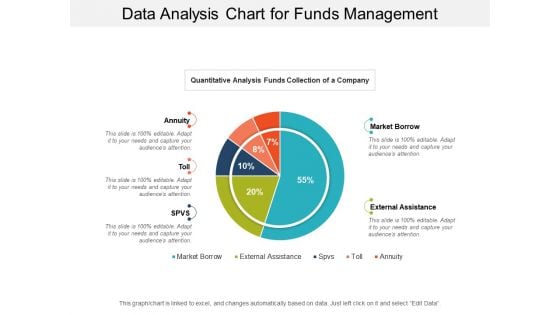
Data Analysis Chart For Funds Management Ppt PowerPoint Presentation Infographic Template Files
This is a data analysis chart for funds management ppt powerpoint presentation infographic template files. This is a five stage process. The stages in this process are financial analysis, quantitative, statistical modelling.
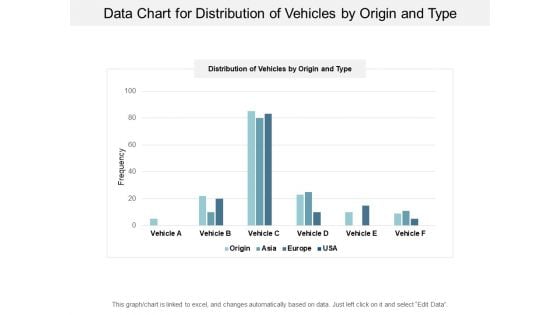
Data Chart For Distribution Of Vehicles By Origin And Type Ppt PowerPoint Presentation Infographics Topics
This is a data chart for distribution of vehicles by origin and type ppt powerpoint presentation infographics topics. This is a four stage process. The stages in this process are financial analysis, quantitative, statistical modelling.
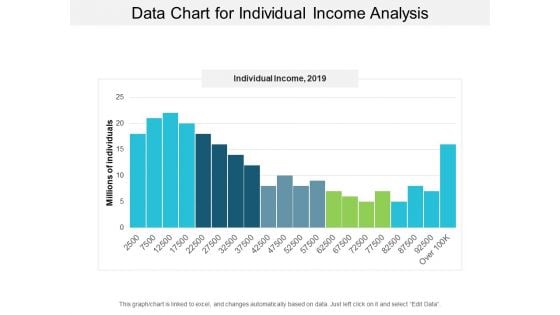
Data Chart For Individual Income Analysis Ppt PowerPoint Presentation Layouts Visual Aids
This is a data chart for individual income analysis ppt powerpoint presentation layouts visual aids. This is a five stage process. The stages in this process are financial analysis, quantitative, statistical modelling.
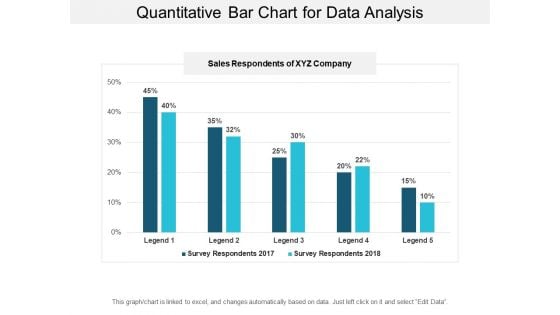
Quantitative Bar Chart For Data Analysis Ppt PowerPoint Presentation Model Graphic Tips
This is a quantitative bar chart for data analysis ppt powerpoint presentation model graphic tips. This is a two stage process. The stages in this process are financial analysis, quantitative, statistical modelling.
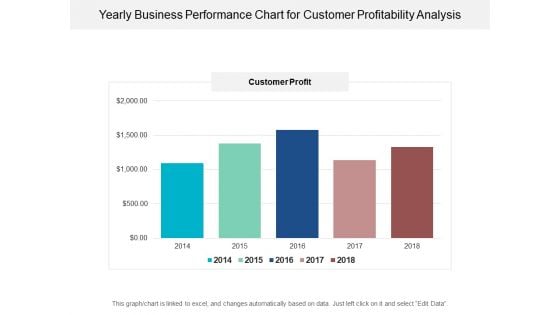
Yearly Business Performance Chart For Customer Profitability Analysis Ppt PowerPoint Presentation Ideas Picture
This is a yearly business performance chart for customer profitability analysis ppt powerpoint presentation ideas picture. This is a five stage process. The stages in this process are financial analysis, quantitative, statistical modelling.
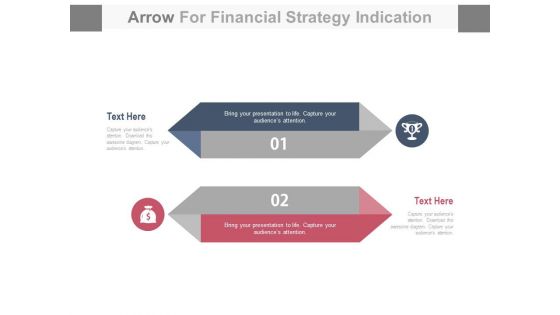
Two Arrows Tags For Financial1 Success Strategy PowerPoint Slides
This PowerPoint Template can be used for multiple purposes. The slide can be a part of your presentation and because of its modern and creative design, it is bound to leave an everlasting impression on the audience. The two figures are vertical diamonds and relevant text and icons can be placed on each side to explain any process. Similarly, you can use the diagram to describe the raw materials and in the diagram, you can explain the process. At the end of the diagram an icon or symbol of the finished or the final product can be placed to explain the conclusion of the process. \n
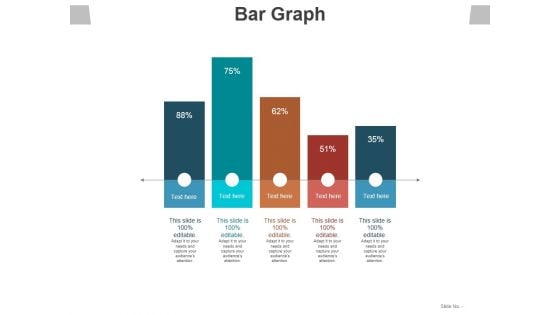
Bar Graph Ppt PowerPoint Presentation Slides Designs
This is a bar graph ppt powerpoint presentation slides designs. This is a five stage process. The stages in this process are bar graph, business, marketing, plan, financial.

Crm Dashboard Current Lead Status Ppt PowerPoint Presentation Guide
This is a crm dashboard current lead status ppt powerpoint presentation guide. This is a six stage process. The stages in this process are business, marketing, success, presentation, financial.
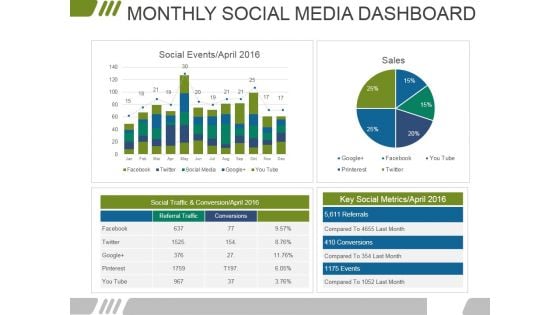
Monthly Social Media Dashboard Ppt PowerPoint Presentation Infographics Files
This is a monthly social media dashboard ppt powerpoint presentation infographics files. This is a four stage process. The stages in this process are marketing, business, financial, data analysis, management.
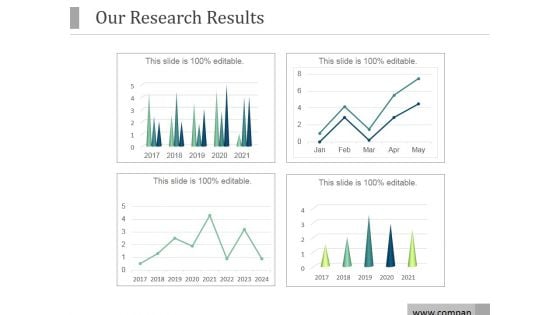
Our Research Results Ppt PowerPoint Presentation Model
This is a our research results ppt powerpoint presentation model. This is a four stage process. The stages in this process are research, financials, business, marketing, management, success.
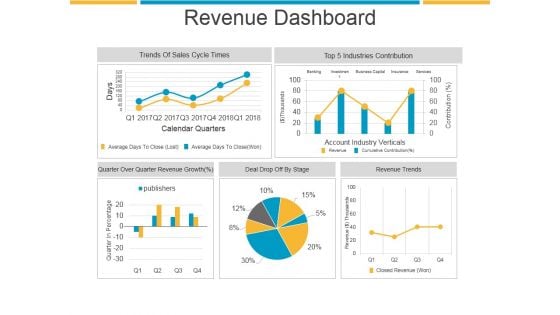
Revenue Dashboard Ppt PowerPoint Presentation Sample
This is a revenue dashboard ppt powerpoint presentation sample. This is a five stage process. The stages in this process are trends of sales cycle times, industries contribution, revenue trends, deal drop off by stage.
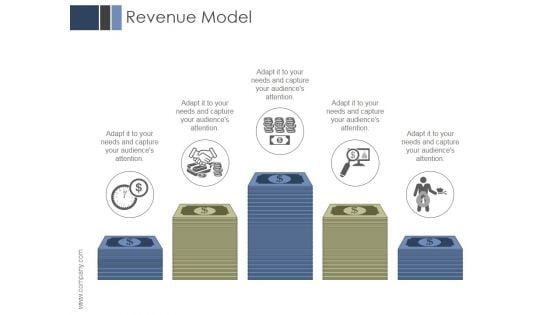
Revenue Model Ppt PowerPoint Presentation Visual Aids
This is a revenue model ppt powerpoint presentation visual aids. This is a five stage process. The stages in this process are business, marketing, management, finance, planning.
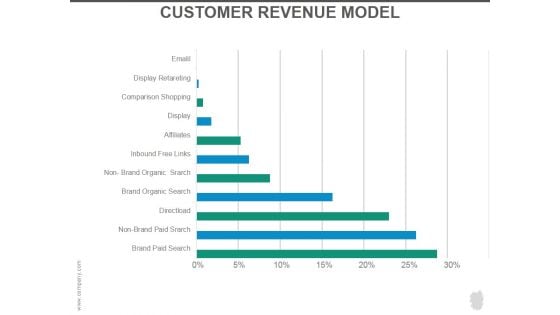
Customer Revenue Model Ppt PowerPoint Presentation Layouts
This is a customer revenue model ppt powerpoint presentation layouts. This is a six stage process. The stages in this process are brand paid search, display, business, email, display retargeting.
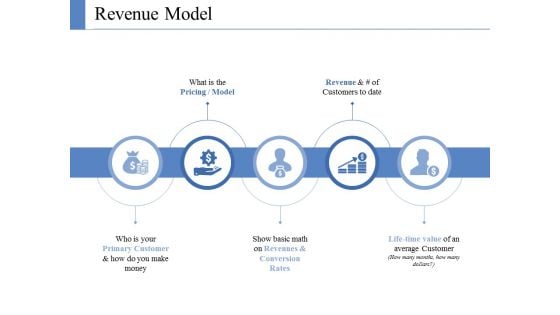
Revenue Model Template Ppt PowerPoint Presentation Ideas Structure
This is a revenue model template ppt powerpoint presentation ideas structure. This is a six stage process. The stages in this process are icons, marketing, strategy, planning, shapes.
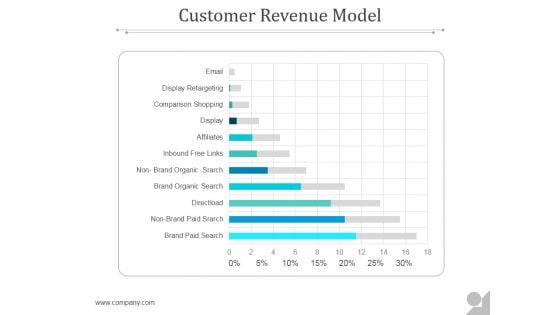
Customer Revenue Model Ppt PowerPoint Presentation Designs Download
This is a customer revenue model ppt powerpoint presentation designs download. This is a eleven stage process. The stages in this process are email, display, brand paid search, comparison shopping, business, non brand paid search.
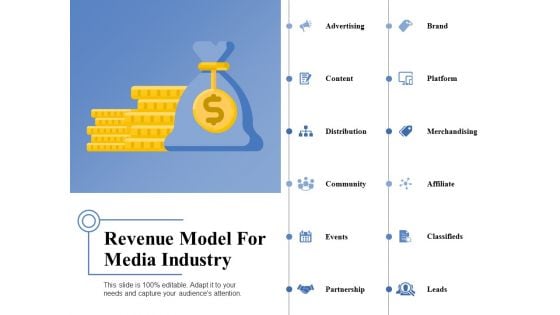
Revenue Model For Media Industry Ppt PowerPoint Presentation Outline Topics
This is a revenue model for media industry ppt powerpoint presentation outline topics. This is a twelve stage process. The stages in this process are advertising, content, distribution, community, events.
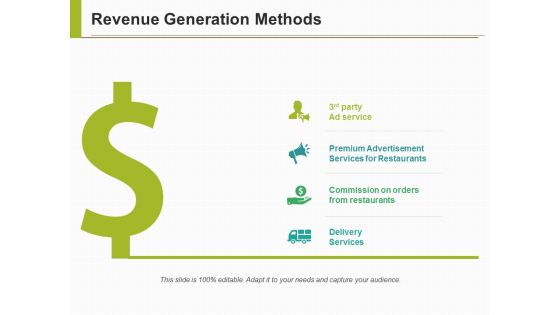
Revenue Generation Methods Ppt PowerPoint Presentation Slides Tips
This is a revenue generation methods ppt powerpoint presentation slides tips. This is a four stage process. The stages in this process are premium advertisement services for restaurants, commission on orders from restaurants, delivery services.
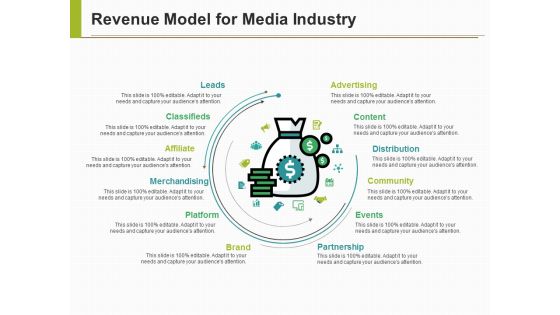
Revenue Model For Media Industry Ppt PowerPoint Presentation Ideas Guide
This is a revenue model for media industry ppt powerpoint presentation ideas guide. This is a one stage process. The stages in this process are leads, classifieds, affiliate, merchandising, platform.
Revenue Cost Per Employee Comparison Ppt PowerPoint Presentation Icon Graphics Tutorials
This is a revenue cost per employee comparison ppt powerpoint presentation icon graphics tutorials. This is a two stage process. The stages in this process are revenue and cost per employee comparison, line chart, business, marketing, success,
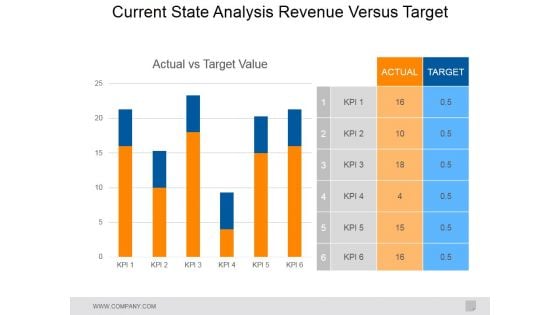
Current State Analysis Revenue Versus Target Ppt PowerPoint Presentation Model Smartart
This is a current state analysis revenue versus target ppt powerpoint presentation model smartart. This is a two stage process. The stages in this process are actual, target, actual vs target value.
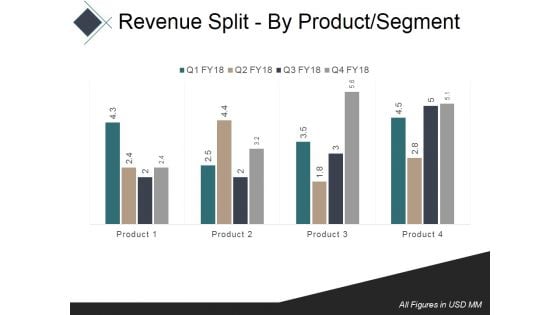
Revenue Split By Product Segment Template 1 Ppt PowerPoint Presentation Summary Example
This is a revenue split by product segment template 1 ppt powerpoint presentation summary example. This is a four stage process. The stages in this process are bar, business, marketing, finance, analysis.
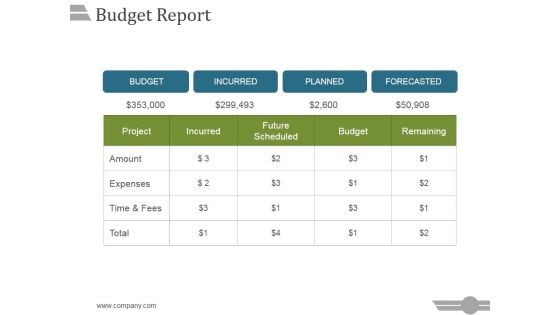
Budget Report Ppt PowerPoint Presentation Topics
This is a budget report ppt powerpoint presentation topics. This is a five stage process. The stages in this process are project, incurred, future scheduled, budget, remaining.

Project Budgeting Ppt PowerPoint Presentation Images
This is a project budgeting ppt powerpoint presentation images. This is a three stage process. The stages in this process are business, marketing, budgeting, finance, management.
Setting A Budget Ppt PowerPoint Presentation Outline Format
This is a setting a budget ppt powerpoint presentation outline format. This is a two stage process. The stages in this process are business, strategy, analysis, budget, finance.
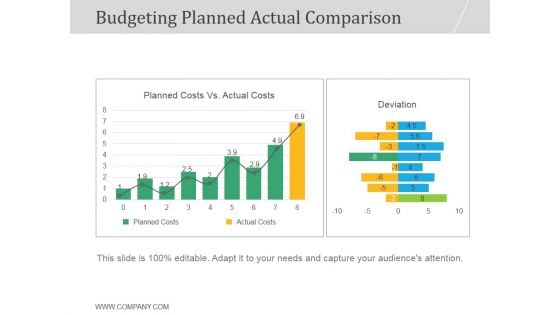
Budgeting Planned Actual Comparison Ppt PowerPoint Presentation Infographic Template
This is a budgeting planned actual comparison ppt powerpoint presentation infographic template. This is a two stage process. The stages in this process are planned costs vs actual costs, deviation, actual costs, planned costs.

Budgeting Planned Actual Comparison Ppt PowerPoint Presentation Graphics
This is a budgeting planned actual comparison ppt powerpoint presentation graphics. This is a two stage process. The stages in this process are value difference, actual cost, planned cost, type of cost.
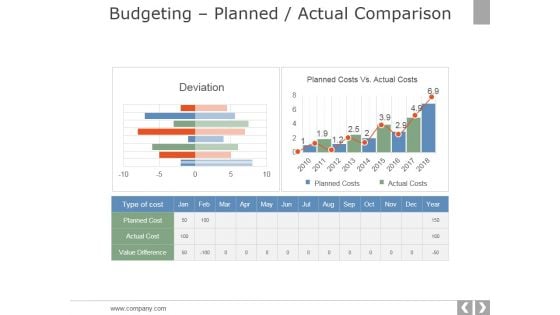
Budgeting Planned Actual Comparison Ppt PowerPoint Presentationpictures Files
This is a budgeting planned actual comparison ppt powerpoint presentationpictures files. This is a two stage process. The stages in this process are deviation, planned costs vs actual costs, planned cost, actual cost.

Budgeting Planned Actual Comparison Ppt PowerPoint Presentation Visual Aids Outline
This is a budgeting planned actual comparison ppt powerpoint presentation visual aids outline. This is a three stage process. The stages in this process are planned cost, actual cost, value difference.
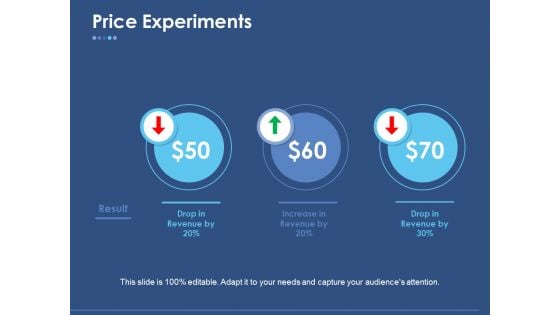
Price Experiments Ppt PowerPoint Presentation Inspiration Background
This is a price experiments ppt powerpoint presentation inspiration background. This is a three stage process. The stages in this process are drop in revenue by, increase in revenue by, result.
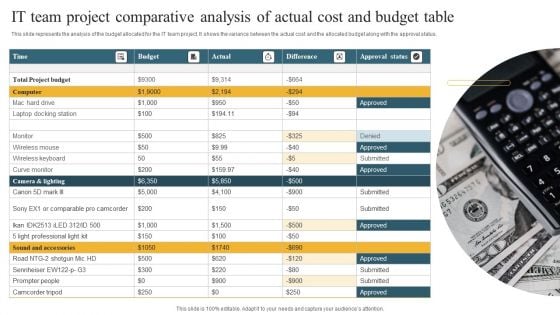
IT Team Project Comparative Analysis Of Actual Cost And Budget Table Template PDF
This slide represents the analysis of the budget allocated for the IT team project. It shows the variance between the actual cost and the allocated budget along with the approval status. Persuade your audience using this IT Team Project Comparative Analysis Of Actual Cost And Budget Table Template PDF. This PPT design covers one stages, thus making it a great tool to use. It also caters to a variety of topics including Budget Table, Actual Cost, Approval Status. Download this PPT design now to present a convincing pitch that not only emphasizes the topic but also showcases your presentation skills.
Software Development Project Comparative Analysis Of Actual Cost And Budget Table Mockup PDF
Presenting Software Development Project Comparative Analysis Of Actual Cost And Budget Table Mockup PDF to dispense important information. This template comprises three stages. It also presents valuable insights into the topics including Software Development, Project Comparative Analysis, Budget Table. This is a completely customizable PowerPoint theme that can be put to use immediately. So, download it and address the topic impactfully.
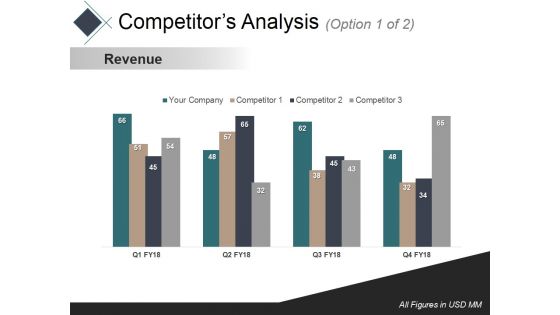
Competitors Analysis 1 Ppt PowerPoint Presentation Outline Templates
This is a competitors analysis 1 ppt powerpoint presentation outline templates. This is a four stage process. The stages in this process are revenue, business, marketing, bar, success.
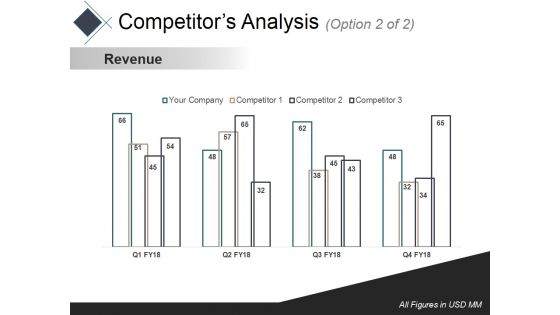
Competitors Analysis 2 Ppt PowerPoint Presentation Slides Gallery
This is a competitors analysis 2 ppt powerpoint presentation slides gallery. This is a four stage process. The stages in this process are revenue, business, marketing, bar, success.
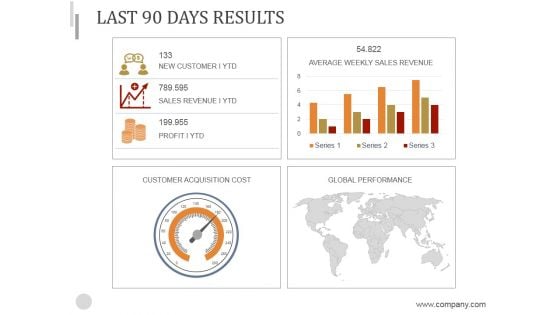
Last 90 Days Results Ppt PowerPoint Presentation Background Image
This is a last 90 days results ppt powerpoint presentation background image. This is a four stage process. The stages in this process are customer acquisition cost, global performance, average weekly sales revenue.
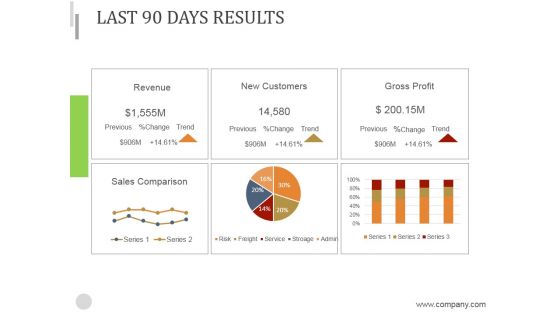
Last 90 Days Results Ppt PowerPoint Presentation Introduction
This is a last 90 days results ppt powerpoint presentation introduction. This is a six stage process. The stages in this process are revenue, new customers, gross profit, sales comparison.
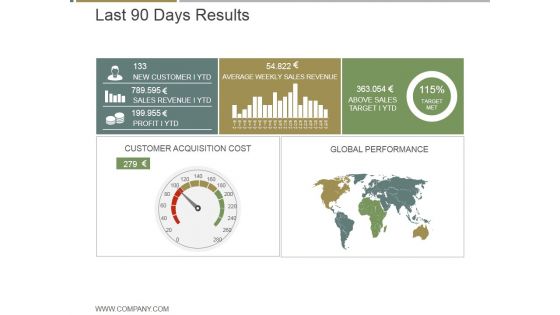
Last 90 Days Results Ppt PowerPoint Presentation Graphics
This is a last 90 days results ppt powerpoint presentation graphics. This is a five stage process. The stages in this process are new customer ytd, average weekly sales revenue, above sales target i ytd, customer acquisition cost, global performance.
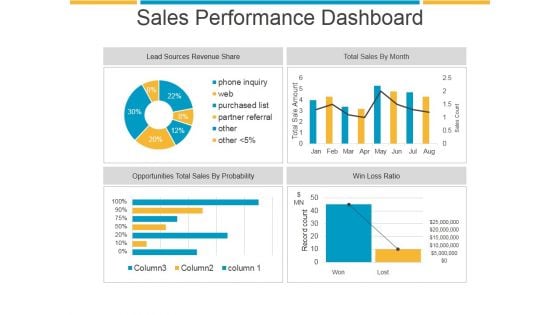
Sales Performance Dashboard Ppt PowerPoint Presentation Show
This is a sales performance dashboard ppt powerpoint presentation show. This is a four stage process. The stages in this process are lead sources revenue share, total sales by month, opportunities total sales by probability, win loss ratio.
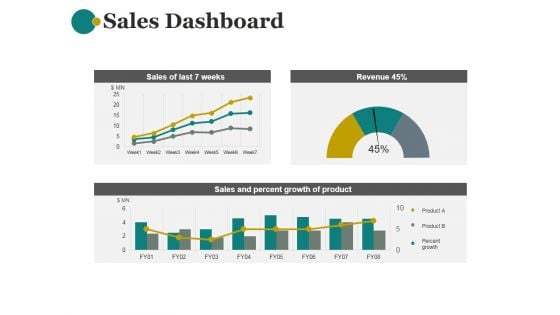
Sales Dashboard Template 1 Ppt PowerPoint Presentation Show
This is a sales dashboard template 1 ppt powerpoint presentation show. This is a three stage process. The stages in this process are sales of last 7 weeks, revenue, sales and percent growth of product.
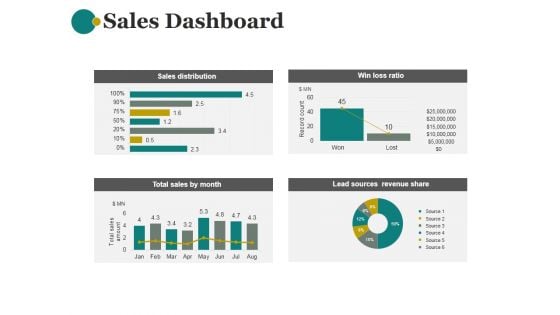
Sales Dashboard Template 2 Ppt PowerPoint Presentation Examples
This is a sales dashboard template 2 ppt powerpoint presentation examples. This is a four stage process. The stages in this process are sales distribution, win loss ratio, lead sources revenue share, total sales by month.
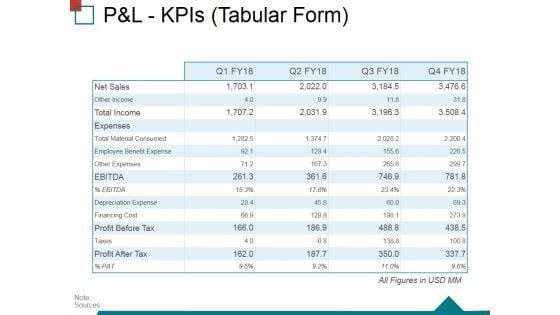
Pandl Kpis Tabular Form Ppt PowerPoint Presentation Ideas Structure
This is a pandl kpis tabular form ppt powerpoint presentation ideas structure. This is a four stage process. The stages in this process are operating profit, revenue, cogs, net profit.
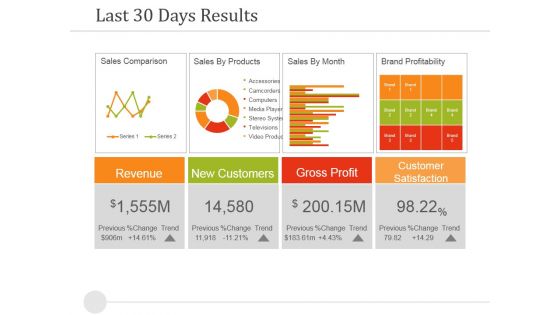
Last 30 Days Results Ppt PowerPoint Presentation Summary Brochure
This is a last 30 days results ppt powerpoint presentation summary brochure. This is a four stage process. The stages in this process are revenue, new customers, gross profit, customer satisfaction.
Website Performance Review Template 2 Ppt PowerPoint Presentation Icon Design Ideas
This is a website performance review template 2 ppt powerpoint presentation icon design ideas. This is a four stage process. The stages in this process are column two, revenue trends, traffic sources.


 Continue with Email

 Home
Home


