Financial
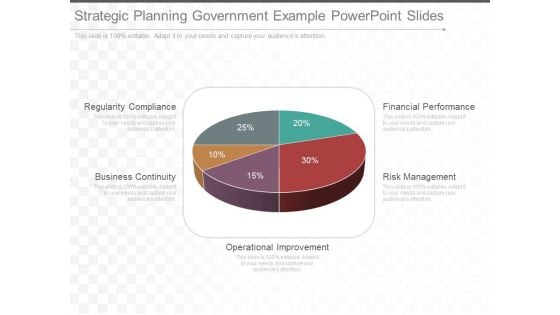
Strategic Planning Government Example Powerpoint Slides
This is a strategic planning government example powerpoint slides. This is a five stage process. The stages in this process are regularity compliance, business continuity, financial performance, risk management, operational improvement.
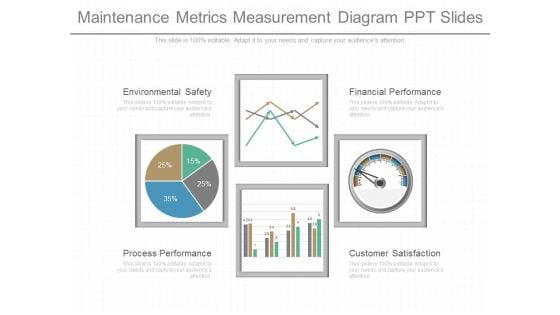
Maintenance Metrics Measurement Diagram Ppt Slides
This is a maintenance metrics measurement diagram ppt slides. This is a four stage process. The stages in this process are environmental safety, process performance, financial performance, customer satisfaction.
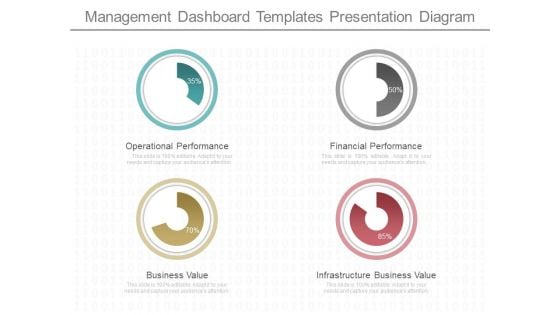
Management Dashboard Templates Presentation Diagram
This is a management dashboard templates presentation diagram. This is a four stage process. The stages in this process are operational performance, business value, financial performance, infrastructure business value.
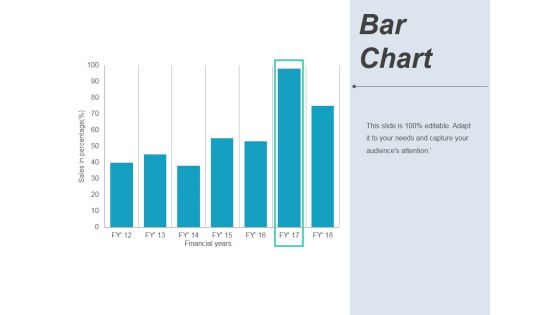
Bar Chart Ppt PowerPoint Presentation Pictures Background Image
This is a bar chart ppt powerpoint presentation pictures background image. This is a seven stage process. The stages in this process are financial years, sales in percentage, graph, business.
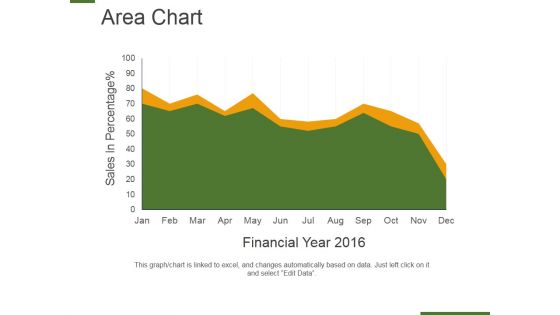
Area Chart Ppt PowerPoint Presentation Layouts Graphics Example
This is a area chart ppt powerpoint presentation layouts graphics example. This is a two stage process. The stages in this process are sales in percentage, financial year, business, marketing, presentation.
Clustered Column Ppt PowerPoint Presentation Icon Design Inspiration
This is a clustered column ppt powerpoint presentation icon design inspiration. This is a two stage process. The stages in this process are product, financial year, sales in percentage, clustered column.
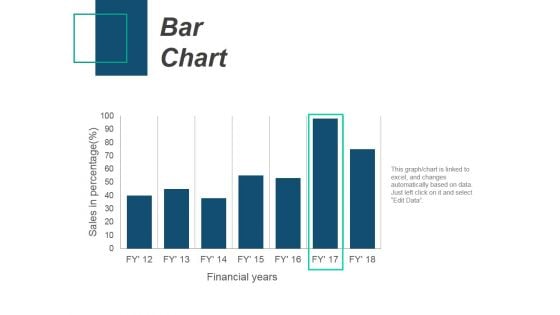
Bar Chart Ppt PowerPoint Presentation Professional Files
This is a bar chart ppt powerpoint presentation professional files. This is a seven stage process. The stages in this process are bar chart, product, sales in percentage, financial years.
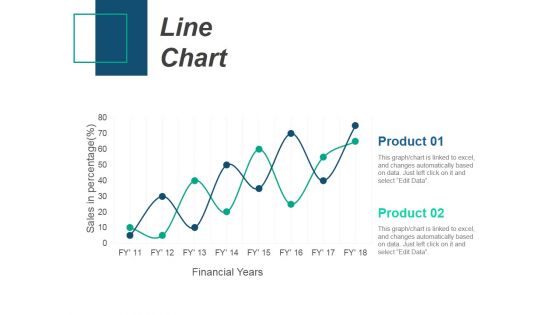
Line Chart Ppt PowerPoint Presentation Infographic Template Introduction
This is a line chart ppt powerpoint presentation infographic template introduction. This is a two stage process. The stages in this process are product, sales in percentage, financial years, line chart.
Line Chart Ppt PowerPoint Presentation Infographic Template Icons
This is a line chart ppt powerpoint presentation infographic template icons. This is a two stage process. The stages in this process are sales in percentage, financial years, product, line chart.
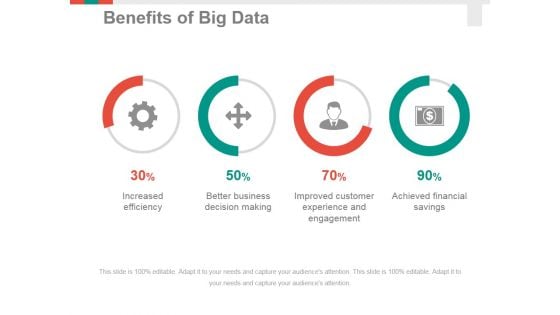
Benefits Of Big Data Ppt PowerPoint Presentation Professional Slide Portrait
This is a benefits of big data ppt powerpoint presentation professional slide portrait. This is a four stage process. The stages in this process are increased efficiency, better business decision making, improved customer experience and engagement, achieved financial savings.
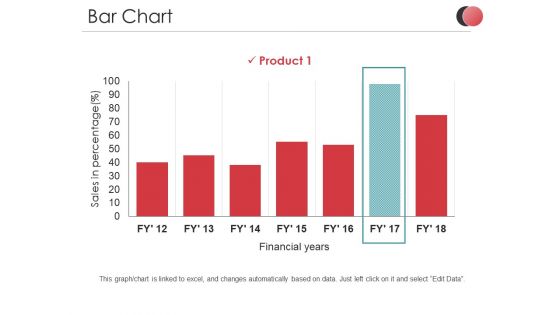
Bar Chart Ppt PowerPoint Presentation Outline Introduction
This is a bar chart ppt powerpoint presentation outline introduction. This is a one stage process. The stages in this process are sales in percentage, product, business, financial years, graph.
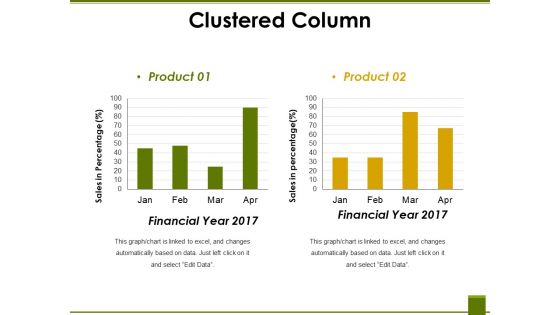
Clustered Column Ppt PowerPoint Presentation Ideas Graphic Tips
This is a clustered column ppt powerpoint presentation ideas graphic tips. This is a two stage process. The stages in this process are financial year, sales in percentage, product, graph, business.
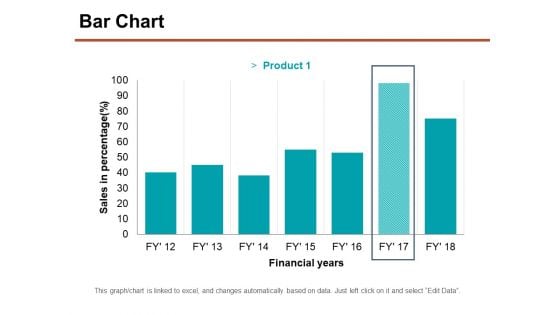
Bar Chart Ppt PowerPoint Presentation Professional Graphics Download
This is a bar chart ppt powerpoint presentation professional graphics download. This is a seven stage process. The stages in this process are sales in percentage, financial years, chart, business.
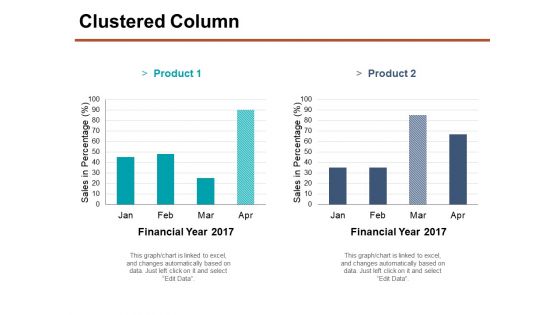
Clustered Column Ppt PowerPoint Presentation Portfolio Smartart
This is a clustered column ppt powerpoint presentation portfolio smartart. This is a two stage process. The stages in this process are financial year, product, sales in percentage, finance, business, graph.
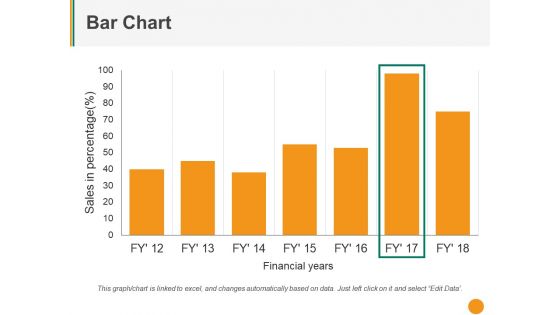
Bar Chart Ppt PowerPoint Presentation Styles Outfit
This is a bar chart ppt powerpoint presentation styles outfit. This is a Seven stage process. The stages in this process are sales in percentage, financial years, graph, business.
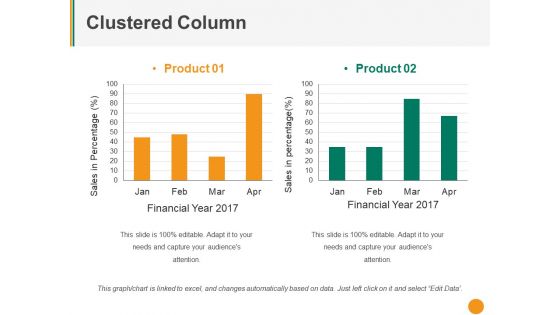
Clustered Column Ppt PowerPoint Presentation Pictures Mockup
This is a clustered column ppt powerpoint presentation pictures mockup. This is a two stage process. The stages in this process are product, sales in percentage, financial year, graph, business.
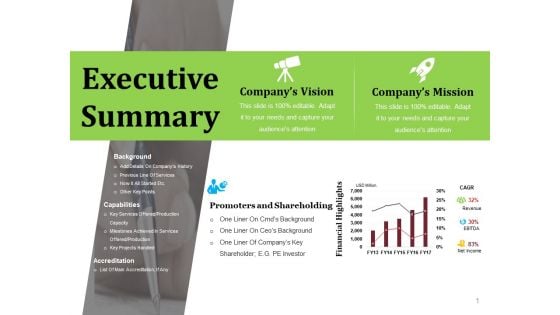
Executive Summary Ppt PowerPoint Presentation Ideas Professional
This is a executive summary ppt powerpoint presentation ideas professional. This is a two stage process. The stages in this process are company s vision, company s mission, promoters and shareholding, financial highlights.
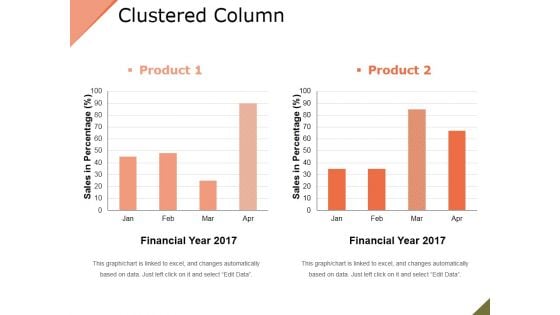
Clustered Column Ppt PowerPoint Presentation File Slide
This is a clustered column ppt powerpoint presentation file slide. This is a two stage process. The stages in this process are product, financial year, sales in percentage, bar graph.
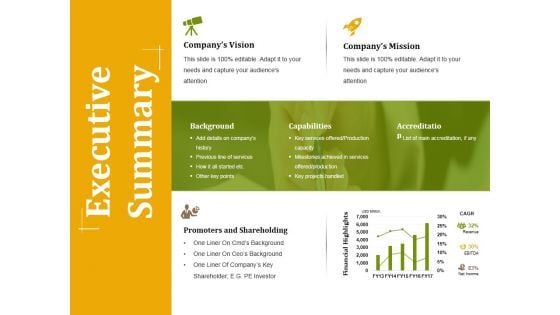
Executive Summary Ppt PowerPoint Presentation Professional Example
This is a executive summary ppt powerpoint presentation professional example. This is a four stage process. The stages in this process are background, capabilities, accreditation, promoters and shareholding, financial highlights.
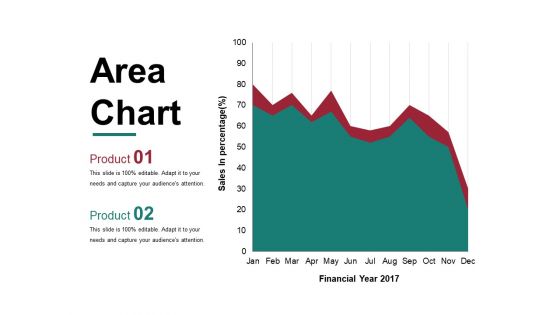
Area Chart Ppt PowerPoint Presentation Layouts Maker
This is a area chart ppt powerpoint presentation layouts maker. This is a two stage process. The stages in this process are financial year, sales in percentage, graph, business, marketing.
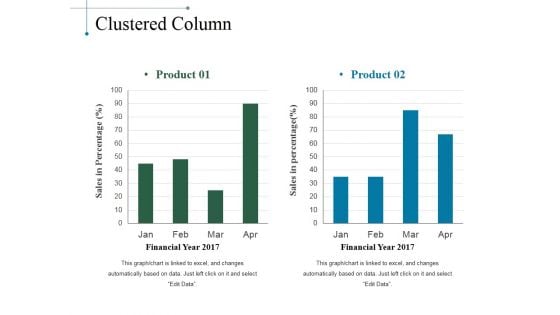
Clustered Column Ppt PowerPoint Presentation Slides Smartart
This is a clustered column ppt powerpoint presentation slides smartart. This is a two stage process. The stages in this process are product, sales in percentage, financial year, bar graph.
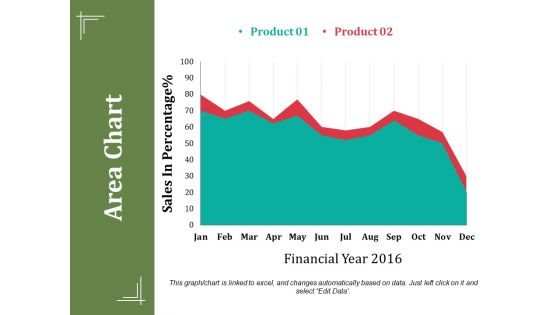
Area Chart Ppt PowerPoint Presentation Summary Show
This is a area chart ppt powerpoint presentation summary show. This is a two stage process. The stages in this process are sales in percentage, financial year, business, marketing, finance.
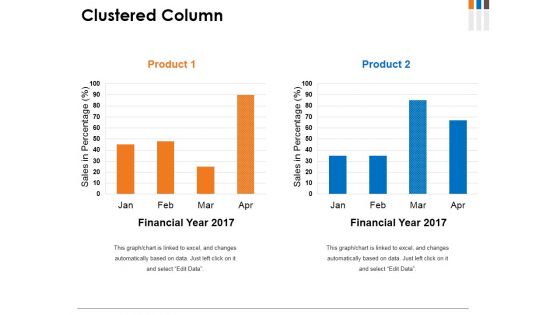
Clustered Column Ppt PowerPoint Presentation File Graphics
This is a clustered column ppt powerpoint presentation file graphics. This is a two stage process. The stages in this process are product, financial year, sales in percentage, graph, growth.
Bar Chart Ppt PowerPoint Presentation Icon Layout
This is a bar chart ppt powerpoint presentation icon layout. This is a one stage process. The stages in this process are sales in percentage, financial years, bar chart, finance, marketing.
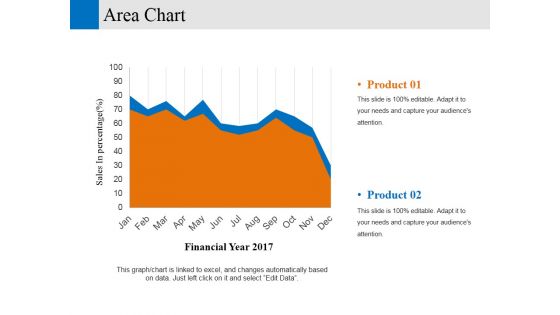
area chart ppt powerpoint presentation professional elements
This is a area chart ppt powerpoint presentation professional elements. This is a two stage process. The stages in this process are financial year sales in percentage, business, marketing, graph.
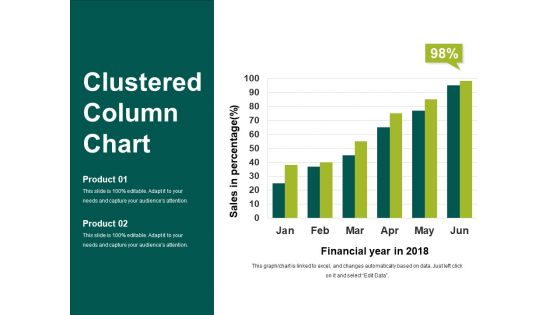
Clustered Column Chart Ppt PowerPoint Presentation Show Slideshow
This is a clustered column chart ppt powerpoint presentation show slideshow. This is a six stage process. The stages in this process are financial year in, sales in percentage, business, marketing, finance.
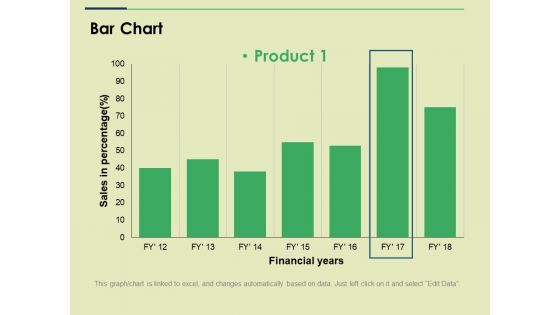
Bar Chart Ppt PowerPoint Presentation File Slide
This is a bar chart ppt powerpoint presentation file slide. This is a one stage process. The stages in this process are sales in percentage financial years, business, marketing, strategy, graph.
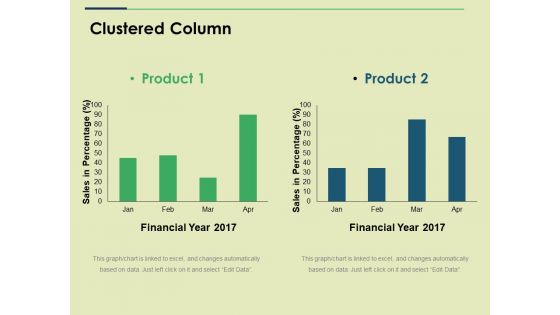
Clustered Column Ppt PowerPoint Presentation Show Graphics
This is a clustered column ppt powerpoint presentation show graphics. This is a two stage process. The stages in this process are financial year, sales in percentage, business, marketing, graph.
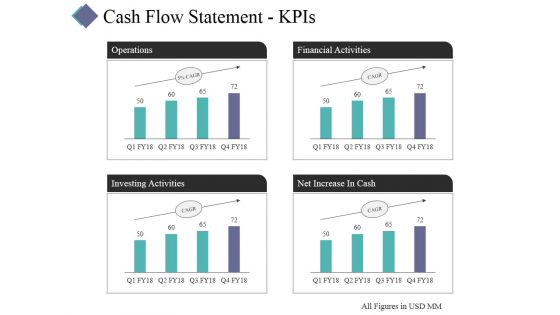
Cash Flow Statement Kpis Template 2 Ppt PowerPoint Presentation Layouts Visuals
This is a cash flow statement kpis template 2 ppt powerpoint presentation layouts visuals. This is a four stage process. The stages in this process are operations, financial activities, investing activities, net increase in cash.
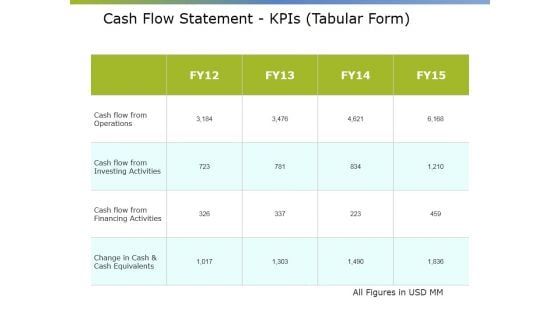
Cash Flow Statement Kpis Tabular Form Ppt PowerPoint Presentation Summary Elements
This is a cash flow statement kpis tabular form ppt powerpoint presentation summary elements. This is a four stage process. The stages in this process are net increase cash, financial activities, operations, investing activities.
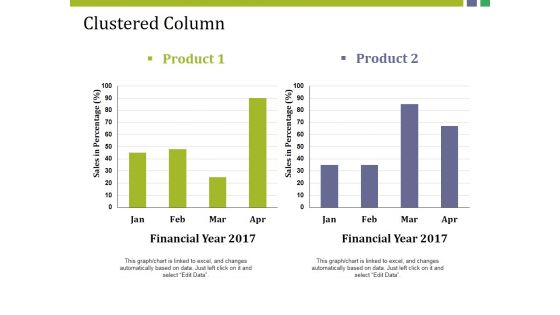
Clustered Column Ppt PowerPoint Presentation Gallery Structure
This is a clustered column ppt powerpoint presentation gallery structure. This is a two stage process. The stages in this process are product, sales in percentage, financial year, bar graph, finance.
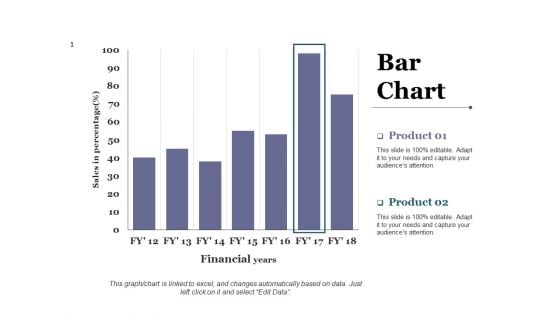
Bar Chart Ppt PowerPoint Presentation Diagram Lists
This is a bar chart ppt powerpoint presentation diagram lists. This is a two stage process. The stages in this process are business, marketing, financial years, sales in percentage, graph.
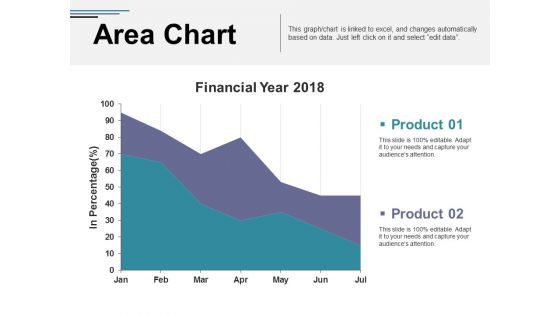
Area Chart Ppt PowerPoint Presentation Inspiration Professional
This is a area chart ppt powerpoint presentation inspiration professional. This is a two stage process. The stages in this process are financial year, in percentage, area chart, finance, business, marketing.
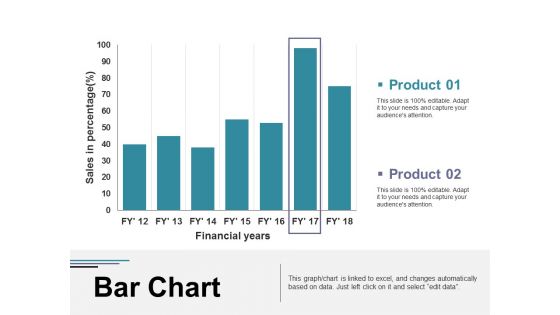
Bar Chart Ppt PowerPoint Presentation Visual Aids Diagrams
This is a bar chart ppt powerpoint presentation visual aids diagrams. This is a two stage process. The stages in this process are business, marketing, financial years, sales in percentage, graph.
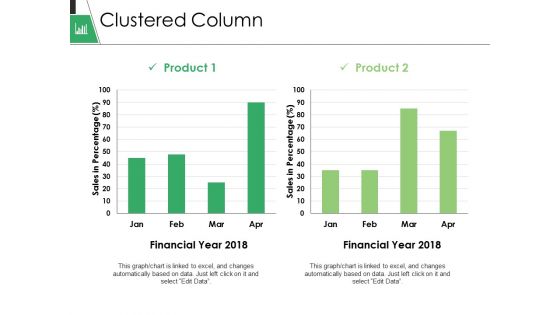
Clustered Column Ppt PowerPoint Presentation Gallery Format
This is a clustered column ppt powerpoint presentation gallery format. This is a two stage process. The stages in this process are business, marketing, graph, financial year, sales in percentage.
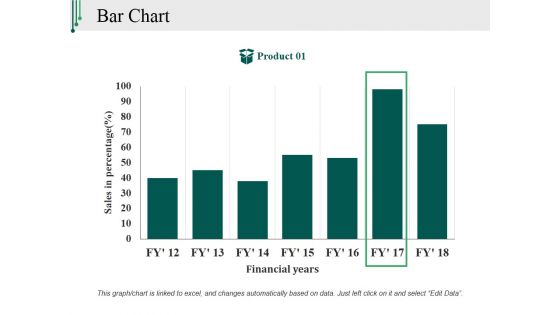
Bar Chart Ppt PowerPoint Presentation Outline Backgrounds
This is a bar chart ppt powerpoint presentation outline backgrounds. This is a one stage process. The stages in this process are sales in percentage, financial years, product, bar graph, finance.
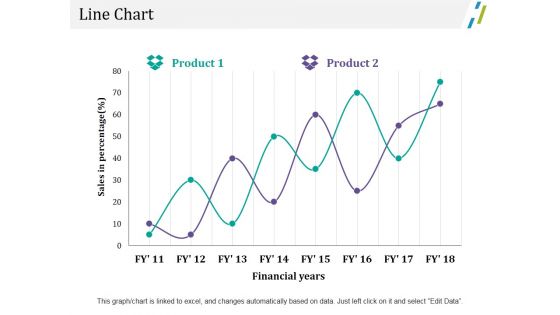
Line Chart Ppt PowerPoint Presentation Outline File Formats
This is a line chart ppt powerpoint presentation outline file formats. This is a two stage process. The stages in this process are business, marketing, sales in percentage, financial years, chart.
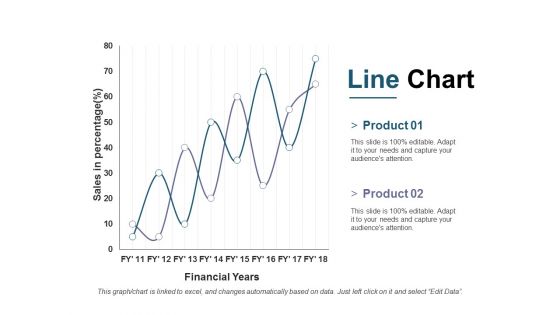
Line Chart Ppt PowerPoint Presentation Outline Ideas
This is a line chart ppt powerpoint presentation outline ideas. This is a two stage process. The stages in this process are business, marketing, financial years, sales in percentage, strategy.
Column Chart Ppt PowerPoint Presentation Infographic Template Icon
This is a column chart ppt powerpoint presentation infographic template icon. This is a two stage process. The stages in this process are business, marketing, sales in percentage, financial year, graph.
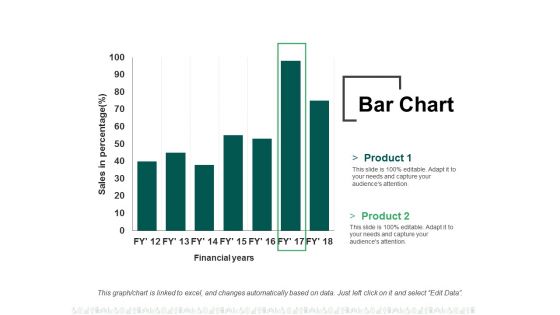
Bar Chart Ppt PowerPoint Presentation Summary File Formats
This is a bar chart ppt powerpoint presentation summary file formats. This is a two stage process. The stages in this process are business, finance, financial years, sales in percentage, graph.
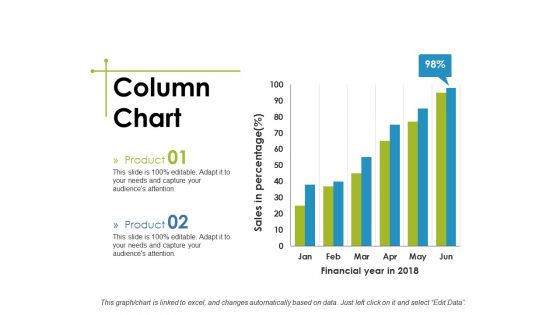
Column Chart Ppt PowerPoint Presentation Show Structure
This is a column chart ppt powerpoint presentation show structure. This is a two stage process. The stages in this process are business, financial year in, sales in percentage, marketing, graph.
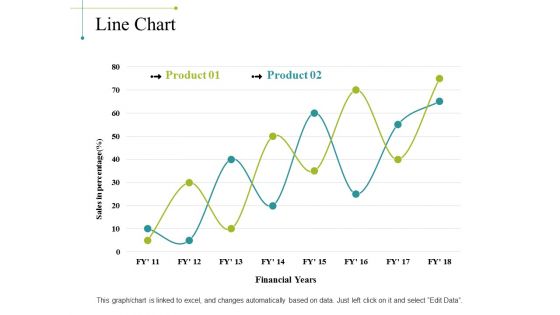
Line Chart Ppt PowerPoint Presentation Portfolio Background Image
This is a line chart ppt powerpoint presentation portfolio background image. This is a two stage process. The stages in this process are sales in percentage, financial years, chart, business, marketing, finance.
Area Chart Ppt PowerPoint Presentation Icon Aids
This is a area chart ppt powerpoint presentation icon aids. This is a three stage process. The stages in this process are financial years, sales in percentage, business, marketing, graph.
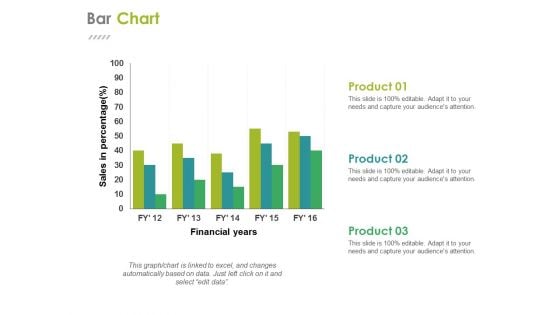
Bar Chart Ppt PowerPoint Presentation Summary Themes
This is a bar chart ppt powerpoint presentation summary themes. This is a three stage process. The stages in this process are financial years, sales in percentage, business, marketing, graph.
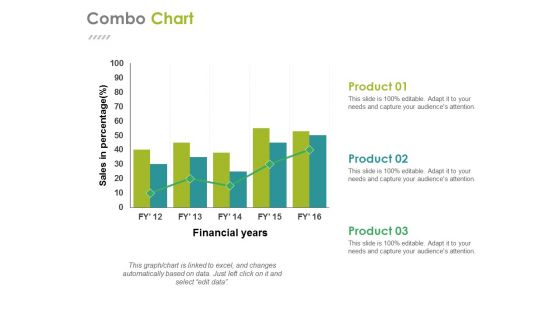
Combo Chart Ppt PowerPoint Presentation Gallery Design Ideas
This is a combo chart ppt powerpoint presentation gallery design ideas. This is a three stage process. The stages in this process are business, financial years, sales in percentage, finance, graph.
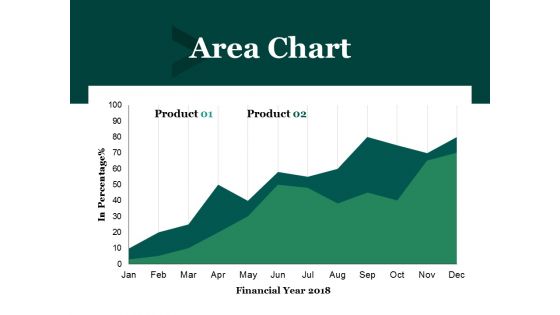
Area Chart Ppt PowerPoint Presentation Outline Graphics Pictures
This is a area chart ppt powerpoint presentation outline graphics pictures. This is a two stage process. The stages in this process are financial year, in percentage, business, marketing, finance.
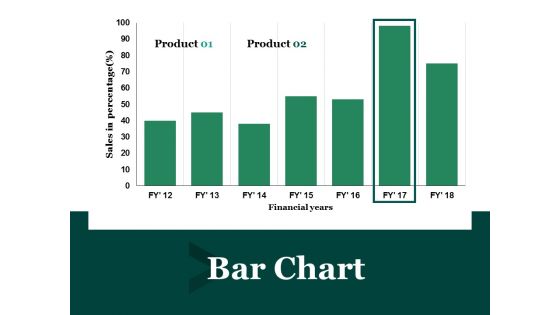
Bar Chart Ppt PowerPoint Presentation Layouts Template
This is a bar chart ppt powerpoint presentation layouts template. This is a two stage process. The stages in this process are financial year, sales in percentage, business, marketing, finance.
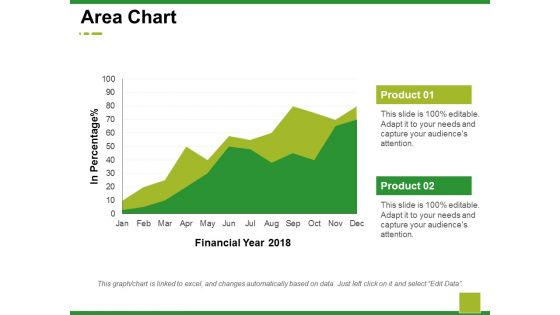
Area Chart Ppt PowerPoint Presentation Model Demonstration
This is a area chart ppt powerpoint presentation model demonstration. This is a two stage process. The stages in this process are business, marketing, financial year, in percentage, graph.
Bar Graph Ppt PowerPoint Presentation Infographics Icon
This is a bar graph ppt powerpoint presentation infographics icon. This is a two stage process. The stages in this process are business, marketing, financial year, in percentage, graph.
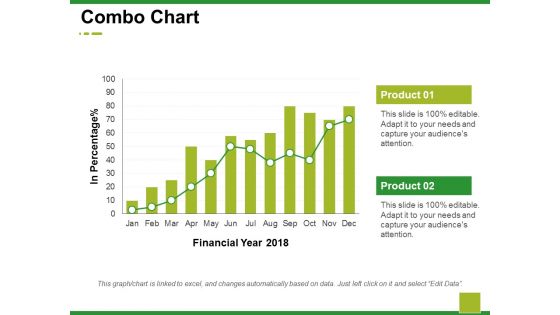
Combo Chart Ppt PowerPoint Presentation Summary Background Images
This is a combo chart ppt powerpoint presentation summary background images. This is a two stage process. The stages in this process are business, marketing, financial year, in percentage, graph.

Clustered Column Ppt PowerPoint Presentation Infographic Template Backgrounds
This is a clustered column ppt powerpoint presentation infographic template backgrounds. This is a two stage process. The stages in this process are sales in percentage, financial year, product.
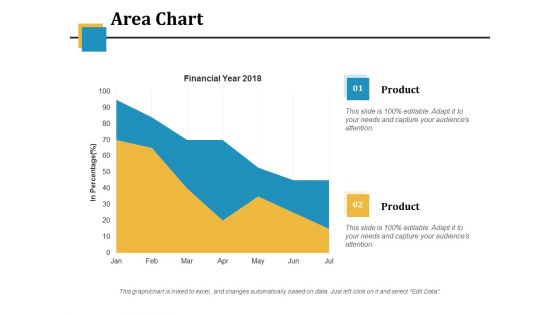
Area Chart Ppt PowerPoint Presentation Model Inspiration
This is a area chart ppt powerpoint presentation model inspiration. This is a two stage process. The stages in this process are financial year, in percentage, area chart, business, marketing.
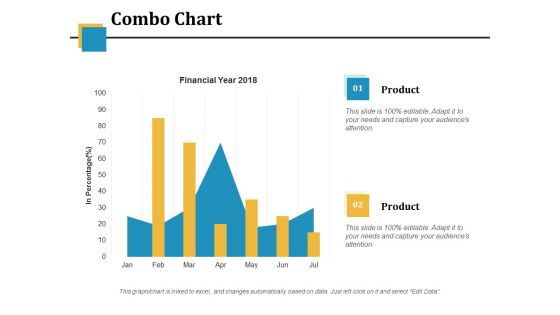
Combo Chart Ppt PowerPoint Presentation Model Vector
This is a combo chart ppt powerpoint presentation model vector. This is a two stage process. The stages in this process are financial year, in percentage, business, marketing, combo chart.
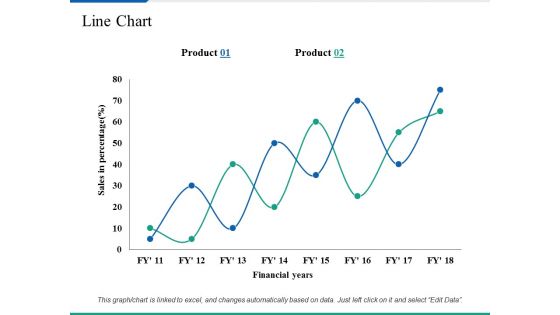
Line Chart Ppt PowerPoint Presentation Summary Clipart Images
This is a line chart ppt powerpoint presentation summary clipart images. This is a two stage process. The stages in this process are business, marketing, sales in percentage, financial years, strategy.
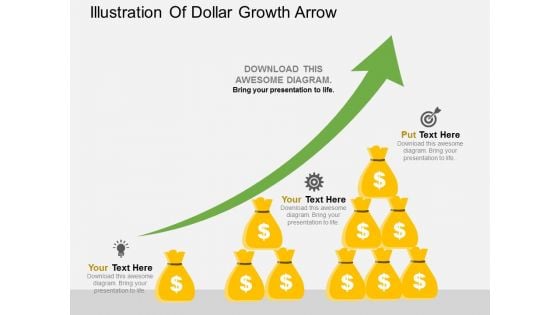
Illustration Of Dollar Growth Arrow Powerpoint Template
This PowerPoint template has been designed with arrow on dollar money bags. Download this business slide to exhibit money and financial growth. Grab centre stage with this professional slide and capture the attention of your audience.

Human Hand Holding Dollar Note Powerpoint Templates
Use this PowerPoint template, in your corporate presentations. It contains graphics of human hand holding dollar note. This slide is 100 percent editable. This business slide may be used to exhibit financial planning. Make wonderful presentations using this diagram.

Man On Dollar Stack With Ladder Powerpoint Template
This PowerPoint template has been designed with man on dollar stack with ladder. This diagram is excellent visual tools to present financial progress. Download this PPT slide to explain complex information immediately and clearly.
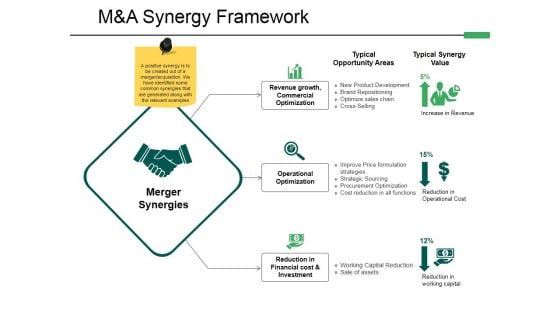
M And A Synergy Framework Ppt PowerPoint Presentation Professional Graphics
This is a m and a synergy framework ppt powerpoint presentation professional graphics. This is a three stage process. The stages in this process are revenue growth, commercial optimization, operational optimization, reduction in financial cost investment.
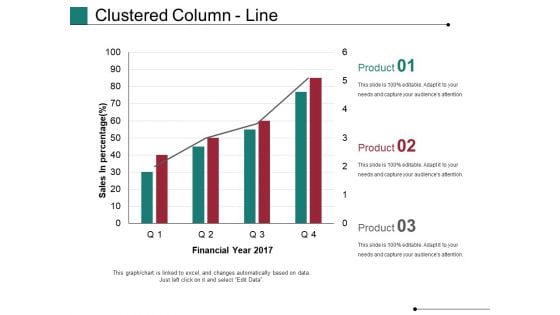
Clustered Column Line Ppt PowerPoint Presentation Model Rules
This is a clustered column line ppt powerpoint presentation model rules. This is a four stage process. The stages in this process are financial year, sales in percentage, business, marketing, growth, graph.
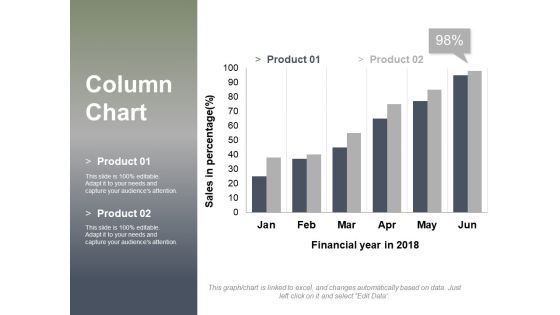
Column Chart Ppt PowerPoint Presentation Layouts Design Inspiration
This is a column chart ppt powerpoint presentation layouts design inspiration. This is a two stage process. The stages in this process are sales in percentage, financial year in, graph, business, finance, marketing.


 Continue with Email

 Home
Home


