Fiscal
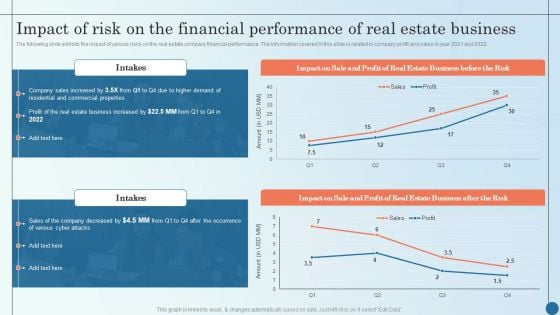
Impact Of Risk On The Financial Performance Of Real Managing Commercial Property Risks Sample PDF
The following slide exhibits the impact of various risks on the real estate company financial performance. The information covered in this slide is related to company profit and sales in year 2021 and 2022. Deliver and pitch your topic in the best possible manner with this Impact Of Risk On The Financial Performance Of Real Managing Commercial Property Risks Sample PDF. Use them to share invaluable insights on Estate Business, Business Increased, Company Decreased and impress your audience. This template can be altered and modified as per your expectations. So, grab it now.
Financial Balance Stable PowerPoint Icon S
Financial balance. Stable equilibrium. 3D image. Illustrations Offer solutions with our Financial Balance Stable PowerPoint Icon S. Download without worries with our money back guaranteee.

Audit Checklist For Mergers And Acquisitions Tax Due Diligence Checklist Summary PDF
Following slide shows tax due diligence checklist. It includes tax related information to be provided and its status. Presenting audit checklist for mergers and acquisitions tax due diligence checklist summary pdf to provide visual cues and insights. Share and navigate important information on one stages that need your due attention. This template can be used to pitch topics like tax related information, allocation related agreements, tax assets and liabilities. In addtion, this PPT design contains high resolution images, graphics, etc, that are easily editable and available for immediate download.
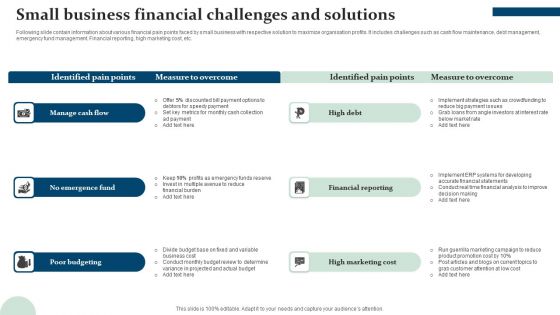
Small Business Financial Challenges And Solutions Graphics PDF
Following slide contain information about various financial pain points faced by small business with respective solution to maximize organisation profits. It includes challenges such as cash flow maintenance, debt management, emergency fund management. Financial reporting, high marketing cost, etc. Presenting Small Business Financial Challenges And Solutions Graphics PDF to dispense important information. This template comprises eight stages. It also presents valuable insights into the topics including Manage Cash Flow, No Emergence Fund, Poor Budgeting, High Marketing Cost, Financial Reporting, High Debt. This is a completely customizable PowerPoint theme that can be put to use immediately. So, download it and address the topic impactfully.
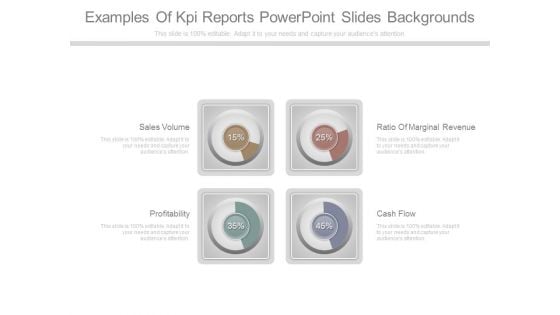
Examples Of Kpi Reports Powerpoint Slides Backgrounds
This is a examples of kpi reports powerpoint slides backgrounds. This is a four stage process. The stages in this process are sales volume, profitability, ratio of marginal revenue, cash flow.
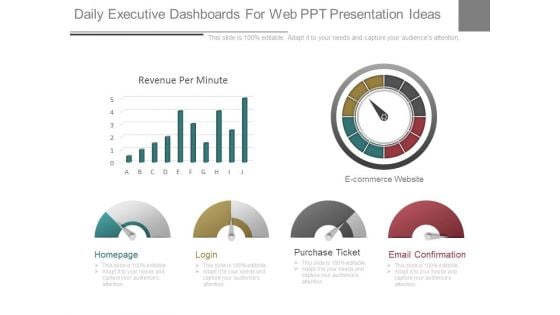
Daily Executive Dashboards For Web Ppt Presentation Ideas
This is a daily executive dashboards for web ppt presentation ideas. This is a six stage process. The stages in this process are homepage, login, purchase ticket, email confirmation, ecommerce website, revenue per minute.

Dashboard Report Ppt Powerpoint Ideas
This is a dashboard report ppt powerpoint ideas. This is a six stage process. The stages in this process are sales vs quotes, target for week, the sales, inventory, revenue.
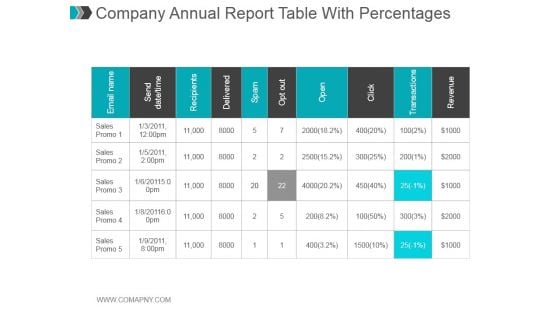
Company Annual Report Table With Percentages Ppt PowerPoint Presentation Slides
This is a company annual report table with percentages ppt powerpoint presentation slides. This is ten stage process. The stages in this process are send date time, email name, recipients, delivered, spam, opt out, open, transactions, revenue.
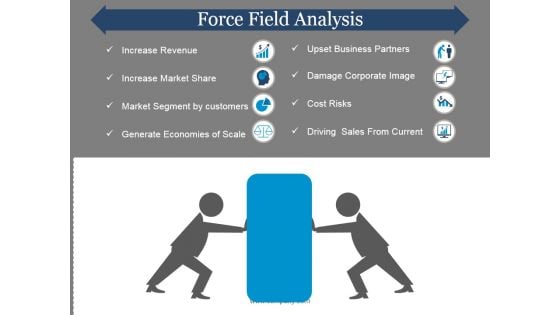
Force Field Analysis Template 1 Ppt PowerPoint Presentation Pictures
This is a force field analysis template 1 ppt powerpoint presentation pictures. This is a two stage process. The stages in this process are increase revenue, increase market sharel, market segment by customers, generate economies of scale.
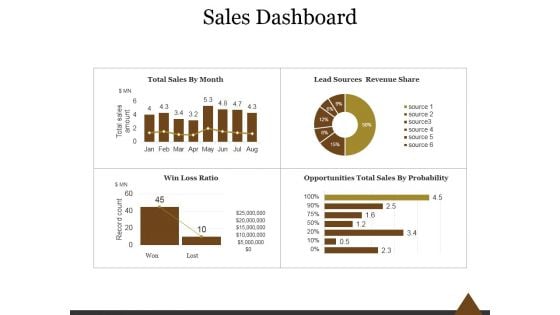
Sales Dashboard Template 2 Ppt PowerPoint Presentation Introduction
This is a sales dashboard template 2 ppt powerpoint presentation introduction. This is a four stage process. The stages in this process are total sales by month, lead sources revenue share, win loss ratio, opportunities total sales by probability.
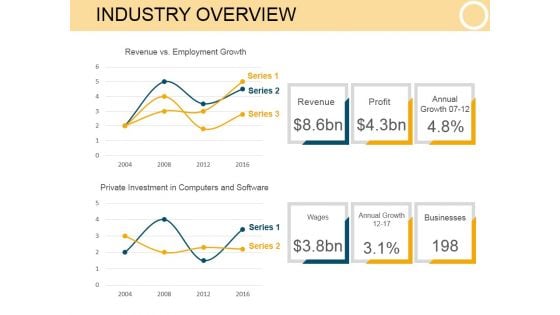
Industry Overview Template 1 Ppt PowerPoint Presentation Show
This is a industry overview template 1 ppt powerpoint presentation show. This is a six stage process. The stages in this process are revenue, profit, annual growth, wages, businesses.
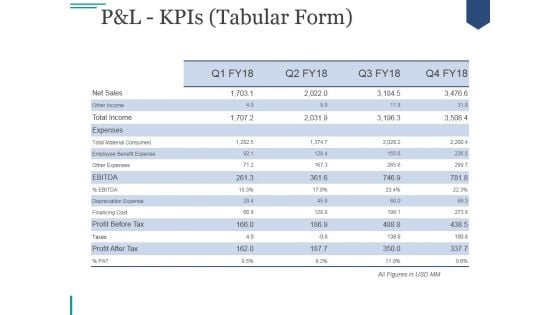
Pandl Kpis Tabular Form Ppt PowerPoint Presentation Visual Aids
This is a pandl kpis tabular form ppt powerpoint presentation visual aids. This is a four stage process. The stages in this process are revenue, cogs, operating profit, net profit.
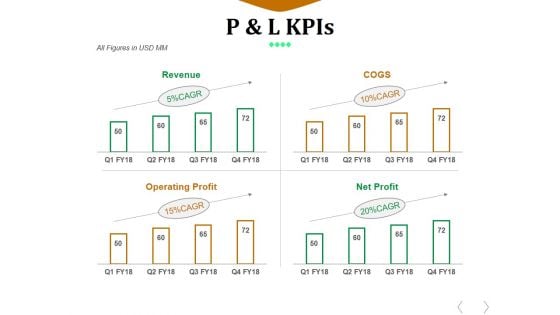
P And L Kpis Template 1 Ppt PowerPoint Presentation Design Ideas
This is a p and l kpis template 1 ppt powerpoint presentation design ideas. This is a four stage process. The stages in this process are revenue, cogs, operating profit, net profit.
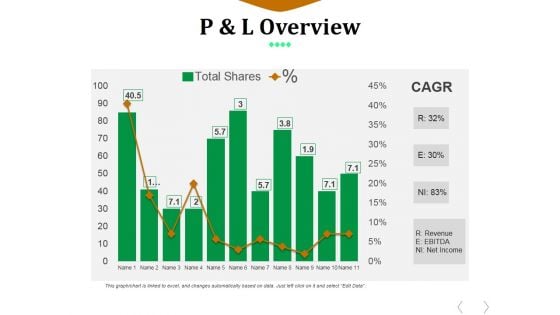
P And L Overview Ppt PowerPoint Presentation Styles Summary
This is a p and l overview ppt powerpoint presentation styles summary. This is a eleven stage process. The stages in this process are revenue, ebitda, net income, total shares.
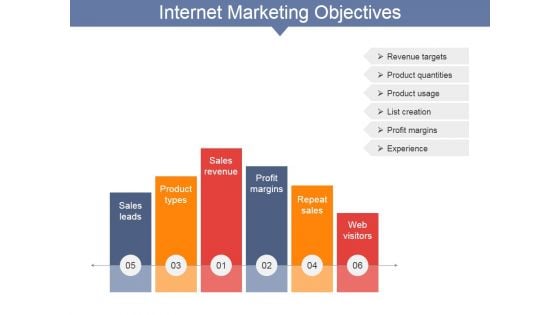
Internet Marketing Objectives Ppt PowerPoint Presentation Layouts Smartart
This is a internet marketing objectives ppt powerpoint presentation layouts smartart. This is a six stage process. The stages in this process are sales leads, product types, sales revenue, profit margins, repeat sales, web visitors.
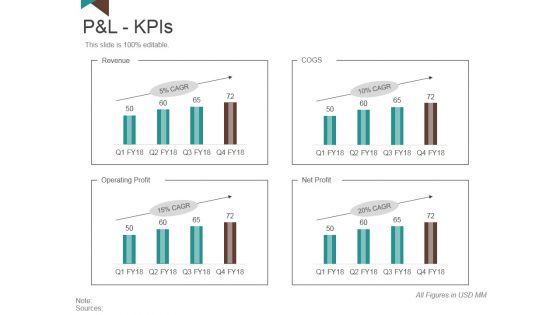
P And L Kpis Template 1 Ppt PowerPoint Presentation Slides Model
This is a p and l kpis template 1 ppt powerpoint presentation slides model. This is a four stage process. The stages in this process are revenue, operating profit, net profit, cogs.
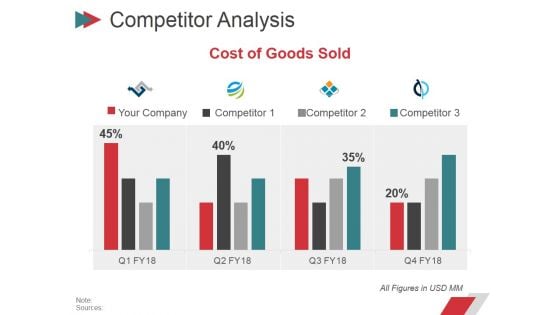
Competitor Analysis Template 1 Ppt PowerPoint Presentation Gallery Demonstration
This is a competitor analysis template 1 ppt powerpoint presentation gallery demonstration. This is a four stage process. The stages in this process are business, strategy, marketing, planning, your company, revenue.
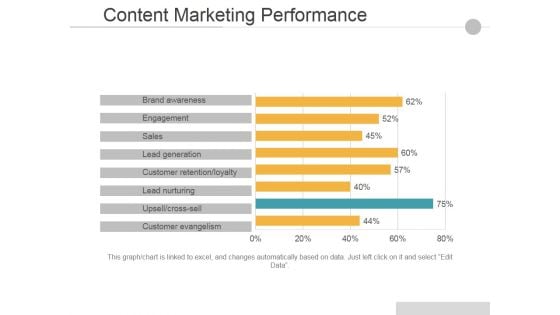
Content Marketing Performance Ppt PowerPoint Presentation Guidelines
This is a content marketing performance ppt powerpoint presentation guidelines. This is a eight stage process. The stages in this process are conversion rate, quality of leads, number of leads, sales revenue, website traffic.
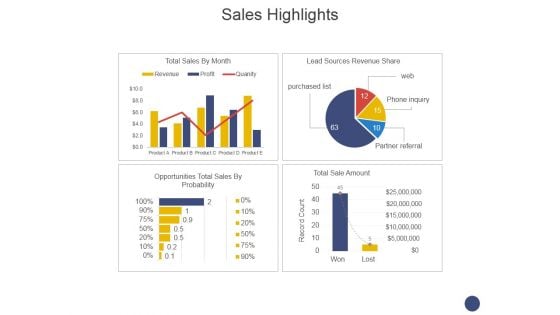
Sales Highlights Ppt PowerPoint Presentation Gallery Tips
This is a sales highlights ppt powerpoint presentation gallery tips. This is a four stage process. The stages in this process are opportunities total sales by probability, lead sources revenue share, total sales by month, total sale amount.
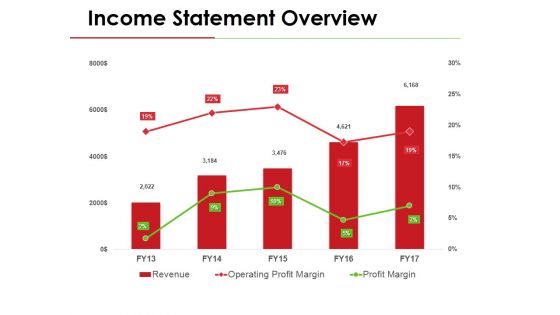
Income Statement Overview Ppt PowerPoint Presentation Gallery Template
This is a income statement overview ppt powerpoint presentation gallery template. This is a three stage process. The stages in this process are revenue, operating profit margin, profit margin.
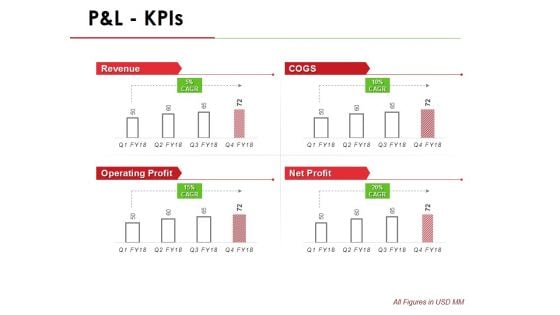
P And L Kpis Template 1 Ppt PowerPoint Presentation Infographic Template Outline
This is a p and l kpis template 1 ppt powerpoint presentation infographic template outline. This is a four stage process. The stages in this process are revenue, operating profit, cogs, net profit.
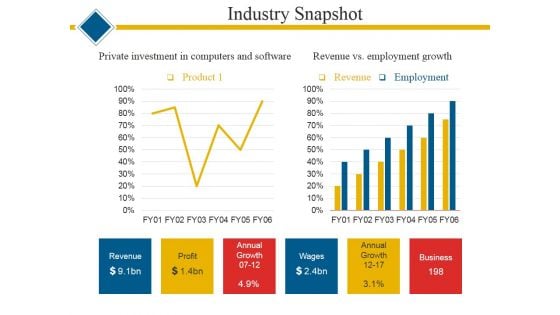
Industry Snapshot Template 2 Ppt PowerPoint Presentation Layouts Examples
This is a industry snapshot template 2 ppt powerpoint presentation layouts examples. This is a three stage process. The stages in this process are revenue, profit, annual growth, wages, annual growth, business.
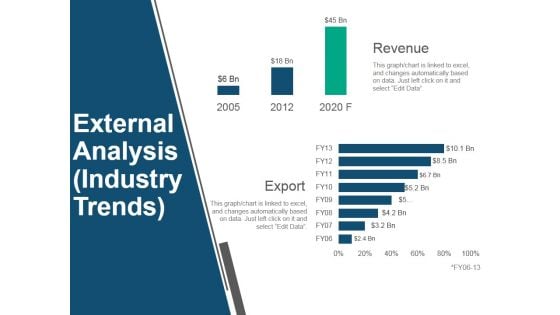
External Analysis Industry Trends Ppt PowerPoint Presentation Inspiration Portfolio
This is a external analysis industry trends ppt powerpoint presentation inspiration portfolio. This is a two stage process. The stages in this process are revenue, export, business, marketing, presentation.
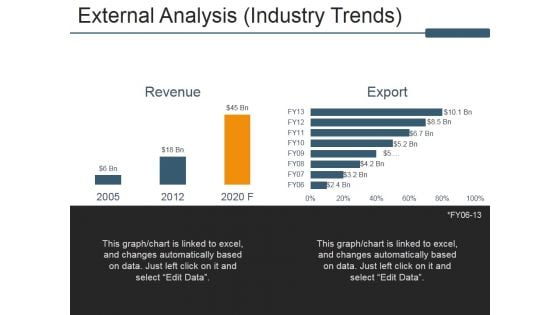
External Analysis Industry Trends Ppt PowerPoint Presentation Infographic Template Summary
This is a external analysis industry trends ppt powerpoint presentation infographic template summary. This is a two stage process. The stages in this process are revenue, export, external analysis, business, marketing.
Pandl Kpis Tabular Form Ppt PowerPoint Presentation Gallery Icon
This is a pandl kpis tabular form ppt powerpoint presentation gallery icon. This is a four stage process. The stages in this process are revenue, cogs, operating profit, net profit.
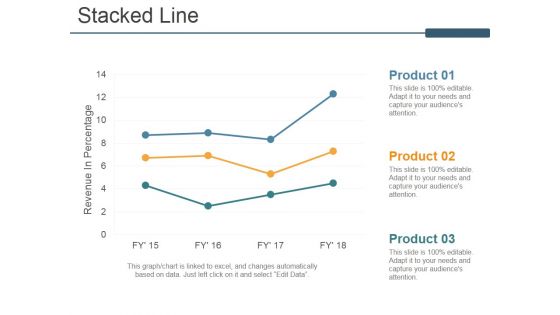
Stacked Line Ppt PowerPoint Presentation Ideas Model
This is a stacked line ppt powerpoint presentation ideas model. This is a three stage process. The stages in this process are revenue in percentage, stacked line, product, business, marketing.
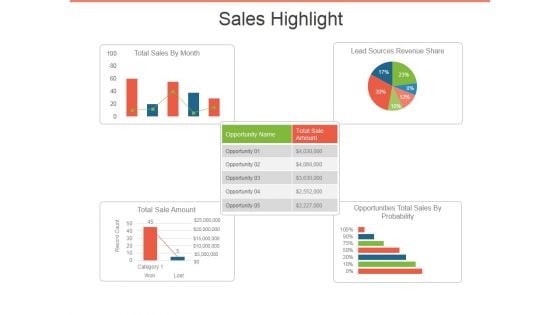
Sales Highlight Ppt PowerPoint Presentation Ideas Design Templates
This is a sales highlight ppt powerpoint presentation ideas design templates. This is a five stage process. The stages in this process are total sales by month, lead sources revenue share, opportunities total sales by probability, total sale amount.
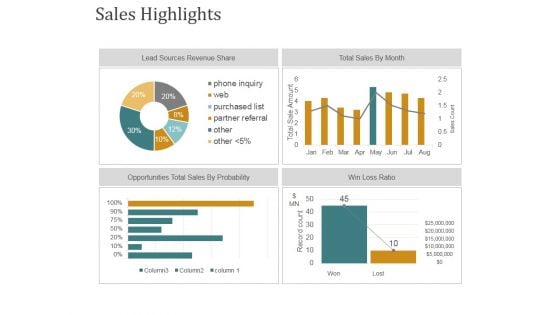
Sales Highlights Ppt PowerPoint Presentation Infographic Template Show
This is a sales highlights ppt powerpoint presentation infographic template show. This is a four stage process. The stages in this process are lead sources revenue share, total sales by month, opportunities total sales by probability, win loss ratio.
Content Marketing Performance Template 1 Ppt PowerPoint Presentation Icon Skills
This is a content marketing performance template 1 ppt powerpoint presentation icon skills. This is a eight stage process. The stages in this process are conversion rate, website traffic, number of leads, sales revenue, quality of leads.
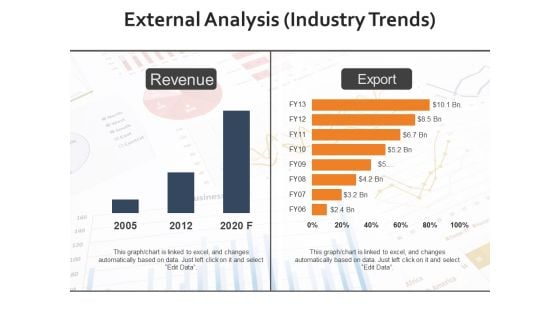
External Analysis Industry Trends Ppt PowerPoint Presentation Infographic Template Visuals
This is a external analysis industry trends ppt powerpoint presentation infographic template visuals. This is a two stage process. The stages in this process are export, revenue, percentage, years, business, analysis.
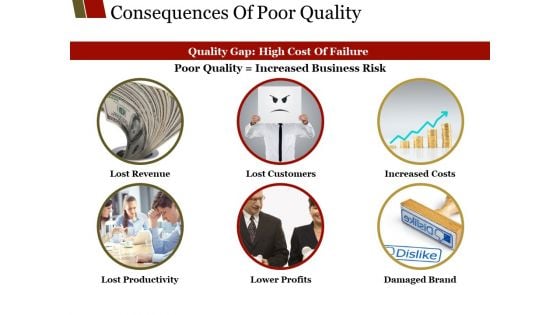
Consequences Of Poor Quality Ppt PowerPoint Presentation Portfolio Graphics Tutorials
This is a consequences of poor quality ppt powerpoint presentation portfolio graphics tutorials. This is a six stage process. The stages in this process are lost revenue, lost customers, increased costs, lower profits, lost productivity.
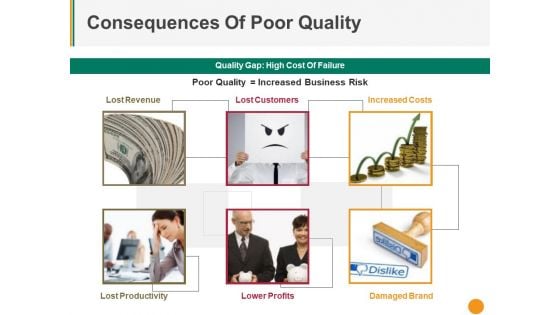
Consequences Of Poor Quality Ppt PowerPoint Presentation Gallery Layout Ideas
This is a consequences of poor quality ppt powerpoint presentation gallery layout ideas. This is a six stage process. The stages in this process are lost revenue, lost productivity, lower profits, lost customers, increased costs.
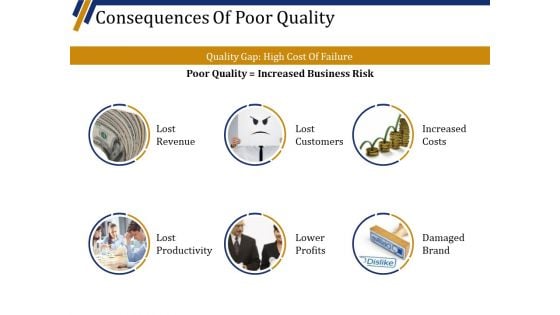
Consequences Of Poor Quality Ppt PowerPoint Presentation File Graphics
This is a consequences of poor quality ppt powerpoint presentation file graphics. This is a six stage process. The stages in this process are lost revenue, lost customers, increased costs, damaged brand, lower profits.
Traction Ppt PowerPoint Presentation Icon Example Introduction
This is a traction ppt powerpoint presentation icon example introduction. This is a three stage process. The stages in this process are any coverage in articles news, company s logo, growing fast, generating good revenues, business, finance.

Income Statement Graphical Representation Ppt PowerPoint Presentation Layouts Designs Download
This is a income statement graphical representation ppt powerpoint presentation layouts designs download. This is a four stage process. The stages in this process are revenue, cogs, operating profit, net profit.
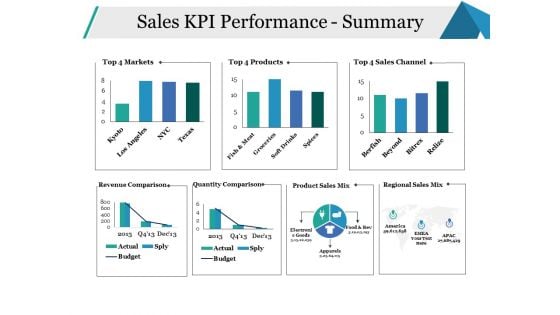
Sales KPI Performance Summary Ppt PowerPoint Presentation Infographics Model
This is a sales kpi performance summary ppt powerpoint presentation infographics model. This is a seven stage process. The stages in this process are sales channel, revenue comparison, quantity comparison, business, marketing.
Sales KPI Tracker Ppt PowerPoint Presentation Icon Themes
This is a sales kpi tracker ppt powerpoint presentation icon themes. This is a six stage process. The stages in this process are business, marketing, opportunities won, top products in revenue, leads created.

Sales Kpi Performance Summary Ppt PowerPoint Presentation Infographic Template Infographics
This is a sales kpi performance summary ppt powerpoint presentation infographic template infographics. This is a seven stage process. The stages in this process are revenue comparison, quantity comparison, product sales mix, regional sales mix.
Sales Kpi Tracker Ppt PowerPoint Presentation Visual Aids Files
This is a sales kpi tracker ppt powerpoint presentation visual aids files. This is a six stage process. The stages in this process are leads created, sales ratio, opportunities won, top products in revenue, open deals vs last yr.
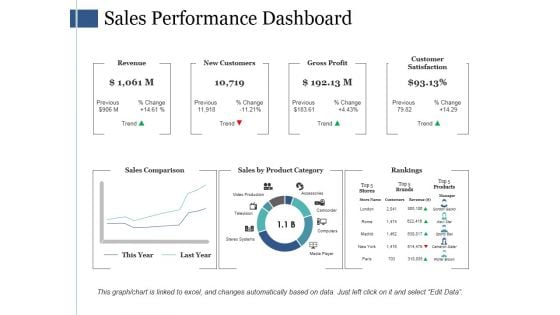
Sales Performance Dashboard Ppt PowerPoint Presentation Ideas Portfolio
This is a sales performance dashboard ppt powerpoint presentation ideas portfolio. This is a three stage process. The stages in this process are revenue, new customers, gross profit, customer satisfaction, sales comparison.
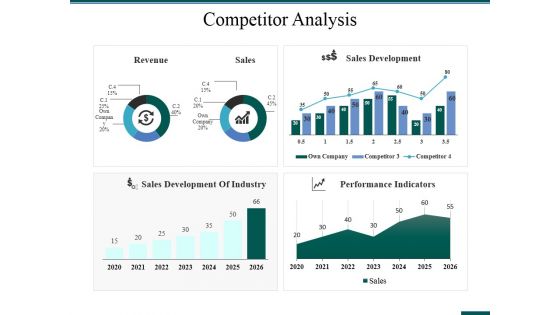
Competitor Analysis Ppt PowerPoint Presentation Model Visual Aids
This is a competitor analysis ppt powerpoint presentation model visual aids. This is a four stage process. The stages in this process are competitor analysis, revenue, sales, sales development, performance indicators.

Sales Kpi Performance Summary Ppt PowerPoint Presentation Ideas Graphics Template
This is a sales kpi performance summary ppt powerpoint presentation ideas graphics template. This is a seven stage process. The stages in this process are revenue comparison, quantity comparison, product sales mix, regional sales mix.
Sales Kpi Tracker Ppt PowerPoint Presentation Pictures Designs
This is a sales kpi tracker ppt powerpoint presentation pictures designs. This is a two stage process. The stages in this process are leads created, sales ratio, opportunities won, top products in revenue, win ratio vs last yr.
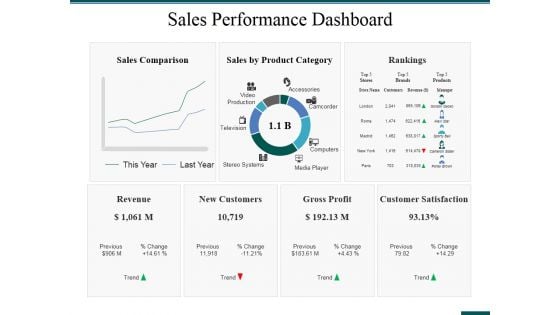
Sales Performance Dashboard Ppt PowerPoint Presentation Ideas Format Ideas
This is a sales performance dashboard ppt powerpoint presentation ideas format ideas. This is a three stage process. The stages in this process are rankings, revenue, new customers, gross profit, customer satisfaction.
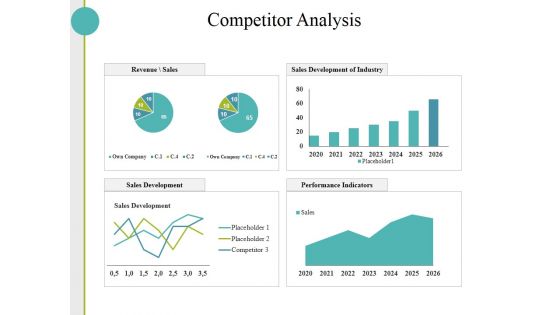
Competitor Analysis Ppt PowerPoint Presentation Layouts Slides
This is a competitor analysis ppt powerpoint presentation layouts slides. This is a four stage process. The stages in this process are sales development, performance indicators, sales development of industry, revenue sales.
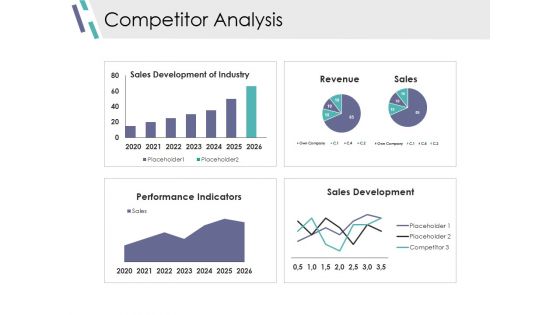
Competitor Analysis Ppt PowerPoint Presentation Layouts Background Images
This is a competitor analysis ppt powerpoint presentation layouts background images. This is a four stage process. The stages in this process are sales development of industry, revenue, performance indicators, sales development.
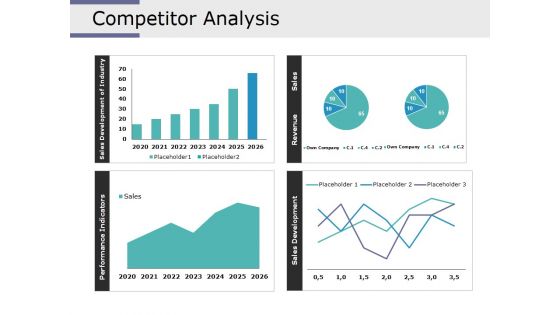
Competitor Analysis Ppt PowerPoint Presentation Model Show
This is a competitor analysis ppt powerpoint presentation model show. This is a four stage process. The stages in this process are performance indicators, sales development of industry, sales development, revenue, sales.
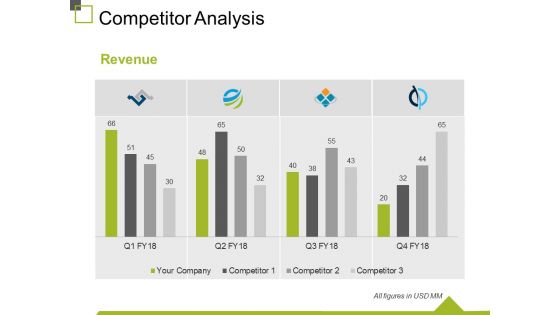
Competitor Analysis Template 1 Ppt PowerPoint Presentation File Grid
This is a competitor analysis template 1 ppt powerpoint presentation file grid. This is a four stage process. The stages in this process are finance, marketing, business, graph, analysis, revenue.
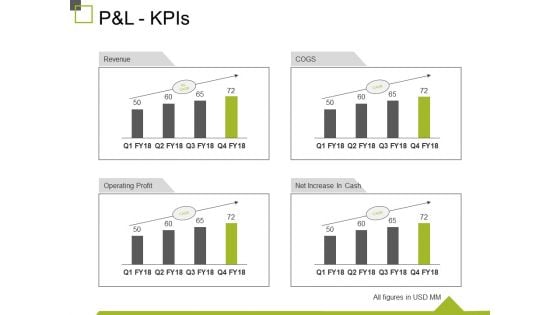
P And L Kpis Ppt PowerPoint Presentation Show Design Inspiration
This is a p and l kpis ppt powerpoint presentation show design inspiration. This is a four stage process. The stages in this process are revenue, operating profit, cogs, net increase in cash, business.
P And L Kpis Template 2 Ppt PowerPoint Presentation Summary Icon
This is a p and l kpis template 2 ppt powerpoint presentation summary icon. This is a four stage process. The stages in this process are revenue, cogs, operating profit, net profit.
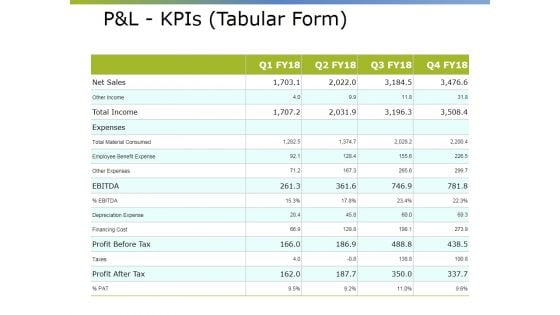
Pandl Kpis Tabular Form Ppt PowerPoint Presentation Pictures Visual Aids
This is a pandl kpis tabular form ppt powerpoint presentation pictures visual aids. This is a four stage process. The stages in this process are revenue, operating profit, cogs, net profit.
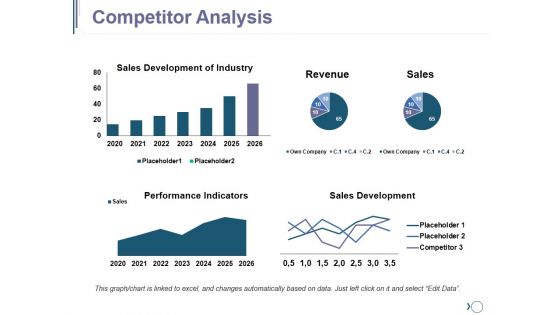
Competitor Analysis Ppt PowerPoint Presentation Outline Ideas
This is a competitor analysis ppt powerpoint presentation outline ideas. This is a four stage process. The stages in this process are sales development of industry, revenue, sales, performance indicators.
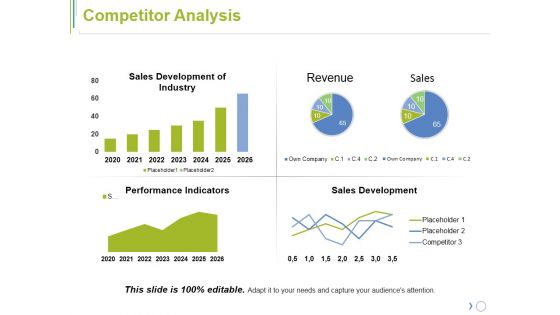
Competitor Analysis Ppt PowerPoint Presentation File Mockup
This is a competitor analysis ppt powerpoint presentation file mockup. This is a four stage process. The stages in this process are sales development of industry, revenue, performance indicators, sales development.
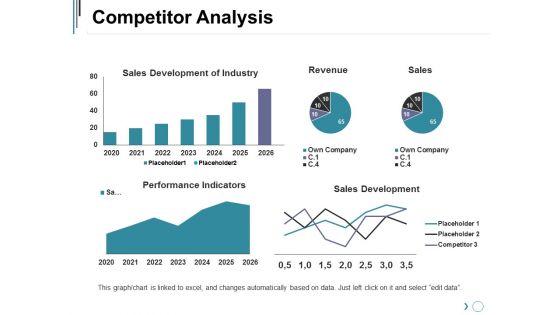
Competitor Analysis Ppt PowerPoint Presentation Layouts Slideshow
This is a competitor analysis ppt powerpoint presentation layouts slideshow. This is a four stage process. The stages in this process are sales development of industry, performance indicators, sales development, revenue, sales.
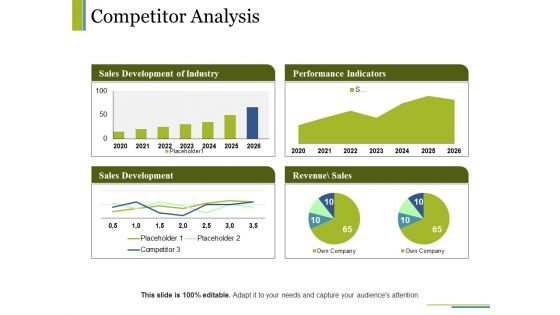
Competitor Analysis Ppt PowerPoint Presentation Visual Aids Model
This is a competitor analysis ppt powerpoint presentation visual aids model. This is a four stage process. The stages in this process are sales development of industry, performance indicators, sales development, revenue sales, business.
Pandl Kpis Template Ppt PowerPoint Presentation Model Icon
This is a pandl kpis template ppt powerpoint presentation model icon. This is a four stage process. The stages in this process are revenue, cogs, operating profit, net profit.
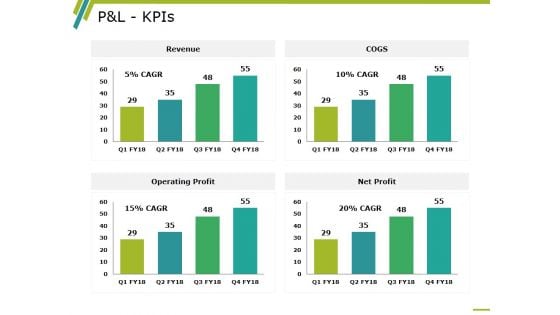
P And L Kpis Template 2 Ppt PowerPoint Presentation Professional Information
This is a p and l kpis template 2 ppt powerpoint presentation professional information. This is a four stage process. The stages in this process are revenue, operating profit, cogs, net profit, business.
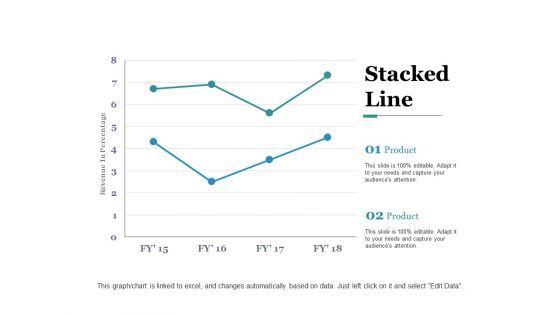
Stacked Line Ppt PowerPoint Presentation Professional Graphics Pictures
This is a stacked line ppt powerpoint presentation professional graphics pictures. This is a two stage process. The stages in this process are revenue in percentage, business, marketing, graph, finance.
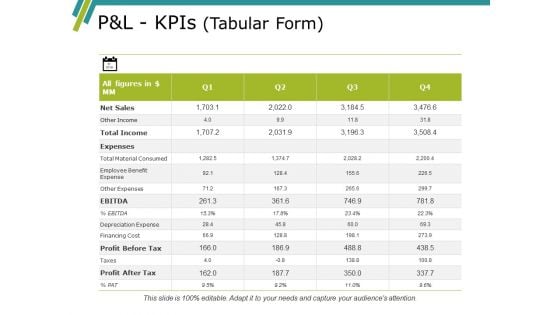
Pandl Kpis Template Ppt PowerPoint Presentation Gallery Summary
This is a pandl kpis template ppt powerpoint presentation gallery summary. This is a four stage process. The stages in this process are revenue, cogs, operating profit, net profit.
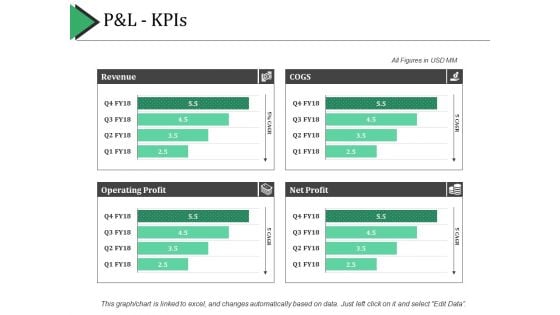
P And L Kpis Ppt PowerPoint Presentation Show Example Introduction
This is a p and l kpis ppt powerpoint presentation show example introduction. This is a four stage process. The stages in this process are revenue, cogs, net profit, operating profit.


 Continue with Email

 Home
Home


