Fishbone

Conduct Root Cause Analysis Through Fishbone Executing Quality Ppt Slides PM SS V
This slide shows sample root cause analysis of a project that encountered some quality issues at time of project delivery to the client. It include different causes such as team issues, materials and methodology, etc. Present like a pro with Conduct Root Cause Analysis Through Fishbone Executing Quality Ppt Slides PM SS V. Create beautiful presentations together with your team, using our easy-to-use presentation slides. Share your ideas in real-time and make changes on the fly by downloading our templates. So whether you are in the office, on the go, or in a remote location, you can stay in sync with your team and present your ideas with confidence. With Slidegeeks presentation got a whole lot easier. Grab these presentations today. This slide shows sample root cause analysis of a project that encountered some quality issues at time of project delivery to the client. It include different causes such as team issues, materials and methodology, etc.
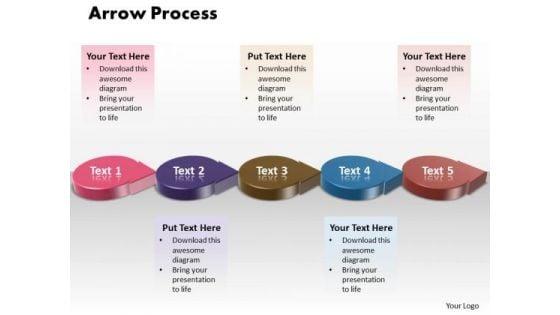
Ppt 3d Circle Arrow Process Flow Free Fishbone Diagram PowerPoint Template Templates
PPT 3d circle arrow process flow free fishbone diagram powerpoint template Templates-Use this 3D PowerPoint Diagram to represent the five stages of Sequential Process. It portrays beeline, continuous, even, horizontal, in bee line, in straight line, linear , nonstop, not crooked, point-blank, right, shortest, straight, straightaway, through, true, unbroken etc.-PPT 3d circle arrow process flow free fishbone diagram powerpoint template Templates-3d, Advertisement, Advertising, Arrow, Border, Business, Circles, Collection, Customer, Design, Element, Icon, Idea, Illustration, Info, Information, Isolated, Label, Light, Location, Needle, New, Notification, Notify, Point, Pointer, Promotion, Role, Rounded Motivate your team to excellent performances. Nurture their abilities through our Ppt 3d Circle Arrow Process Flow Free Fishbone Diagram PowerPoint Template Templates.
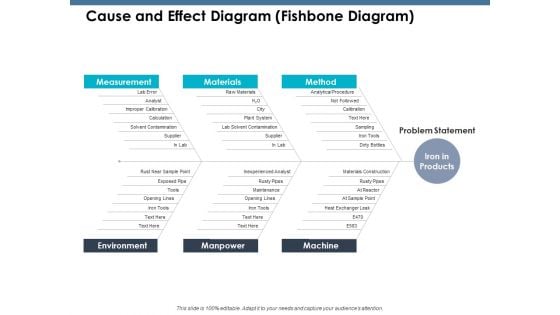
Cause And Effect Diagram Fishbone Diagram Ppt PowerPoint Presentation Outline Portrait
This is a cause and effect diagram fishbone diagram ppt powerpoint presentation outline portrait. This is a three stage process. The stages in this process are measurement, materials, method, environment, manpower.

Cause And Effect Diagram Fishbone Diagram Ppt PowerPoint Presentation Layouts Designs Download
This is a cause and effect diagram fishbone diagram ppt powerpoint presentation layouts designs download. This is a three stage process. The stages in this process are measurement, materials, method, environment, manpower, machine.
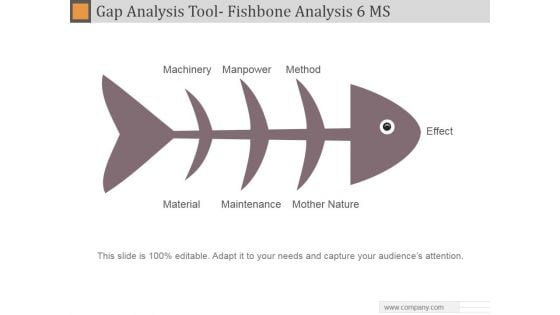
Gap Analysis Tool Fishbone Analysis 6 MS Ppt PowerPoint Presentation Inspiration
This is a gap analysis tool fishbone analysis 6 ms ppt powerpoint presentation inspiration. This is a three stage process. The stages in this process are machinery, manpower, method, material, maintenance, mother nature, effect.
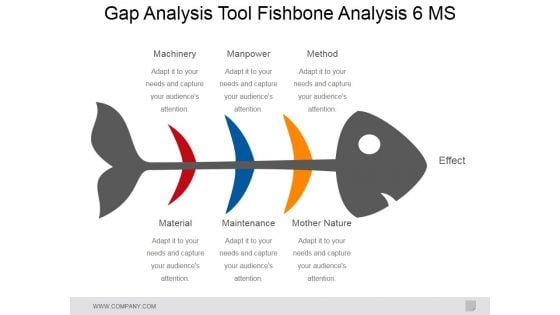
Gap Analysis Tool Fishbone Analysis 6 Ms Ppt PowerPoint Presentation Ideas Slides
This is a gap analysis tool fishbone analysis 6 ms ppt powerpoint presentation ideas slides. This is a six stage process. The stages in this process are machinery, manpower, method, material, maintenance, mother nature, effect.
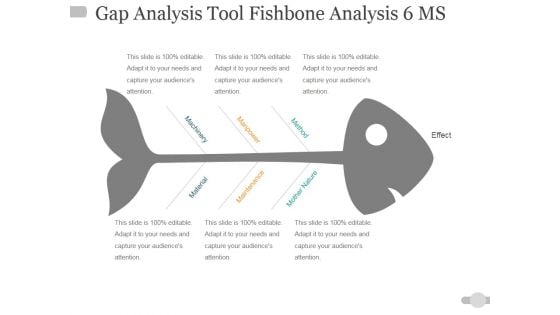
Gap Analysis Tool Fishbone Analysis 6 Ms Ppt PowerPoint Presentation Infographic Template Information
This is a gap analysis tool fishbone analysis 6 ms ppt powerpoint presentation infographic template information. This is a one stage process. The stages in this process are material, maintenance, mother nature, machinery, manpower, method, effect.

Gap Analysis Tool Fishbone Analysis 6 Ms Ppt Powerpoint Presentation Summary Samples
This is a gap analysis tool fishbone analysis 6 ms ppt powerpoint presentation summary samples. This is a three stage process. The stages in this process are machinery, manpower, method, effect.
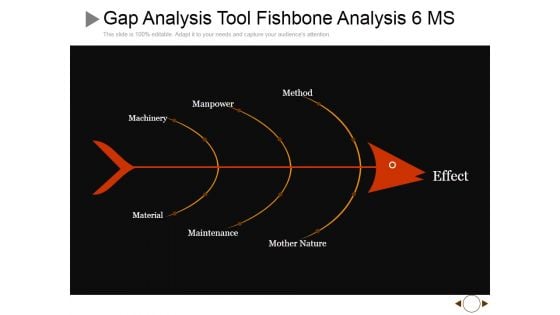
Gap Analysis Tool Fishbone Analysis 6 MS Ppt PowerPoint Presentation Summary Graphic Images
This is a gap analysis tool fishbone analysis 6 ms ppt powerpoint presentation summary graphic images. This is a three stage process. The stages in this process are machinery, manpower, method, effect, maintenance.
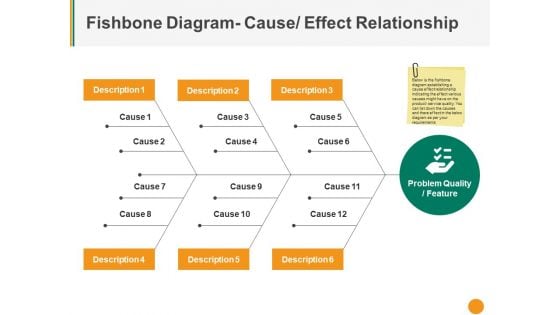
Fishbone Diagram Cause Effect Relationship Ppt PowerPoint Presentation Slides Master Slide
This is a fishbone diagram cause effect relationship ppt powerpoint presentation slides master slide. This is a three stage process. The stages in this process are description, cause, problem quality feature, management, strategy.
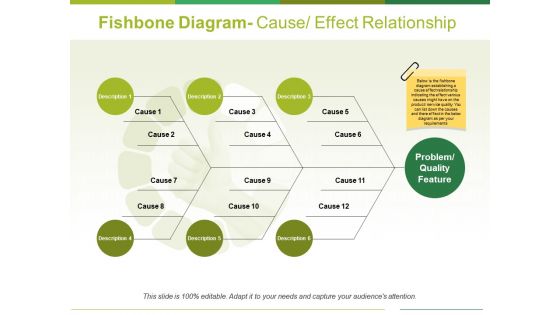
Fishbone Diagram Cause Effect Relationship Ppt PowerPoint Presentation Professional Background Designs
This is a fishbone diagram cause effect relationship ppt powerpoint presentation professional background designs. This is a twelve stage process. The stages in this process are description, cause, problem quality feature.
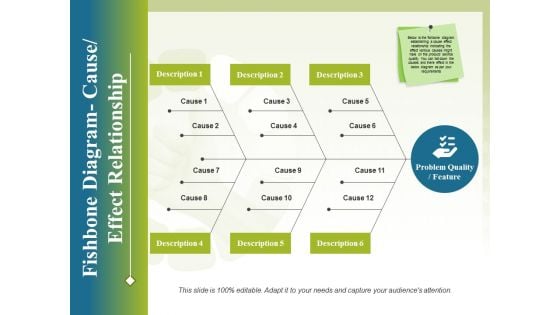
Fishbone Diagram Cause Effect Relationship Ppt PowerPoint Presentation Styles Design Inspiration
This is a fishbone diagram cause effect relationship ppt powerpoint presentation styles design inspiration. This is a three stage process. The stages in this process are business, process, analysis, strategy, management.
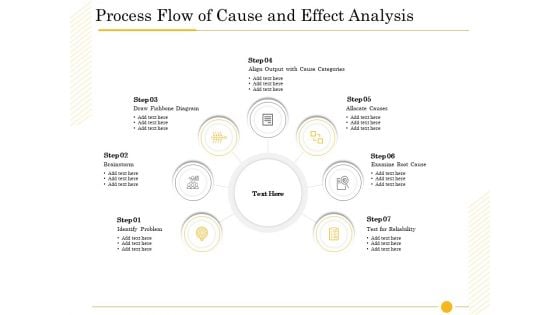
The Fishbone Analysis Tool Process Flow Of Cause And Effect Analysis Diagrams PDF
This is a the fishbone analysis tool process flow of cause and effect analysis diagrams pdf template with various stages. Focus and dispense information on seven stages using this creative set, that comes with editable features. It contains large content boxes to add your information on topics like align output cause categories, examine root cause, test reliability, draw fishbone diagram, identify problem. You can also showcase facts, figures, and other relevant content using this PPT layout. Grab it now.
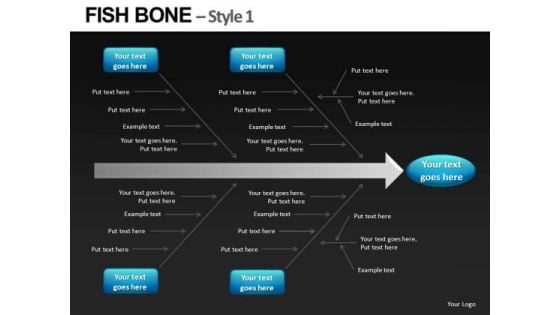
Fishbone Diagrams For Root Cause Analysis PowerPoint Slides Editable Ppt Templates
FishBone Diagrams for Root Cause Analysis PowerPoint Slides Editable PPT templates-These high quality powerpoint pre-designed slides and powerpoint templates have been carefully created by our professional team to help you impress your audience. All slides have been created and are 100% editable in powerpoint. Each and every property of any graphic - color, size, orientation, shading, outline etc. can be modified to help you build an effective powerpoint presentation. Any text can be entered at any point in the powerpoint template or slide. Simply DOWNLOAD, TYPE and PRESENT!These PowerPoint Presentation slides can be used for themes relating to--Arrow, cause, defect, deficiency, diagram, document, effect, envelope, environment, fishbone, flow, industry, kahashiwara, machine, manufacture, material, paper, pencil, safety, sketch Consider your promotion a surety with our Fishbone Diagrams For Root Cause Analysis PowerPoint Slides Editable Ppt Templates. You will come out on top.
Fishbone Diagram To Determine The Root Quality Control Planning Templates Set 1 Guidelines PDF
Following slide illustrates failure mode effect analysis worksheet that can be utilized by a firm to identify the root cause behind product or process failure. Presenting this PowerPoint presentation, titled Fishbone Diagram To Determine The Root Quality Control Planning Templates Set 1 Guidelines PDF, with topics curated by our researchers after extensive research. This editable presentation is available for immediate download and provides attractive features when used. Download now and captivate your audience. Presenting this Fishbone Diagram To Determine The Root Quality Control Planning Templates Set 1 Guidelines PDF. Our researchers have carefully researched and created these slides with all aspects taken into consideration. This is a completely customizable Fishbone Diagram To Determine The Root Quality Control Planning Templates Set 1 Guidelines PDF that is available for immediate downloading. Download now and make an impact on your audience. Highlight the attractive features available with our PPTs.
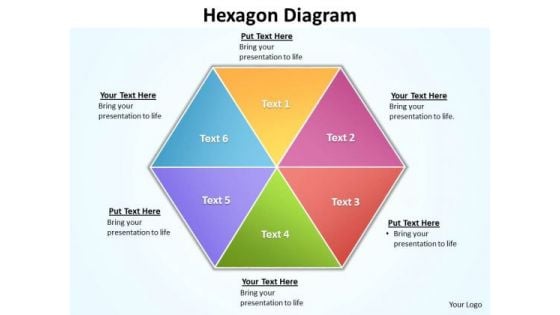
Ppt 6 Factors Hexagon Angles Free Fishbone Diagram PowerPoint Template Editable Templates
PPT 6 factors hexagon angles free fishbone diagram PowerPoint template editable Templates-Visually support your Microsoft office PPT Presentation with our above Diagram illustrating six factors combined in the form of Hexagon. This image identifies the concept of Inter-related issues to be explained together. Adjust the above image in your PPT presentations to visually support your content in your Business PPT slideshows -PPT 6 factors hexagon angles free fishbone diagram PowerPoint template editable Templates-attached, backgrounds, blue, cell, color, component, connect, connection, diagram, elements, geometric, graphic, group, hexagon, honeycomb, icon, illustration, intricacy, lines, link, map, mesh, model, network, science, shape, shiny, strategy, structure, symbol, teamwork, technology Our Ppt 6 Factors Hexagon Angles Free Fishbone Diagram PowerPoint Template Editable Templates will fetch it for you. They will bring audience adulation to your doorstep.
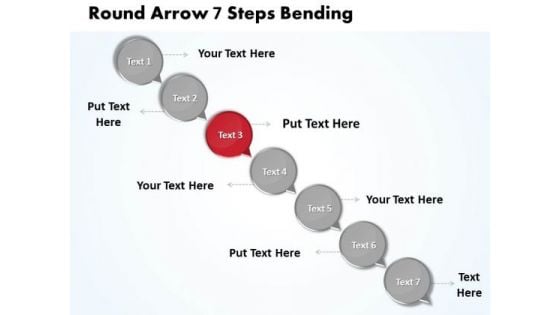
Ppt Circle Arrow Process 7 Steps Free Fishbone Diagram PowerPoint Template Templates
PPT circle arrow process 7 steps free fishbone diagram powerpoint template Templates-Deliver amazing Presentations with our above Diagram illustrating the Seven steps of the process to be explained in one single slide. This Diagram shows the Third stage with red color. Clarity of thought has been the key to your growth. Use our Diagram to illustrate your ability. You can change color, size and orientation of any icon to your liking. -PPT circle arrow process 7 steps free fishbone diagram powerpoint template Templates-Add, Aqua, Arrows, Badges, Bar, Blend, Blue, Bright, Bubbles, Buttons, Caution, Circle, Drop, Elements, Glossy, Glowing, Graphic, Heart, Help, Icons, Idea, Illustration, Navigation, Oblong, Plus, Round, Service, Shadow, Shiny, Sign, Speech, Squares Our Ppt Circle Arrow Process 7 Steps Free Fishbone Diagram PowerPoint Template Templates will keep u sane. Your thoughts will bolt across the line.
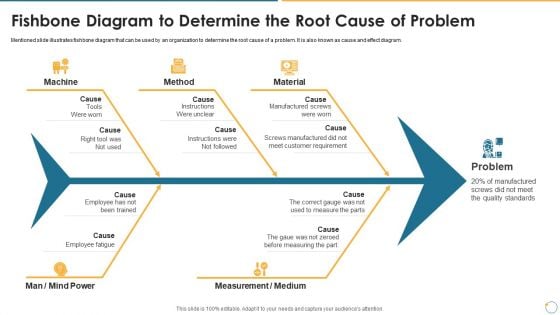
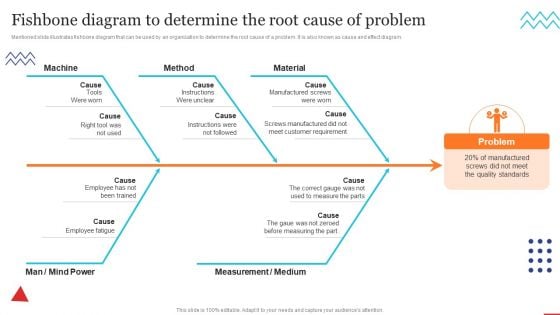
Collection Of Quality Assurance PPT Fishbone Diagram To Determine The Root Cause Of Problem Formats PDF
Mentioned slide illustrates fishbone diagram that can be used by an organization to determine the root cause of a problem. It is also known as cause and effect diagram. This is a collection of quality assurance ppt fishbone diagram to determine the root cause of problem formats pdf template with various stages. Focus and dispense information on five stages using this creative set, that comes with editable features. It contains large content boxes to add your information on topics like quality standards, manufactured, measure, requirement. You can also showcase facts, figures, and other relevant content using this PPT layout. Grab it now.

Fishbone Ishikawa Cause And Effect Analysis Cause And Effect Diagram Ppt PowerPoint Presentation Portfolio Influencers PDF
Presenting this set of slides with name fishbone ishikawa cause and effect analysis cause and effect diagram ppt powerpoint presentation portfolio influencers pdf. The topics discussed in these slides are cause and effect diagram. This is a completely editable PowerPoint presentation and is available for immediate download. Download now and impress your audience.
Fishbone Ishikawa Cause And Effect Analysis Idea Generation Ppt PowerPoint Presentation Layouts Diagrams PDF
Presenting this set of slides with name fishbone ishikawa cause and effect analysis idea generation ppt powerpoint presentation layouts diagrams pdf. This is a four stage process. The stages in this process are idea generation. This is a completely editable PowerPoint presentation and is available for immediate download. Download now and impress your audience.
Fishbone Ishikawa Cause And Effect Analysis Ppt PowerPoint Presentation Complete Deck With Slides
Presenting this set of slides with name fishbone ishikawa cause and effect analysis ppt powerpoint presentation complete deck with slides. The topics discussed in these slides are business, management, strategy, planning, marketing. This is a completely editable PowerPoint presentation and is available for immediate download. Download now and impress your audience.
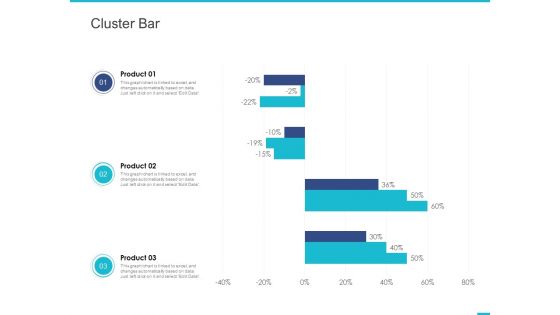
Fishbone Ishikawa Cause And Effect Analysis Cluster Bar Ppt PowerPoint Presentation Portfolio Summary PDF
Presenting this set of slides with name fishbone ishikawa cause and effect analysis cluster bar ppt powerpoint presentation portfolio summary pdf. The topics discussed in these slide is cluster bar. This is a completely editable PowerPoint presentation and is available for immediate download. Download now and impress your audience.

Fishbone Ishikawa Cause And Effect Analysis Magnifying Glass Ppt PowerPoint Presentation Summary Objects PDF
Presenting this set of slides with name fishbone ishikawa cause and effect analysis magnifying glass ppt powerpoint presentation summary objects pdf. This is a four stage process. The stages in this process are magnifying glass. This is a completely editable PowerPoint presentation and is available for immediate download. Download now and impress your audience.
Fishbone Ishikawa Cause And Effect Analysis Our Goals Ppt PowerPoint Presentation Show Outfit PDF
Presenting this set of slides with name fishbone ishikawa cause and effect analysis our goals ppt powerpoint presentation show outfit pdf. This is a five stage process. The stages in this process are our goals. This is a completely editable PowerPoint presentation and is available for immediate download. Download now and impress your audience.

Fishbone Ishikawa Cause And Effect Analysis Our Mission Ppt PowerPoint Presentation Layouts Picture PDF
Presenting this set of slides with name fishbone ishikawa cause and effect analysis our mission ppt powerpoint presentation layouts picture pdf. This is a three stage process. The stages in this process are vision, mission, goal. This is a completely editable PowerPoint presentation and is available for immediate download. Download now and impress your audience.

Fishbone Ishikawa Cause And Effect Analysis Our Team Ppt PowerPoint Presentation Portfolio Professional PDF
Presenting this set of slides with name fishbone ishikawa cause and effect analysis our team ppt powerpoint presentation portfolio professional pdf. This is a three stage process. The stages in this process are our team. This is a completely editable PowerPoint presentation and is available for immediate download. Download now and impress your audience.
Fishbone Ishikawa Cause And Effect Analysis Puzzle Ppt PowerPoint Presentation File Graphics Template PDF
Presenting this set of slides with name fishbone ishikawa cause and effect analysis puzzle ppt powerpoint presentation file graphics template pdf. This is a five stage process. The stages in this process are puzzle. This is a completely editable PowerPoint presentation and is available for immediate download. Download now and impress your audience.
Fishbone Ishikawa Cause And Effect Analysis Sources Of Variation Machine Ppt PowerPoint Presentation Gallery Icon PDF
Presenting this set of slides with name fishbone ishikawa cause and effect analysis sources of variation machine ppt powerpoint presentation gallery icon pdf. The topics discussed in these slides are equipment, physical conditions, effectiveness, machine serviced regularly. This is a completely editable PowerPoint presentation and is available for immediate download. Download now and impress your audience.
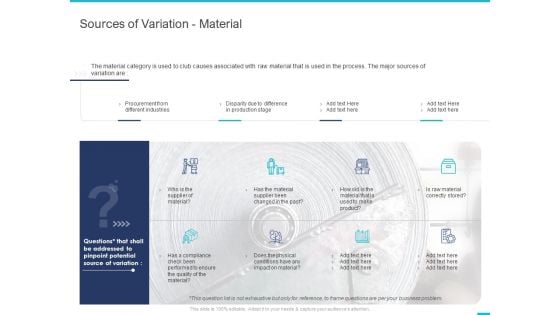
Fishbone Ishikawa Cause And Effect Analysis Sources Of Variation Material Ppt PowerPoint Presentation Graphics PDF
Presenting this set of slides with name fishbone ishikawa cause and effect analysis sources of variation material ppt powerpoint presentation graphics pdf. The topics discussed in these slides are procurement different industries, disparity due difference production stage, supplier material. This is a completely editable PowerPoint presentation and is available for immediate download. Download now and impress your audience.
Fishbone Ishikawa Cause And Effect Analysis Stacked Column Ppt PowerPoint Presentation File Icons PDF
Presenting this set of slides with name fishbone ishikawa cause and effect analysis stacked column ppt powerpoint presentation file icons pdf. The topics discussed in these slide is stacked column. This is a completely editable PowerPoint presentation and is available for immediate download. Download now and impress your audience.

Fishbone Ishikawa Cause And Effect Analysis Thank You Ppt PowerPoint Presentation File Backgrounds PDF
Presenting this set of slides with name fishbone ishikawa cause and effect analysis thank you ppt powerpoint presentation file backgrounds pdf. The topics discussed in these slide is thank you. This is a completely editable PowerPoint presentation and is available for immediate download. Download now and impress your audience.
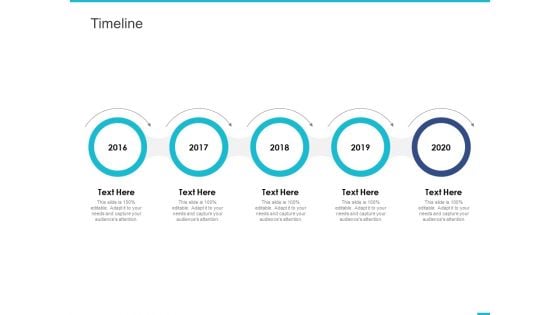
Fishbone Ishikawa Cause And Effect Analysis Timeline Ppt PowerPoint Presentation Layouts Graphics PDF
Presenting this set of slides with name fishbone ishikawa cause and effect analysis timeline ppt powerpoint presentation layouts graphics pdf. This is a five stage process. The stages in this process are timeline, 2016 to 2020. This is a completely editable PowerPoint presentation and is available for immediate download. Download now and impress your audience.

Fishbone Ishikawa Cause And Effect Analysis Sources Of Variation Environment Ppt PowerPoint Presentation Slides Objects PDF
Presenting this set of slides with name fishbone ishikawa cause and effect analysis sources of variation environment ppt powerpoint presentation slides objects pdf. The topics discussed in these slides are changes physical conditions, such temperature, humidity, environment conditions, specify environment control equipment calibrated. This is a completely editable PowerPoint presentation and is available for immediate download. Download now and impress your audience.
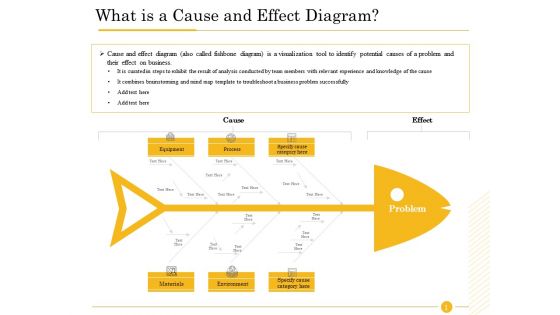
The Fishbone Analysis Tool What Is A Cause And Effect Diagram Guidelines PDF
Deliver an awe-inspiring pitch with this creative the fishbone analysis tool what is a cause and effect diagram guidelines pdf bundle. Topics like equipment, process, specify cause category, materials, environment, combines brainstorming mind map, business problem successfully can be discussed with this completely editable template. It is available for immediate download depending on the needs and requirements of the user.
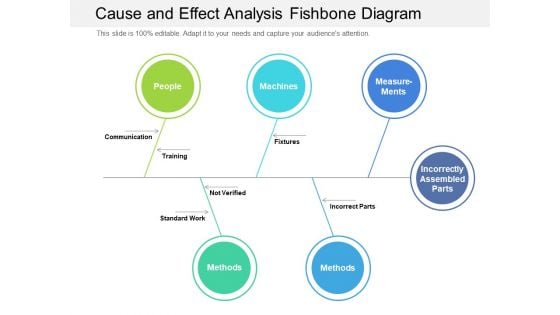
Cause And Effect Analysis Fishbone Diagram Ppt PowerPoint Presentation Gallery Designs PDF
Presenting this set of slides with name cause and effect analysis fishbone diagram ppt powerpoint presentation gallery designs pdf. This is a five stage process. The stages in this process are communication, training, fixtures. This is a completely editable PowerPoint presentation and is available for immediate download. Download now and impress your audience.
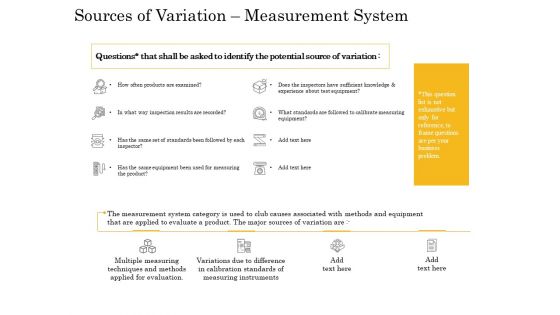
The Fishbone Analysis Tool Sources Of Variation Measurement System Slides PDF
Deliver and pitch your topic in the best possible manner with this the fishbone analysis tool sources of variation measurement system slides pdf. Use them to share invaluable insights on calibrate measuring equipment, measuring product, sufficient knowledge experience, system category, sources variation, evaluate a product and impress your audience. This template can be altered and modified as per your expectations. So, grab it now.
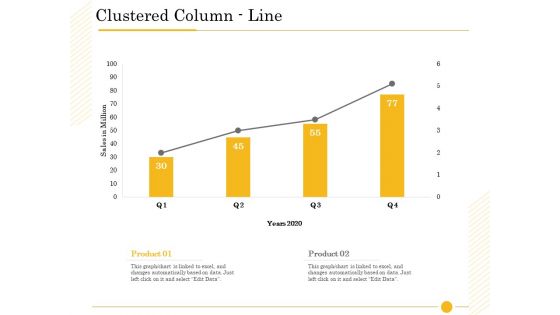
The Fishbone Analysis Tool Clustered Column Line Ppt Pictures Guidelines PDF
Deliver an awe-inspiring pitch with this creative the fishbone analysis tool clustered column line ppt pictures guidelines pdf bundle. Topics like Product 01, Product 02, product can be discussed with this completely editable template. It is available for immediate download depending on the needs and requirements of the user.
The Fishbone Analysis Tool How Do I Do It Ppt Icon Infographics PDF
Deliver an awe-inspiring pitch with this creative the fishbone analysis tool how do i do it ppt icon infographics pdf bundle. Topics like impacting business, directly involved, business situation to participants, identify problem issue, identification analyses can be discussed with this completely editable template. It is available for immediate download depending on the needs and requirements of the user.
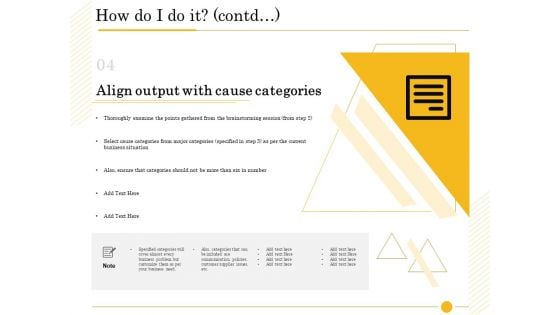
The Fishbone Analysis Tool How Do I Do It Contd Specified Professional PDF
Deliver an awe-inspiring pitch with this creative the fishbone analysis tool how do i do it contd specified professional pdf bundle. Topics like current business situation, communication policies, categories included, business problem customize, brainstorming session can be discussed with this completely editable template. It is available for immediate download depending on the needs and requirements of the user.
Fishbone Ishikawa Cause And Effect Analysis Table Of Contents Ppt PowerPoint Presentation Icon Format PDF
Presenting this set of slides with name fishbone ishikawa cause and effect analysis table of contents ppt powerpoint presentation icon format pdf. This is a seven stage process. The stages in this process are cause and effect analysis, cause and effect diagram, sources variation, environment, measurement system, material, machine. This is a completely editable PowerPoint presentation and is available for immediate download. Download now and impress your audience.
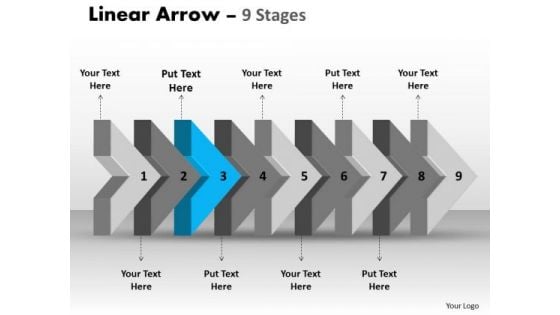
Ppt Template Beeline Flow Arrow Free Fishbone Diagram PowerPoint 4 Image
We present our PPT template beeline flow arrow free fishbone diagram PowerPoint 4 Image. Use our Symbol PowerPoint Templates because; enlighten them with your brilliant understanding of mental health. Use our Shapes PowerPoint Templates because, designed to attract the attention of your audience. Use our Signs PowerPoint Templates because, the lessons have been analyzed, studied and conclusions drawn. Use our Arrows PowerPoint Templates because, an occasion for gifting and giving. Use our Process and Flows PowerPoint Templates because, you have the moves to sway the market. Use these PowerPoint slides for presentations relating to Abstract, Age, Ancient, Antique, Arrows, Art, Artistic, Background, Colors, Decoration, Design, Dynamic, Elegant, Element, Future, Illustration, Index, Linear, Lines, Modern, Old, Paper, Pattern, Scratch, Text, Texture, Up, Vintage. The prominent colors used in the PowerPoint template are Blue, Gray, and Black Amaze yourself with our Ppt Template Beeline Flow Arrow Free Fishbone Diagram PowerPoint 4 Image. You will be astounded by what is on offer.
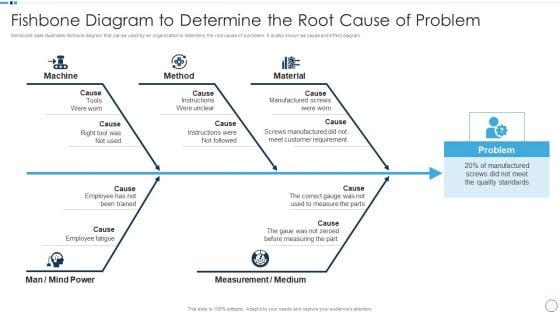
QA Plan Set 1 Fishbone Diagram To Determine The Root Cause Of Problem Professional PDF
This is a QA Plan Set 1 Fishbone Diagram To Determine The Root Cause Of Problem Professional PDF template with various stages. Focus and dispense information on five stages using this creative set, that comes with editable features. It contains large content boxes to add your information on topics like Method, Material, Measurement. You can also showcase facts, figures, and other relevant content using this PPT layout. Grab it now.
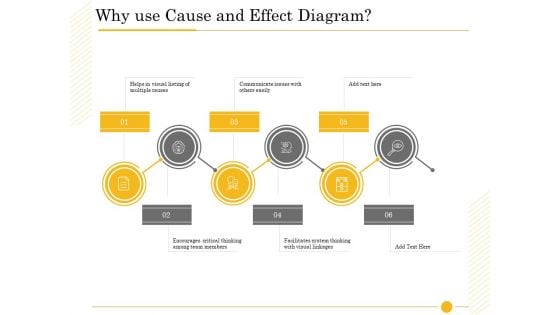
The Fishbone Analysis Tool Why Use Cause And Effect Diagram Mockup PDF
This is a the fishbone analysis tool why use cause and effect diagram mockup pdf template with various stages. Focus and dispense information on six stages using this creative set, that comes with editable features. It contains large content boxes to add your information on topics like communicate issues, encourages critical thinking, team members, facilitates system thinking, listing multiple causes. You can also showcase facts, figures, and other relevant content using this PPT layout. Grab it now.
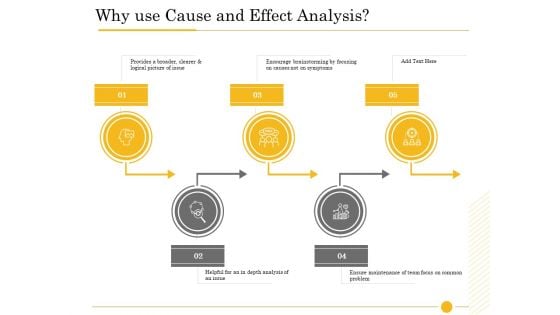
The Fishbone Analysis Tool Why Use Cause And Effect Analysis Template PDF
Presenting the fishbone analysis tool why use cause and effect analysis template pdf to provide visual cues and insights. Share and navigate important information on five stages that need your due attention. This template can be used to pitch topics like depth analysis, ensure maintenance, encourage brainstorming focusing, logical picture issue, why use cause effect analysis. In addtion, this PPT design contains high-resolution images, graphics, etc, that are easily editable and available for immediate download.
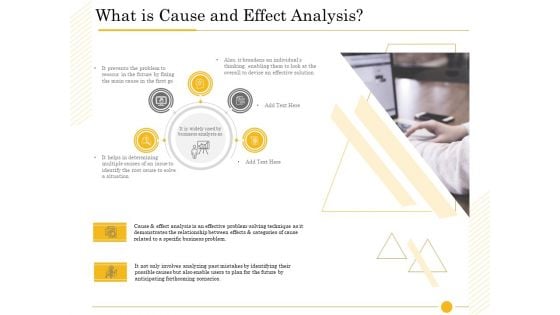
The Fishbone Tool What Is Cause And Effect Analysis Effective Sample PDF
Presenting the fishbone tool what is cause and effect analysis effective sample pdf to provide visual cues and insights. Share and navigate important information on one stage that need your due attention. This template can be used to pitch topics like business analysts, determining multiple, broadens individuals, devise effective solution, prevents problem, demonstrates relationship, anticipating forthcoming scenarios. In addtion, this PPT design contains high-resolution images, graphics, etc, that are easily editable and available for immediate download.
The Fishbone Analysis Tool Post It Notes Ppt Inspiration Picture PDF
This is a the fishbone analysis tool post it notes ppt inspiration picture pdf template with various stages. Focus and dispense information on three stages using this creative set, that comes with editable features. It contains large content boxes to add your information on topics like post it notes. You can also showcase facts, figures, and other relevant content using this PPT layout. Grab it now.
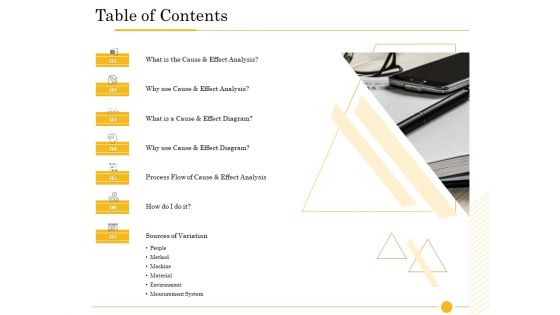
The Fishbone Analysis Tool Table Of Contents Ppt Styles Background Designs PDF
Presenting the fishbone analysis tool table of contents ppt styles background designs pdf to provide visual cues and insights. Share and navigate important information on seven stages that need your due attention. This template can be used to pitch topics like measurement system, sources variation, effect analysis, machine, environment, table contents. In addtion, this PPT design contains high-resolution images, graphics, etc, that are easily editable and available for immediate download.
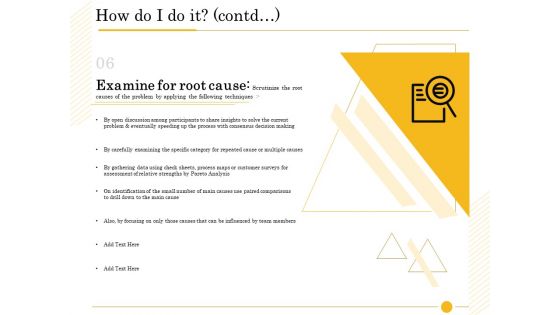
The Fishbone Analysis Tool How Do I Do It Contd Process Clipart PDF
Deliver and pitch your topic in the best possible manner with this the fishbone analysis tool how do i do it contd process clipart pdf. Use them to share invaluable insights on consensus decision making, customer surveys assessment relative strengths, process maps, paired comparisons, influenced team members, eventually speeding process and impress your audience. This template can be altered and modified as per your expectations. So, grab it now.
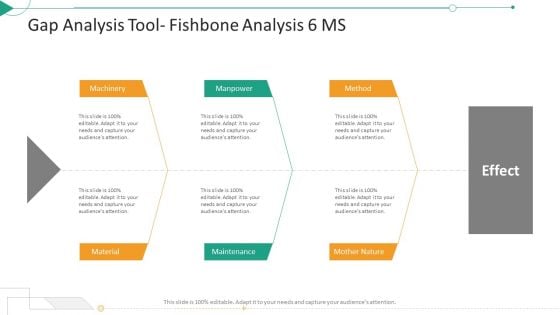
Strategic Planning Needs Evaluation Gap Analysis Tool Fishbone Analysis 6 MS Portrait PDF
Presenting strategic planning needs evaluation gap analysis tool fishbone analysis 6 ms portrait pdf to provide visual cues and insights. Share and navigate important information on three stages that need your due attention. This template can be used to pitch topics like machinery, material, maintenance, method. In addtion, this PPT design contains high resolution images, graphics, etc, that are easily editable and available for immediate download.
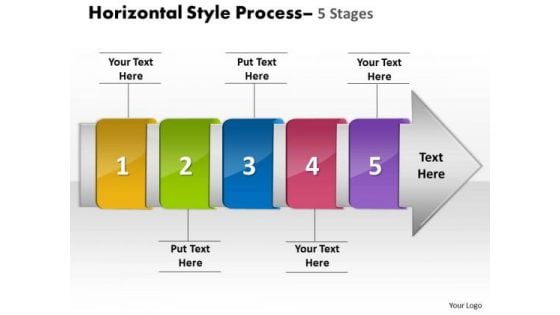
Ppt Horizontal Flow Of 5 Stage Free Fishbone Diagram PowerPoint Template 1 Design
We present our PPT horizontal flow of 5 stage free fishbone diagram PowerPoint template 1 design. Use our Design PowerPoint Templates because, your quicksilver ideas are the arrows in your quiver. Use our Shapes PowerPoint Templates because, All elements of the venture are equally critical. Use our Business PowerPoint Templates because, Profit fairly earned is what you believe in. Use our Process and Flows PowerPoint Templates because, transmit your thoughts via our slides and prod your team to action. Use our Arrows PowerPoint Templates because, Business Template: - There is a vision, a need you can meet. Use these PowerPoint slides for presentations relating to accent, advertisement, aqua, arrow, blank, business, button, collection, color, decoration, design, direction, element, empty, financial, flow, graph, green, grey, horizontal, instruction, isolated, placard, process, promo, promotion, sale, set, shape, shiny, silver, steps, symbol. The prominent colors used in the PowerPoint template are Red, Green, and Blue navy Define growth with our Ppt Horizontal Flow Of 5 Stage Free Fishbone Diagram PowerPoint Template 1 Design. Download without worries with our money back guaranteee.
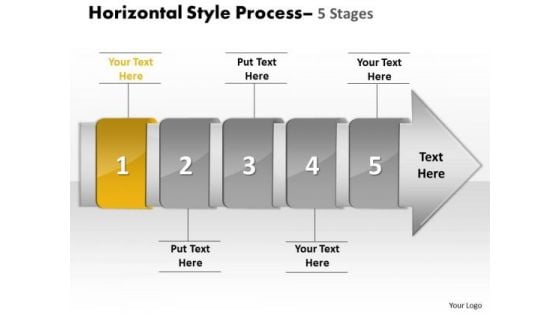
Ppt Horizontal Flow Of 5 Stage Free Fishbone Diagram PowerPoint Template 2 Design
We present our PPT horizontal flow of 5 stage free fishbone diagram PowerPoint template 2 design. Use our Design PowerPoint Templates because; enlighten others on your team with your views. Use our Shapes PowerPoint Templates because; amplify on this basic corporate concept and forefront the benefits of overlapping processes to arrive at common goals. Use our Business PowerPoint Templates because, Marketing Strategy Business Template: - Maximizing sales of your product is the intended destination. Use our Process and Flows PowerPoint Templates because, organize your thoughts and illuminate your ideas accordingly. Use our Arrows PowerPoint Templates because, you have some excellent plans to spread some more of it across your community. Use these PowerPoint slides for presentations relating to accent, advertisement, aqua, arrow, blank, business, button, collection, color, decoration, design, direction, element, empty, financial, flow, graph, green, grey, horizontal, instruction, isolated, placard, process, promo, promotion, sale, set, shape, shiny, silver, steps, symbol. The prominent colors used in the PowerPoint template are Yellow, Gray, and White Win awards with our Ppt Horizontal Flow Of 5 Stage Free Fishbone Diagram PowerPoint Template 2 Design. You will come out on top.
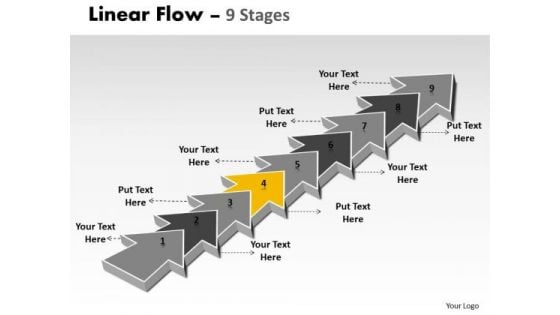
Ppt Background 9 Stages Linear Means Free Fishbone Diagram PowerPoint Template 5 Graphic
We present our PPT Background 9 stages linear means free fishbone diagram PowerPoint template 5 Graphic. Use our Arrows PowerPoint Templates because; Highlight the key components of your entire manufacturing/ business process. Use our Communication PowerPoint Templates because, Show how one can contribute to the overall feeling of wellbeing. Use our Shapes PowerPoint Templates because, your ideas are fundamentally stable with a broad base of workable possibilities. Use our Business PowerPoint Templates because; explain the contribution of each of the elements and how they provide impetus to the next phase. Use our Process and Flows PowerPoint Templates because, you have what it takes to grow. Use these PowerPoint slides for presentations relating to background, blog, business, chain, communication, connection, constructive, contact, design, diagonal, dialog, digital, flow, global, interaction, internet, line, linear, network, partner, pointer, reaction, social, stream, structure, system, team,. The prominent colors used in the PowerPoint template are Yellow, Gray, and White Catapult your thoughts with our Ppt Background 9 Stages Linear Means Free Fishbone Diagram PowerPoint Template 5 Graphic. They will travel a great distance.
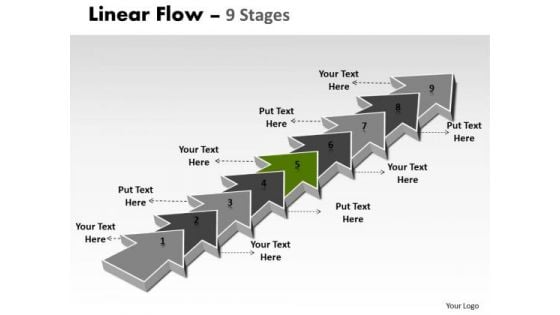
Ppt Background 9 Stages Linear Means Free Fishbone Diagram PowerPoint Template 6 Graphic
We present our PPT Background 9 stages linear means free fishbone diagram PowerPoint template 6 Graphic. Use our Arrows PowerPoint Templates because; motivate your team to cross all barriers. Use our Communication PowerPoint Templates because, our presentation designs are for those on the go. Use our Shapes PowerPoint Templates because, you have the plans ready for them to absorb and understand. Use our Business PowerPoint Templates because, Marketing Strategy Business Template: - Maximizing sales of your product is the intended destination. Use our Process and Flows PowerPoint Templates because, and watch them strengthen your companys sinews. Use these PowerPoint slides for presentations relating to background, blog, business, chain, communication, connection, constructive, contact, design, diagonal, dialog, digital, flow, global, interaction, internet, line, linear, network, partner, pointer, reaction, social, stream, structure, system, team,. The prominent colors used in the PowerPoint template are Green, Gray, and White Use our Ppt Background 9 Stages Linear Means Free Fishbone Diagram PowerPoint Template 6 Graphic to meet deadlines. They are readymade to fit into any presentation structure.
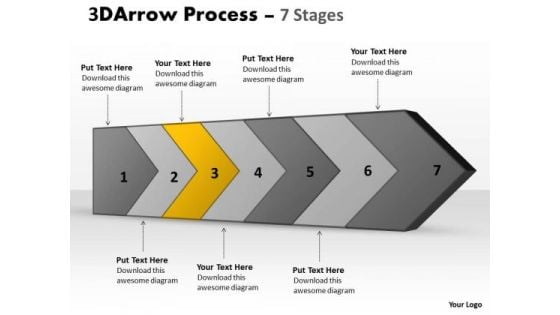
Ppt Template 3d Continuous Arrow Steps Free Fishbone Diagram PowerPoint 4 Design
We present our PPT template 3d continuous arrow steps free fishbone diagram PowerPoint 4 design. Use our Arrows PowerPoint Templates because, you have the people in place, selected the team leaders and all are raring to go. Use our Business PowerPoint Templates because, anticipate the doubts and questions in the minds of your colleagues and enlighten them with your inspired strategy to garner desired success. Use our Marketing PowerPoint Templates because; Highlight the various ways in which we can maintain its efficiency. Use our Success PowerPoint Templates because; Trigger their minds with your interesting ideas. Use our Process and Flows PowerPoint Templates because, the ideas and plans are on your finger tips. Use these PowerPoint slides for presentations relating to 3d, Arrow, Background, Bullet, Business, Chart, Checkmark, Chevron, Diagram, Drop, Eps10, Financial, Five, Glass, Graphic, Icon, Illustration, Isometric, Management, Perspective, Placeholder, Point, Process, Project, Reflection, Set, Shadow, Silver, Stage, Text, Transparency, Vector. The prominent colors used in the PowerPoint template are Yellow, Gray, and Black Our Ppt Template 3d Continuous Arrow Steps Free Fishbone Diagram PowerPoint 4 Design make a delicious offering. The audience will be drooling for more.
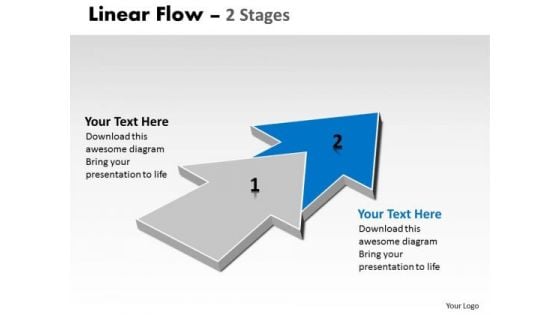
Ppt Background Progression Of 2 Stages Flow Free Fishbone Diagram PowerPoint Template 3 Design
We present our PPT Background progression of 2 stages flow free fishbone diagram PowerPoint template 3 design. Use our Arrows PowerPoint Templates because, The Venn graphic comprising interlinking circles geometrically demonstrate how various functions operating independently, to a large extent, are essentially interdependent. Use our Shapes PowerPoint Templates because, the ideas and plans are on your fingertips. Use our Business PowerPoint Templates because, Use our to enthuse your colleagues. Use our Signs PowerPoint Templates because, they are logical, accurate and to the point. Use our Process and Flows PowerPoint Templates because, we offer you a range of options to garner their interest. Use these PowerPoint slides for presentations relating to abstract, algorithm, arrow, business, chart, connection, design, development, diagram, direction, element, flow, graph, linear, linear diagram, management, organization, plan, process, section, segment, set, sign, solution, strategy, symbol, vector. The prominent colors used in the PowerPoint template are Blue, Gray, and White Clarify doubts with our Ppt Background Progression Of 2 Stages Flow Free Fishbone Diagram PowerPoint Template 3 Design. Download without worries with our money back guaranteee.

Administering Quality Assurance Conduct Root Cause Analysis Through Fishbone Diagram PM SS V
This slide shows sample root cause analysis of a project that encountered some quality issues at time of project delivery to the client. It include different causes such as team issues, materials and methodology, etc. From laying roadmaps to briefing everything in detail, our templates are perfect for you. You can set the stage with your presentation slides. All you have to do is download these easy-to-edit and customizable templates. Administering Quality Assurance Conduct Root Cause Analysis Through Fishbone Diagram PM SS V will help you deliver an outstanding performance that everyone would remember and praise you for. Do download this presentation today. This slide shows sample root cause analysis of a project that encountered some quality issues at time of project delivery to the client. It include different causes such as team issues, materials and methodology, etc.

The Fishbone Analysis Tool Ppt PowerPoint Presentation Complete Deck With Slides
This complete deck acts as a great communication tool. It helps you in conveying your business message with personalized sets of graphics, icons etc. Comprising a set of thirty three slides, this complete deck can help you persuade your audience. It also induces strategic thinking as it has been thoroughly researched and put together by our experts. Not only is it easily downloadable but also editable. The color, graphics, theme any component can be altered to fit your individual needs. So grab it now.
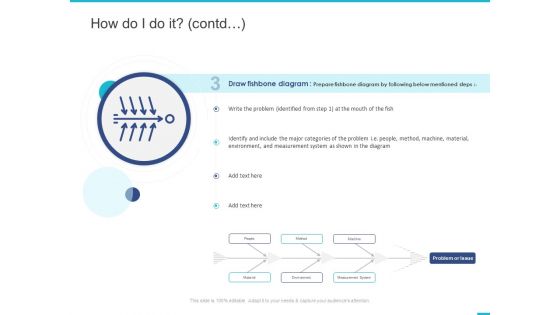
Fishbone Ishikawa Cause And Effect Analysis How Do I Do It Contd Material Ppt PowerPoint Presentation Model Picture PDF
Presenting this set of slides with name fishbone ishikawa cause and effect analysis how do i do it contd material ppt powerpoint presentation model picture pdf. This is a one stage process. The stages in this process are draw fishbone diagram, problem, measurement system, material. This is a completely editable PowerPoint presentation and is available for immediate download. Download now and impress your audience.
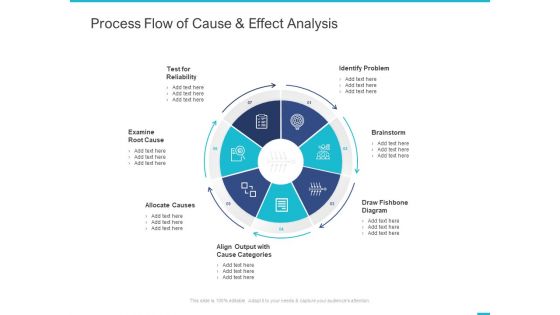
Fishbone Ishikawa Cause And Effect Analysis Process Flow Of Cause And Effect Analysis Ppt PowerPoint Presentation Show Design Ideas PDF
Presenting this set of slides with name fishbone ishikawa cause and effect analysis process flow of cause and effect analysis ppt powerpoint presentation show design ideas pdf. This is a seven stage process. The stages in this process are test for reliability, examine root cause, allocate causes, align output with cause categories, draw fishbone diagram, brainstorm, identify problem. This is a completely editable PowerPoint presentation and is available for immediate download. Download now and impress your audience.
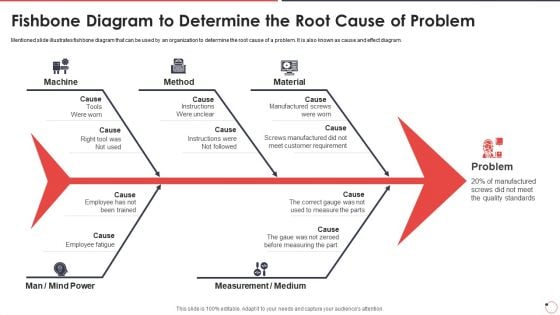
Quality Assurance Templates Set 1 Fishbone Diagram To Determine The Root Cause Of Problem Ppt Show Graphic Images PDF
Mentioned slide illustrates fishbone diagram that can be used by an organization to determine the root cause of a problem. It is also known as cause and effect diagram. Presenting quality assurance templates set 1 fishbone diagram to determine the root cause of problem ppt show graphic images pdf to provide visual cues and insights. Share and navigate important information on five stages that need your due attention. This template can be used to pitch topics like machine, method, material. In addtion, this PPT design contains high resolution images, graphics, etc, that are easily editable and available for immediate download.


 Continue with Email

 Home
Home


