Five Phases
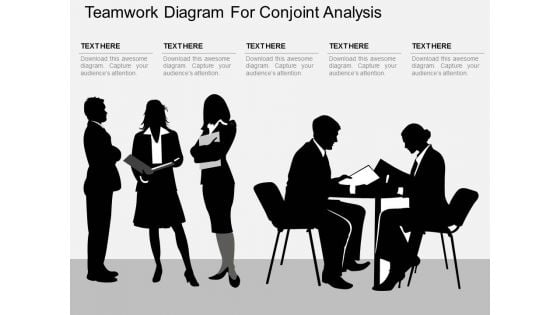
Teamwork Diagram For Conjoint Analysis Powerpoint Template
Download this exclusive diagram to present teamwork and conjoint analysis. This PPT slide contains graphics business people silhouette. This diagram is useful for business presentations.
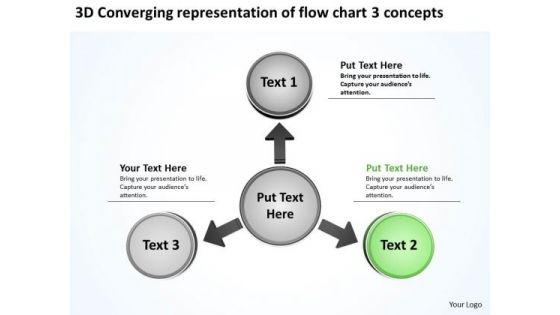
Of Flow Chart 3 Concepts Ppt Relative Circular Arrow Diagram PowerPoint Slides
We present our of flow chart 3 concepts ppt Relative Circular Arrow Diagram PowerPoint Slides.Use our Ring Charts PowerPoint Templates because our PowerPoint templates give this step by step process to acheive the aim. Download and present our Circle charts PowerPoint Templates because you can take it along a sure fire road to good profit. Download and present our Arrows PowerPoint Templates because this layout helps you to see satisfaction spread across the room as they unravel your gifted views. Download our Process and Flows PowerPoint Templates because readymade PowerPoint templates can prove best of your knowledge for your slides to show. Download and present our Success PowerPoint Templates because your quest has taken you well onto the path of success.Use these PowerPoint slides for presentations relating to Arrow, card, choice, concept,creative, design, direction, flow, four,illustration, infographic, instruction, label,layout, manual, marketing, modern, next,number, offer, options, order, page,paper, pointer, process, product,promotion, sequence, simple, special,step, symbol. The prominent colors used in the PowerPoint template are Green lime , White, Gray. People tell us our of flow chart 3 concepts ppt Relative Circular Arrow Diagram PowerPoint Slides look good visually. Customers tell us our design PowerPoint templates and PPT Slides provide great value for your money. Be assured of finding the best projection to highlight your words. Professionals tell us our of flow chart 3 concepts ppt Relative Circular Arrow Diagram PowerPoint Slides are Energetic. Presenters tell us our concept PowerPoint templates and PPT Slides will save the presenter time. Use our of flow chart 3 concepts ppt Relative Circular Arrow Diagram PowerPoint Slides are designed by professionals Presenters tell us our creative PowerPoint templates and PPT Slides will make you look like a winner. Distill your thoughts with our Of Flow Chart 3 Concepts Ppt Relative Circular Arrow Diagram PowerPoint Slides. They will draw outthe essence of it all.
Vertical Timeline With Years And Icons Powerpoint Slides
This PowerPoint timeline slide design can be used to display yearly business growth. It contain vertical timeline diagram with years and icons. This timeline template can be used in presentations where you need to display business strategy and planning.
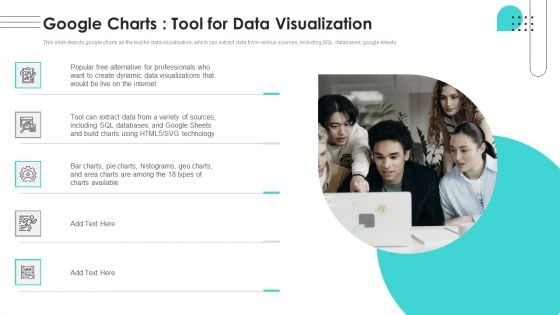
Branches For Visualization Research And Development Google Charts Tool For Data Elements PDF
This slide depicts google charts as the tool for data visualization, which can extract data from various sources, including SQL, databases, google sheets. Do you have an important presentation coming up Are you looking for something that will make your presentation stand out from the rest Look no further than Branches For Visualization Research And Development Google Charts Tool For Data Elements PDF. With our professional designs, you can trust that your presentation will pop and make delivering it a smooth process. And with Slidegeeks, you can trust that your presentation will be unique and memorable. So why wait Grab Branches For Visualization Research And Development Google Charts Tool For Data Elements PDF today and make your presentation stand out from the rest.
5 Stages Planning Design Ppt PowerPoint Presentation Complete Deck With Slides
If designing a presentation takes a lot of your time and resources and you are looking for a better alternative, then this 5 stages planning design ppt powerpoint presentation complete deck with slides is the right fit for you. This is a prefabricated set that can help you deliver a great presentation on the topic. All the twelve slides included in this sample template can be used to present a birds-eye view of the topic. These slides are also fully editable, giving you enough freedom to add specific details to make this layout more suited to your business setting. Apart from the content, all other elements like color, design, theme are also replaceable and editable. This helps in designing a variety of presentations with a single layout. Not only this, you can use this PPT design in formats like PDF, PNG, and JPG once downloaded. Therefore, without any further ado, download and utilize this sample presentation as per your liking.

5S Lean Production Strategies Ppt PowerPoint Presentation Complete Deck With Slides
If designing a presentation takes a lot of your time and resources and you are looking for a better alternative, then this 5S Lean Production Strategies Ppt PowerPoint Presentation Complete Deck With Slides is the right fit for you. This is a prefabricated set that can help you deliver a great presentation on the topic. All the twelve slides included in this sample template can be used to present a birds-eye view of the topic. These slides are also fully editable, giving you enough freedom to add specific details to make this layout more suited to your business setting. Apart from the content, all other elements like color, design, theme are also replaceable and editable. This helps in designing a variety of presentations with a single layout. Not only this, you can use this PPT design in formats like PDF, PNG, and JPG once downloaded. Therefore, without any further ado, download and utilize this sample presentation as per your liking.
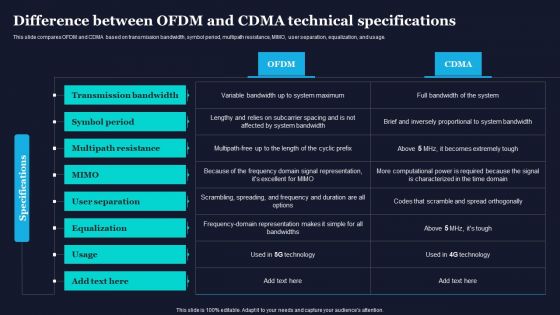
Difference Between Ofdm And Cdma Technical Specifications Difference Between 4G And 5G Network Introduction PDF
This slide compares OFDM and CDMA based on transmission bandwidth, symbol period, multipath resistance, MIMO, user separation, equalization, and usage.Do you know about Slidesgeeks Difference Between Ofdm And Cdma Technical Specifications Difference Between 4G And 5G Network Introduction PDF These are perfect for delivering any kind od presentation. Using it, create PowerPoint presentations that communicate your ideas and engage audiences. Save time and effort by using our pre-designed presentation templates that are perfect for a wide range of topic. Our vast selection of designs covers a range of styles, from creative to business, and are all highly customizable and easy to edit. Download as a PowerPoint template or use them as Google Slides themes.
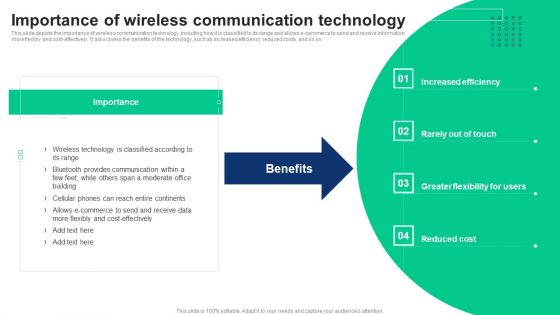
1G To 5G Cellular Importance Of Wireless Communication Technology Slides PDF
This slide depicts the importance of wireless communication technology, including how it is classified to its range and allows e-commerce to send and receive information more flexibly and cost-effectively. It also covers the benefits of the technology, such as increased efficiency, reduced costs, and so on. Do you know about Slidesgeeks 1G To 5G Cellular Importance Of Wireless Communication Technology Slides PDF These are perfect for delivering any kind od presentation. Using it, create PowerPoint presentations that communicate your ideas and engage audiences. Save time and effort by using our pre-designed presentation templates that are perfect for a wide range of topic. Our vast selection of designs covers a range of styles, from creative to business, and are all highly customizable and easy to edit. Download as a PowerPoint template or use them as Google Slides themes.
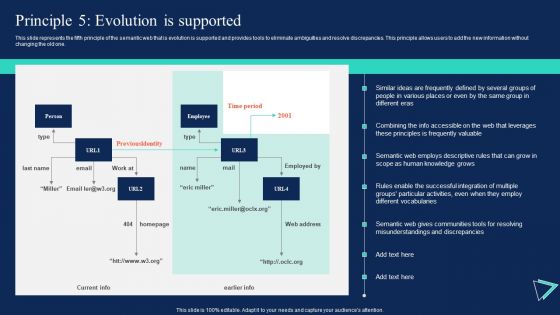
Enterprise Information Web Standards Principle 5 Evolution Is Supported Graphics PDF
This slide represents the fifth principle of the semantic web that is evolution is supported and provides tools to eliminate ambiguities and resolve discrepancies. This principle allows users to add the new information without changing the old one. Do you know about Slidesgeeks Enterprise Information Web Standards Principle 5 Evolution Is Supported Graphics PDF These are perfect for delivering any kind od presentation. Using it, create PowerPoint presentations that communicate your ideas and engage audiences. Save time and effort by using our pre designed presentation templates that are perfect for a wide range of topic. Our vast selection of designs covers a range of styles, from creative to business, and are all highly customizable and easy to edit. Download as a PowerPoint template or use them as Google Slides themes.
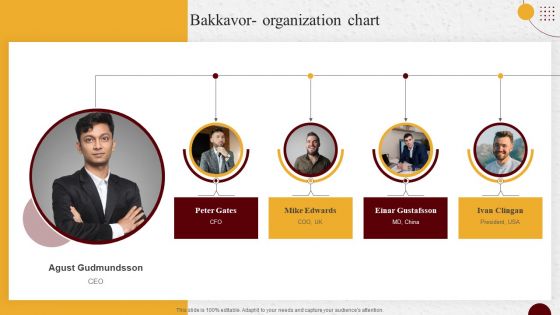
Industry Report Of Packaged Food Products Part 2 Bakkavor Organization Chart Summary PDF
Do you have to make sure that everyone on your team knows about any specific topic I yes, then you should give Industry Report Of Packaged Food Products Part 2 Bakkavor Organization Chart Summary PDF a try. Our experts have put a lot of knowledge and effort into creating this impeccable Industry Report Of Packaged Food Products Part 2 Bakkavor Organization Chart Summary PDF. You can use this template for your upcoming presentations, as the slides are perfect to represent even the tiniest detail. You can download these templates from the Slidegeeks website and these are easy to edit. So grab these today.
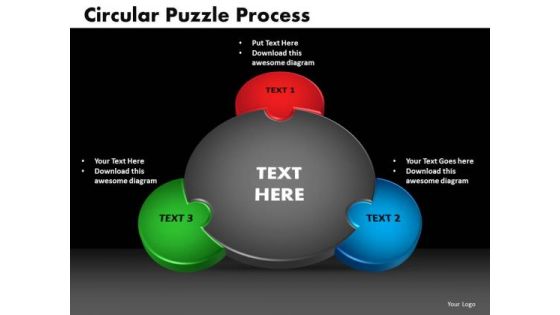
PowerPoint Design Circular Puzzle Process Ppt Presentation
PowerPoint Design Circular Puzzle Process PPT Presentation- Puzzles or jigsaw diagram is just the tool for explaining mess; You can also use this diagram also for explaining the solution of more general problems. -PowerPoint Design Circular Puzzle Process PPT Presentation-Cycle, Design, Diagram, Element, Graph, Business, Chart, Circular, Connect, Connection, Puzzle, Round, Solving, Step, Together, Putting, Mystery, Linking, Infographic, Icon, Make remarkable presentations with our PowerPoint Design Circular Puzzle Process Ppt Presentation. You'll always stay ahead of the game.
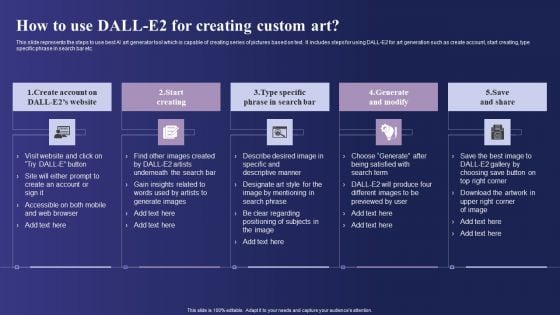
Guide To Use Chatgpt Prompts For AI Art Generation How To Use Dall E2 For Creating Custom Art Themes PDF
This slide represents the steps to use best AI art generator tool which is capable of creating series of pictures based on text. It includes steps for using DALL E2 for art generation such as create account, start creating, type specific phrase in search bar etc. Boost your pitch with our creative Guide To Use Chatgpt Prompts For AI Art Generation How To Use Dall E2 For Creating Custom Art Themes PDF. Deliver an awe-inspiring pitch that will mesmerize everyone. Using these presentation templates you will surely catch everyones attention. You can browse the ppts collection on our website. We have researchers who are experts at creating the right content for the templates. So you do not have to invest time in any additional work. Just grab the template now and use them.
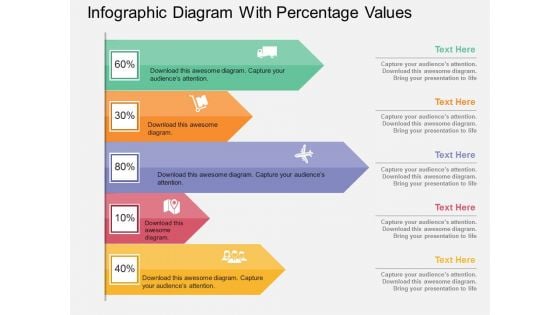
Infographic Diagram With Percentage Values Powerpoint Template
Visually support your presentation with our above template containing infographic diagram with percentage values. This diagram is excellent visual tools for explaining huge amounts of information where complex data needs to be explained immediately and clearly.
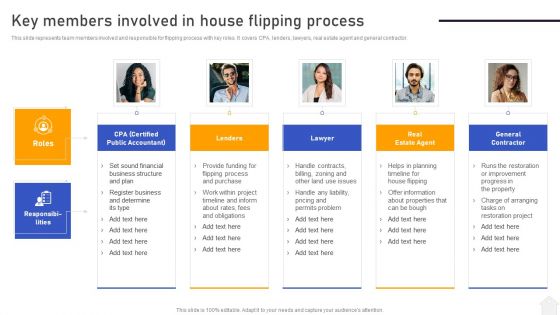
Strategies For Flipping Houses For Maximum Revenue Key Members Involved In House Flipping Process Themes PDF
This slide represents team members involved and responsible for flipping process with key roles. It covers CPA, lenders, lawyers, real estate agent and general contractor. Are you searching for a Strategies For Flipping Houses For Maximum Revenue Key Members Involved In House Flipping Process Themes PDF that is uncluttered, straightforward, and original Its easy to edit, and you can change the colors to suit your personal or business branding. For a presentation that expresses how much effort you have put in, this template is ideal. With all of its features, including tables, diagrams, statistics, and lists, its perfect for a business plan presentation. Make your ideas more appealing with these professional slides. Download Strategies For Flipping Houses For Maximum Revenue Key Members Involved In House Flipping Process Themes PDF from Slidegeeks today.
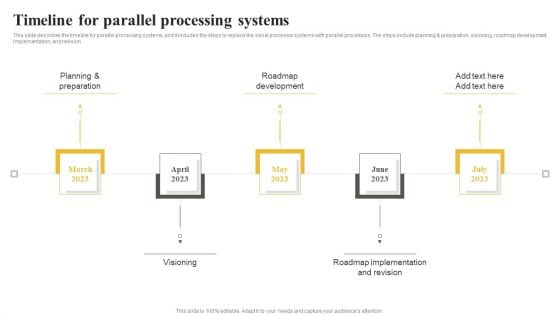
Parallel Computing System To Enhance Process Efficiency Timeline For Parallel Processing Systems Diagrams PDF
This slide describes the timeline for parallel processing systems, and it includes the steps to replace the serial processor systems with parallel processors. The steps include planning preparation, visioning, roadmap development, implementation, and revision.The best PPT templates are a great way to save time, energy, and resources. Slidegeeks have 100 precent editable powerpoint slides making them incredibly versatile. With these quality presentation templates, you can create a captivating and memorable presentation by combining visually appealing slides and effectively communicating your message. Download Parallel Computing System To Enhance Process Efficiency Timeline For Parallel Processing Systems Diagrams PDF from Slidegeeks and deliver a wonderful presentation.
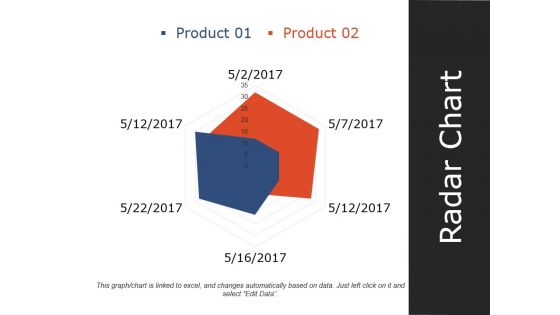
Radar Chart Ppt PowerPoint Presentation Infographics Slideshow
This is a radar chart ppt powerpoint presentation infographics slideshow. This is a two stage process. The stages in this process are product, radar chart, shape, management, marketing.
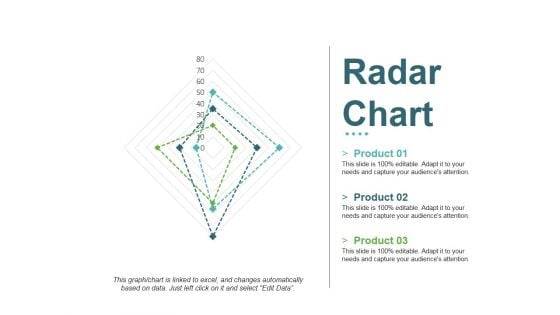
Radar Chart Ppt PowerPoint Presentation Infographics Ideas
This is a radar chart ppt powerpoint presentation infographics ideas. This is a three stage process. The stages in this process are product, business, shapes, marketing, radar chart.
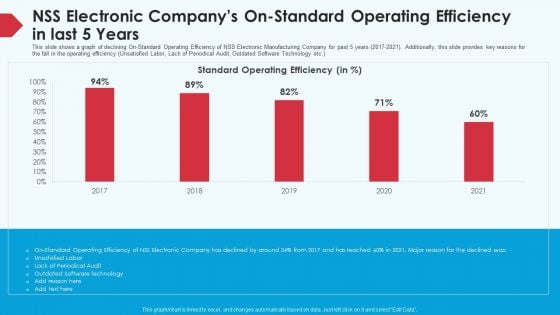
Skill Shortage In A Production Firm Case Study Solution NSS Electronic Companys On Standard Operating Efficiency In Last 5 Years Background PDF
This slide shows a graph of declining On-Standard Operating Efficiency of NSS Electronic Manufacturing Company for past 5 years 2017-2021. Additionally, this slide provides key reasons for the fall in the operating efficiency Unsatisfied Labor, Lack of Periodical Audit, Outdated Software Technology etc. Deliver an awe inspiring pitch with this creative skill shortage in a production firm case study solution NSS electronic companys on standard operating efficiency in last 5 years background pdf bundle. Topics like NSS electronic companys on standard operating efficiency in last 5 years can be discussed with this completely editable template. It is available for immediate download depending on the needs and requirements of the user.
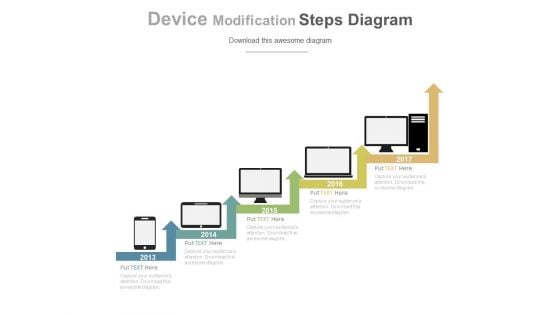
Comparison Between Varying Hardware Technologies Powerpoint Slides
This PPT slide displays graphics of computers diagram with growth steps. Use this PPT design to display varying hardware technologies. This PowerPoint template can be customized as per requirements of business education or any other theme.
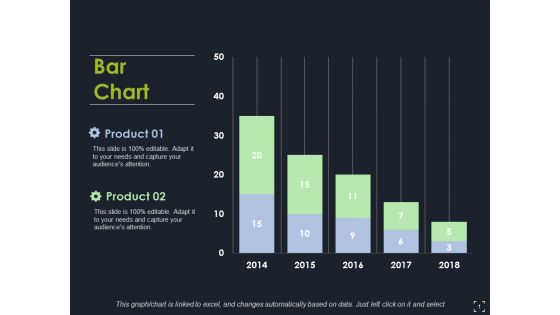
Bar Chart Ppt PowerPoint Presentation Model Clipart Images
This is a bar chart ppt powerpoint presentation model clipart images. This is a two stage process. The stages in this process are bar chart, finance, marketing, strategy, analysis.
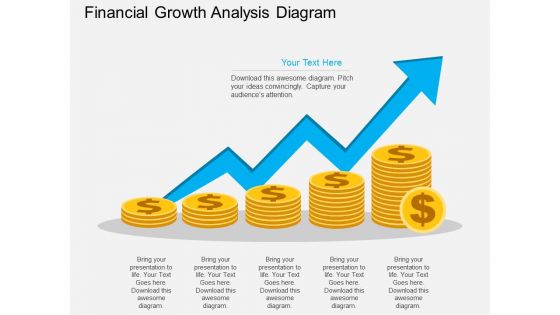
Financial Growth Analysis Diagram Powerpoint Template
Develop competitive advantage with our above template which contains coins stacks with blue arrow. This diagram may be used to exhibit financial growth analysis. You can edit text, color, shade and style as per you need.
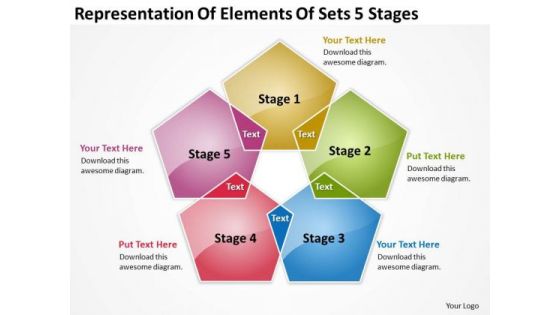
Representation Of Elements Sets 5 Stages Business Plan Example PowerPoint Templates
We present our representation of elements sets 5 stages business plan example PowerPoint templates.Download and present our Business PowerPoint Templates because You will get more than you ever bargained for. Download and present our Shapes PowerPoint Templates because You can Hit the nail on the head with our PowerPoint Templates and Slides. Embed your ideas in the minds of your audience. Use our Signs PowerPoint Templates because You can Connect the dots. Fan expectations as the whole picture emerges. Download our Success PowerPoint Templates because You should Bet on your luck with our PowerPoint Templates and Slides. Be assured that you will hit the jackpot. Use our Metaphors-Visual Concepts PowerPoint Templates because Our PowerPoint Templates and Slides are conceived by a dedicated team. Use them and give form to your wondrous ideas.Use these PowerPoint slides for presentations relating to box, text, dialog, chat, website, isolated, speech, item, rectangle, green, special, strip, red, business, vector, sign, symbol, template, scrapbook, clean, card, shape, label, icon, www, story, sale, frame, collection, web, free, empty, paper, set, memories, banner, store, style, sticker, advertising, space, note, message, promotion, bubble, happy, communicate, communication. The prominent colors used in the PowerPoint template are Red, Blue, Green. Decrease wastage with our Representation Of Elements Sets 5 Stages Business Plan Example PowerPoint Templates. Download without worries with our money back guaranteee.
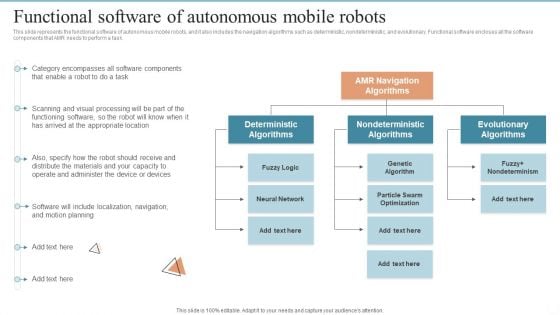
AMR Robot Functional Software Of Autonomous Mobile Robots Ppt PowerPoint Presentation Diagram Lists PDF
This slide represents the functional software of autonomous mobile robots, and it also includes the navigation algorithms such as deterministic, nondeterministic, and evolutionary. Functional software encloses all the software components that AMR needs to perform a task. Here you can discover an assortment of the finest PowerPoint and Google Slides templates. With these templates, you can create presentations for a variety of purposes while simultaneously providing your audience with an eye catching visual experience. Download AMR Robot Functional Software Of Autonomous Mobile Robots Ppt PowerPoint Presentation Diagram Lists PDF to deliver an impeccable presentation. These templates will make your job of preparing presentations much quicker, yet still, maintain a high level of quality. Slidegeeks has experienced researchers who prepare these templates and write high quality content for you. Later on, you can personalize the content by editing the AMR Robot Functional Software Of Autonomous Mobile Robots Ppt PowerPoint Presentation Diagram Lists PDF.
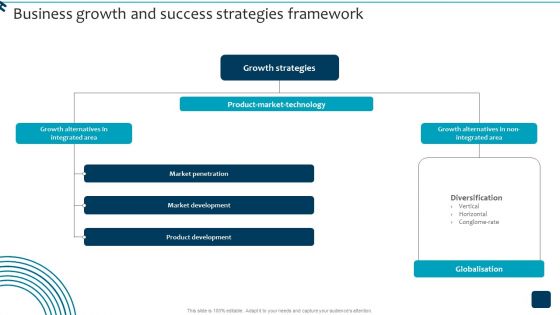
Strategic Brand Growth Plan For Market Leadership Business Growth And Success Strategies Diagrams PDF
Take your projects to the next level with our ultimate collection of Strategic Brand Growth Plan For Market Leadership Business Growth And Success Strategies Diagrams PDF. Slidegeeks has designed a range of layouts that are perfect for representing task or activity duration, keeping track of all your deadlines at a glance. Tailor these designs to your exact needs and give them a truly corporate look with your own brand colors they will make your projects stand out from the rest.
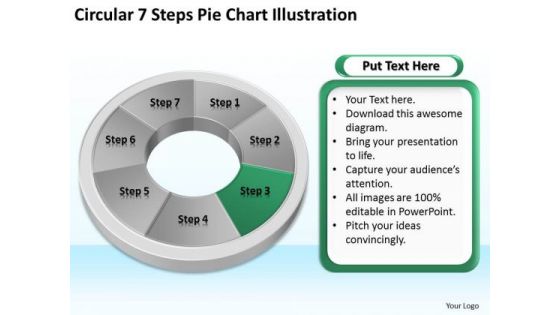
Circular 7 Steps Pie Chart Illustration How Do Make Business Plan PowerPoint Templates
We present our circular 7 steps pie chart illustration how do make business plan PowerPoint templates.Present our Circle Charts PowerPoint Templates because Our PowerPoint Templates and Slides has conjured up a web of all you need with the help of our great team. Use them to string together your glistening ideas. Download and present our Ring Charts PowerPoint Templates because You can Create a matrix with our PowerPoint Templates and Slides. Feel the strength of your ideas click into place. Use our Shapes PowerPoint Templates because Our PowerPoint Templates and Slides are Clear and concise. Use them and dispel any doubts your team may have. Download and present our Business PowerPoint Templates because It will get your audience in sync. Use our Signs PowerPoint Templates because You can Be the star of the show with our PowerPoint Templates and Slides. Rock the stage with your ideas.Use these PowerPoint slides for presentations relating to teps, flow, chart, diagram, process, graph, wheel, pie, stages, segments, green, corporate, red, business, blank, arrow, yellow, curving, copyspace, slices, graphic, directional, shape, modern, cycle, illustration, circular, round, clipart, seven, colorful, clip, blue, infographic, art, work, puzzle, clockwise, financial. The prominent colors used in the PowerPoint template are Green, Gray, Black. Your assessment will be the deciding factor. Help the audience figure it out with our Circular 7 Steps Pie Chart Illustration How Do Make Business Plan PowerPoint Templates.
Business People With Progressive Arrows And Icons Powerpoint Template
Use this PowerPoint template, in your corporate presentations. This PPT slide contains graphic of business people with progressive arrows and icons. This slide is 100 percent editable. Make wonderful presentations using this diagram.
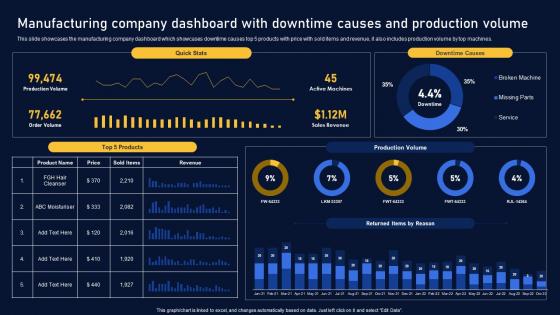
Manufacturing Company Dashboard Multinational Organization Customer Goods Diagrams Pdf
This slide showcases the manufacturing company dashboard which showcases downtime causes top 5 products with price with sold items and revenue, it also includes production volume by top machines. This modern and well arranged Manufacturing Company Dashboard Multinational Organization Customer Goods Diagrams Pdf provides lots of creative possibilities. It is very simple to customize and edit with the Powerpoint Software. Just drag and drop your pictures into the shapes. All facets of this template can be edited with Powerpoint, no extra software is necessary. Add your own material, put your images in the places assigned for them, adjust the colors, and then you can show your slides to the world, with an animated slide included. This slide showcases the manufacturing company dashboard which showcases downtime causes top 5 products with price with sold items and revenue, it also includes production volume by top machines.
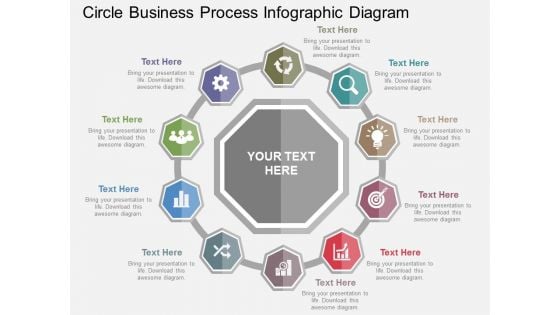
Circle Business Process Infographic Diagram Powerpoint Templates
This business diagram has been designed with diagram of circular infographic. Download this slide to portray concept of management strategy for success. This diagram can be used for global business and communication related topics.
Colorful Circles With Icons Powerpoint Templates
Circular infographic has been displayed in this business slide. This business diagram helps to exhibit process of strategic planning. Use this diagram to build an exclusive presentation.
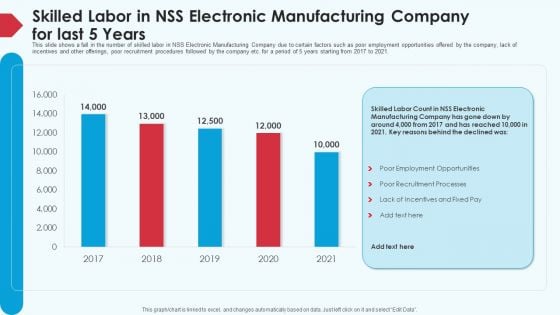
Skill Shortage In A Production Firm Case Study Solution Skilled Labor In NSS Electronic Manufacturing Company For Last 5 Years Graphics PDF
This slide shows a fall in the number of skilled labor in NSS Electronic Manufacturing Company due to certain factors such as poor employment opportunities offered by the company, lack of incentives and other offerings, poor recruitment procedures followed by the company etc. for a period of 5 years starting from 2017 to 2021. Deliver an awe inspiring pitch with this creative skill shortage in a production firm case study solution skilled labor in NSS electronic manufacturing company for last 5 years graphics pdf bundle. Topics like skilled labor in NSS electronic manufacturing company for last 5 years, 2017 to 2021 can be discussed with this completely editable template. It is available for immediate download depending on the needs and requirements of the user.
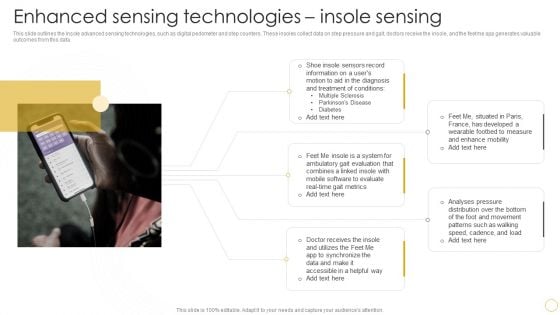
Digital Resilience Biomarker Technologies IT Enhanced Sensing Technologies Insole Sensing Diagrams PDF
This slide outlines the insole advanced sensing technologies, such as digital pedometer and step counters. These insoles collect data on step pressure and gait, doctors receive the insole, and the feetme app generates valuable outcomes from this data. Find highly impressive Digital Resilience Biomarker Technologies IT Enhanced Sensing Technologies Insole Sensing Diagrams PDF on Slidegeeks to deliver a meaningful presentation. You can save an ample amount of time using these presentation templates. No need to worry to prepare everything from scratch because Slidegeeks experts have already done a huge research and work for you. You need to download Digital Resilience Biomarker Technologies IT Enhanced Sensing Technologies Insole Sensing Diagrams PDF for your upcoming presentation. All the presentation templates are 100 percent editable and you can change the color and personalize the content accordingly. Download now.
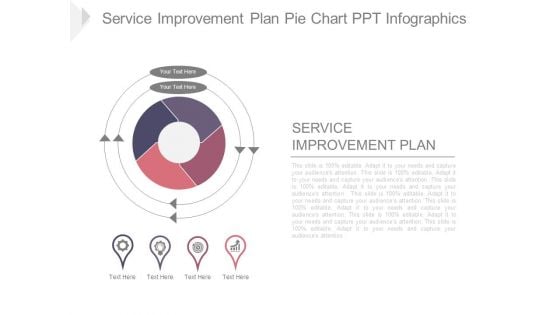
Service Improvement Plan Pie Chart Ppt Infographics
This is a service improvement plan pie chart ppt infographics. This is a four stage process. The stages in this process are service improvement plan, business, strategy, marketing, management.
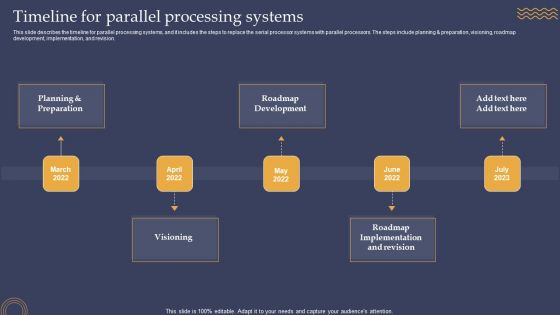
Timeline For Parallel Processing Systems Ppt PowerPoint Presentation File Diagrams PDF
This slide describes the timeline for parallel processing systems, and it includes the steps to replace the serial processor systems with parallel processors. The steps include planning and preparation, visioning, roadmap development, implementation, and revision. Slidegeeks is here to make your presentations a breeze with Timeline For Parallel Processing Systems Ppt PowerPoint Presentation File Diagrams PDF With our easy to use and customizable templates, you can focus on delivering your ideas rather than worrying about formatting. With a variety of designs to choose from, you are sure to find one that suits your needs. And with animations and unique photos, illustrations, and fonts, you can make your presentation pop. So whether you are giving a sales pitch or presenting to the board, make sure to check out Slidegeeks first.
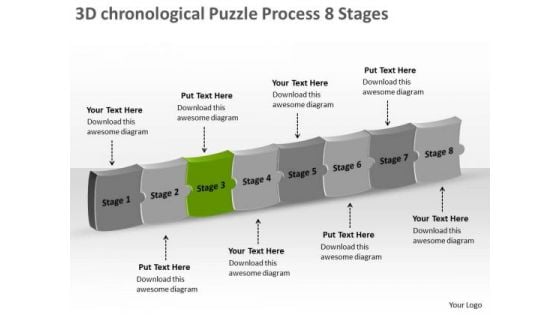
3d Chronological Puzzle Process 8 Stages Ppt Make Flow Chart PowerPoint Templates
We present our 3d chronological puzzle process 8 stages ppt make flow chart PowerPoint templates. Use our Advertising PowerPoint Templates because, the lessons have been analyzed, studied and conclusions drawn. Use our Business PowerPoint Templates because; Use our template to illustrate what you say. Use our Puzzles or Jigsaws PowerPoint Templates because, the color coding of our templates are specifically designed to highlight you points. Use our Shapes PowerPoint Templates because, Start with the fundamental basic activities and slowly but surely hone them down to the top of the pyramid, the ultimate goal. Use our Process and Flows PowerPoint Templates because, Now you have to coordinate and motivate your team. Use these PowerPoint slides for presentations relating to Abstract, action, attach, box, business, center, chain, chart, communication, concept, connection, cube, cycle, data, diagram, flow, globe, horizontal, idea, illustration, individual, information, interaction, jigsaw, join, link, merge, missing, opportunity, part, people, piece, pieces, process, puzzle, relation, relationship, search, shape, silhouette, success. The prominent colors used in the PowerPoint template are Green, White, and Gray Ambiguity can be exasperating. Give definite answers with our 3d Chronological Puzzle Process 8 Stages Ppt Make Flow Chart PowerPoint Templates.
Icon Tags For Strategic Planning Powerpoint Templates
Download this exclusive business diagram to present marketing research and strategic planning. This PowerPoint template contains graphics of text tags with icons. This diagram can be useful for business presentations.
KPI Dashboards Per Industry Retail Store Dashboard Ppt PowerPoint Presentation Icon Grid PDF
Deliver an awe-inspiring pitch with this creative kpi dashboards per industry retail store dashboard ppt powerpoint presentation icon grid pdf bundle. Topics like total customers and visitors, avg price and units per transaction, out stock items, sales city, top 5 articles by sold items, top 5 articles revenue can be discussed with this completely editable template. It is available for immediate download depending on the needs and requirements of the user.
Digital Products Company Outline Organisation Structure Icons PDF
The slide company hierarchy in software company which depicts chief executive officer, chief technology officer, chief financial officer, legal team, head of operations, audit team, customer support head and head of sales and marketing. This modern and well arranged Digital Products Company Outline Organisation Structure Icons PDF provides lots of creative possibilities. It is very simple to customize and edit with the Powerpoint Software. Just drag and drop your pictures into the shapes. All facets of this template can be edited with Powerpoint no extra software is necessary. Add your own material, put your images in the places assigned for them, adjust the colors, and then you can show your slides to the world, with an animated slide included.
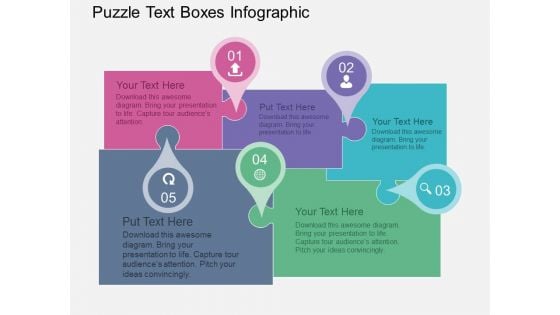
Puzzle Text Boxes Infographic Powerpoint Templates
Puzzle infographic has been used to design this power point template. This business diagram helps to depict concepts of marketing solution and strategy. Use this diagram to build unique presentation for your viewers.
Service Strategy And Service Lifecycle Implementation Table Of Contents Ppt Icon Images PDF
Presenting this set of slides with name service strategy and service lifecycle implementation table of contents ppt icon images pdf. This is a one stage process. The stages in this process are greater service value, greater market share, improve upon 5 dimensions service quality, 3 ways increase service value, sources of competitive advantage, 3 strategic options services, 4 steps create perfect, service development plans, sample strategies, service strategy initiatives and deadline, service strategy key metrics and goals. This is a completely editable PowerPoint presentation and is available for immediate download. Download now and impress your audience.
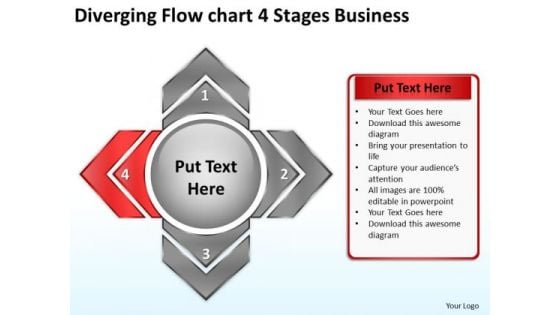
4 Stages World Business PowerPoint Templates Circular Arrow Diagram
We present our 4 stages world business powerpoint templates Circular Arrow Diagram.Present our Shapes PowerPoint Templates because you can Educate your listeners on the means to keep it ticking over. Download our Ring Charts PowerPoint Templates because our template will illustrate what you want to say. Download and present our Business PowerPoint Templates because you have had your share of being a goldfish in a small bowl.you are ready to launch out and spread your wings. Download our Marketing PowerPoint Templates because networking is an imperative in todays world. You need to access the views of others. Similarly you need to give access to them of your abilities. Use our Process and Flows PowerPoint Templates because this diagram provides range of options to garner your interest.Use these PowerPoint slides for presentations relating to Arrow, art, blank, blue, business, chart,circular, clip, clipart, clockwise, colorful,copyspace, corporate, curving, cycle,diagram, directional, financial, flow,graph, graphic, green, illustration,infographic, modern, pie, process, red,round, segments, seven, shape, slices,stages, steps. The prominent colors used in the PowerPoint template are Red, Black, Gray. You can be sure our 4 stages world business powerpoint templates Circular Arrow Diagram are specially created by a professional team with vast experience. They diligently strive to come up with the right vehicle for your brilliant Ideas. Professionals tell us our clipart PowerPoint templates and PPT Slides are Elevated. PowerPoint presentation experts tell us our 4 stages world business powerpoint templates Circular Arrow Diagram are Nostalgic. You can be sure our circular PowerPoint templates and PPT Slides will make the presenter look like a pro even if they are not computer savvy. You can be sure our 4 stages world business powerpoint templates Circular Arrow Diagram are second to none. The feedback we get is that our chart PowerPoint templates and PPT Slides are Fun. File it down with our 4 Stages World Business PowerPoint Templates Circular Arrow Diagram. Get your thoughts into the shape you desire.
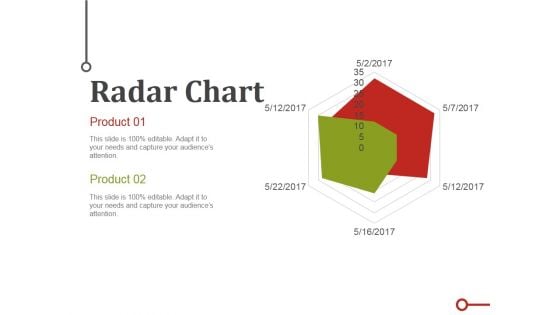
Radar Chart Ppt PowerPoint Presentation Infographics Templates
This is a radar chart ppt powerpoint presentation infographics templates. This is a two stage process. The stages in this process are business, marketing, charts, radar, scatter.
Drone Technology For Connectivity During Crowded Events Icons Pdf
This slide showcases the 5g drone for connectivity during crowded events which helps an organization to introduce real time artificial intelligence integration. It include details such as deterioration of network services, decrease in no. of calls, etc. Pitch your topic with ease and precision using this Drone Technology For Connectivity During Crowded Events Icons Pdf This layout presents information on Impacts Of Crowded Events, Potential Solution It is also available for immediate download and adjustment. So, changes can be made in the color, design, graphics or any other component to create a unique layout. This slide showcases the 5g drone for connectivity during crowded events which helps an organization to introduce real time artificial intelligence integration. It include details such as deterioration of network services, decrease in no. of calls, etc.
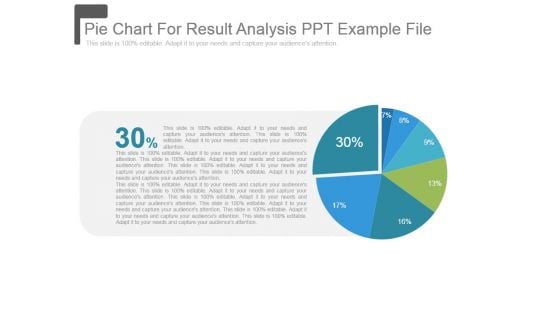
Pie Chart For Result Analysis Ppt Example File
This is a pie chart for result analysis ppt example file. This is a seven stage process. The stages in this process are pie, marketing, strategy, finance, percentage.
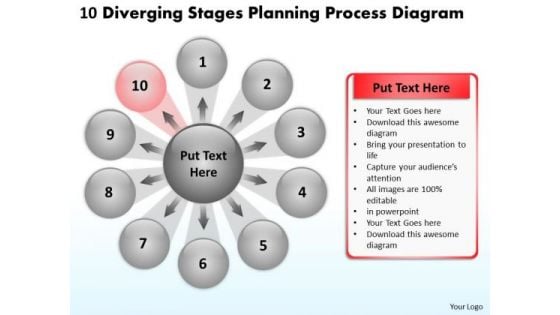
10 Diverging Stages Planning Process Diagram Circular PowerPoint Slides
We present our 10 diverging stages planning process diagram Circular PowerPoint Slides.Download and present our Arrows PowerPoint Templates because it have all to represent to your viewers. Download our Business PowerPoint Templates because this template can project the path to sucess that you have charted. Use our Shapes PowerPoint Templates because with the help of our Slides you can Illustrate your plans to your listeners with the same accuracy. Present our Process and Flows PowerPoint Templates because the vision of being the market leader is clear to you. Use our Flow charts PowerPoint Templates because with the help of our Slides you can Illustrate the means to prevent or control them using our imaginative templates.Use these PowerPoint slides for presentations relating to Arrow, blue, business, chart, circle, concept, control, cycle, dark, design, development, diagram, evaluate, flow, flow-chart, flowchart, fresh, graphic, green, idea, infographic, iterative, life, lifecycle, lifecycle, management, method, model, process, purple, quality, rainbow, research, retro, schema, spiral, step, strategy, success. The prominent colors used in the PowerPoint template are Green lime, Gray, Black. You can be sure our 10 diverging stages planning process diagram Circular PowerPoint Slides are Fun. Presenters tell us our concept PowerPoint templates and PPT Slides are designed by a team of presentation professionals. We assure you our 10 diverging stages planning process diagram Circular PowerPoint Slides are Striking. Customers tell us our cycle PowerPoint templates and PPT Slides are Bold. Presenters tell us our 10 diverging stages planning process diagram Circular PowerPoint Slides are Functional. You can be sure our control PowerPoint templates and PPT Slides are Ritzy. Give your audience a feel of your ability. Dole out a dose on our 10 Diverging Stages Planning Process Diagram Circular PowerPoint Slides.
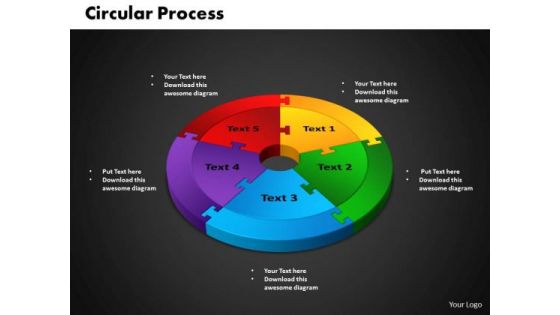
PowerPoint Presentation Circular Process Business Ppt Slides
PowerPoint Presentation Circular Process Business PPT Slides-This Diagram shows interrelated concepts in a circular flow . An excellent graphic to attract the attention of and understanding by your audience -PowerPoint Presentation Circular Process Business PPT Slides-Cycle, Design, Diagram, Element, Graph, Business, Chart, Circular, Connect, Connection, Puzzle, Round, Solving, Step, Together, Putting, Mystery, Linking, Infographic, Icon, Experience craftsmanship with our PowerPoint Presentation Circular Process Business Ppt Slides. They are designed by excellent artisans.
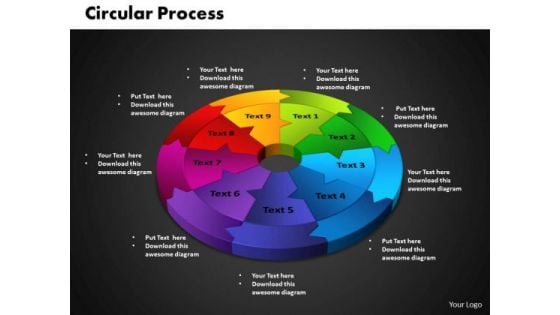
PowerPoint Presentation Circular Process Growth Ppt Designs
PowerPoint Presentation Circular Process Growth PPT Designs-This Diagram shows interrelated concepts in a circular flow . An excellent graphic to attract the attention of and understanding by your audience -PowerPoint Presentation Circular Process Growth PPT Designs-Cycle, Design, Diagram, Element, Graph, Business, Chart, Circular, Connect, Connection, Puzzle, Round, Solving, Step, Together, Putting, Mystery, Linking, Infographic, Icon, Attain victory with our PowerPoint Presentation Circular Process Growth Ppt Designs. You will come out on top.
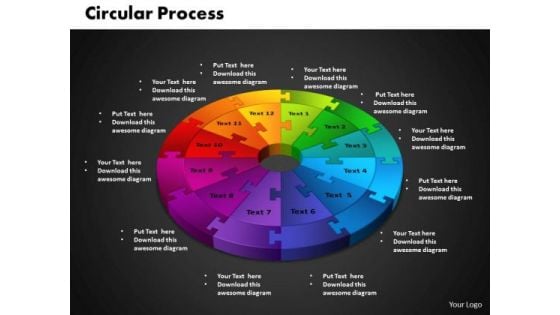
PowerPoint Presentation Circular Process Marketing Ppt Design
PowerPoint Presentation Circular Process Marketing PPT Design-This Diagram shows interrelated concepts in a circular flow . An excellent graphic to attract the attention of and understanding by your audience -PowerPoint Presentation Circular Process Marketing PPT Design-Cycle, Design, Diagram, Element, Graph, Business, Chart, Circular, Connect, Connection, Puzzle, Round, Solving, Step, Together, Putting, Mystery, Linking, Infographic, Icon, Put your estimates on the line. Our PowerPoint Presentation Circular Process Marketing Ppt Design will establish their accuracy.
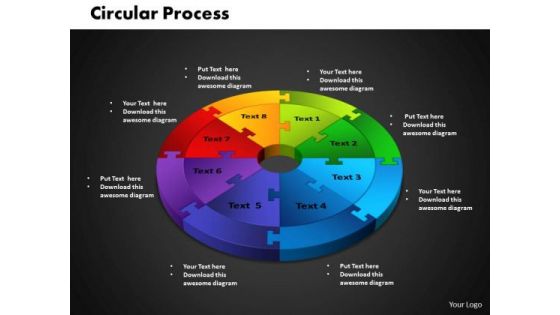
PowerPoint Template Circular Business Ppt Design
PowerPoint Template Circular Business PPT Design-This Diagram shows interrelated concepts in a circular flow . An excellent graphic to attract the attention of and understanding by your audience-PowerPoint Template Circular Business PPT Design-Cycle, Design, Diagram, Element, Graph, Business, Chart, Circular, Connect, Connection, Puzzle, Round, Solving, Step, Together, Putting, Mystery, Linking, Infographic, Icon, Display entrepreneurial leadership with our PowerPoint Template Circular Business Ppt Design. They will make you look good.
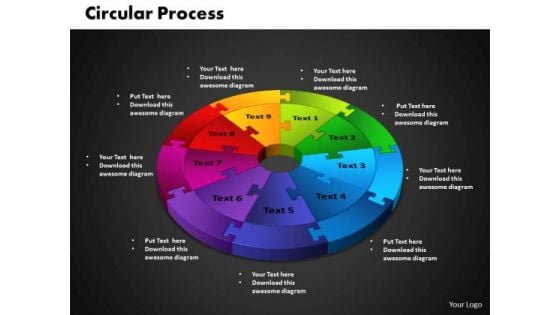
PowerPoint Template Circular Process Business Ppt Slides
PowerPoint Template Circular Process Business PPT Slides-This Diagram shows interrelated concepts in a circular flow . An excellent graphic to attract the attention of and understanding by your audience-PowerPoint Template Circular Process Business PPT Slides-Cycle, Design, Diagram, Element, Graph, Business, Chart, Circular, Connect, Connection, Puzzle, Round, Solving, Step, Together, Putting, Mystery, Linking, Infographic, Icon, Assist them in making the right choice. Open up all the cards with our PowerPoint Template Circular Process Business Ppt Slides.
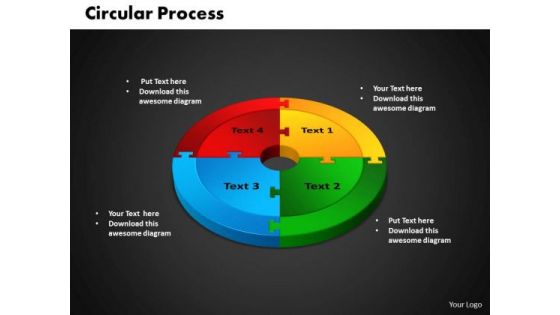
PowerPoint Template Circular Strategy Ppt Designs
PowerPoint Template Circular Strategy PPT Designs-This Diagram shows interrelated concepts in a circular flow . An excellent graphic to attract the attention of and understanding by your audience-PowerPoint Template Circular Strategy PPT Designs-Cycle, Design, Diagram, Element, Graph, Business, Chart, Circular, Connect, Connection, Puzzle, Round, Solving, Step, Together, Putting, Mystery, Linking, Infographic, Icon, Our PowerPoint Template Circular Strategy Ppt Designs are fashioned for your thoughts. Your ideas will create a new fad.
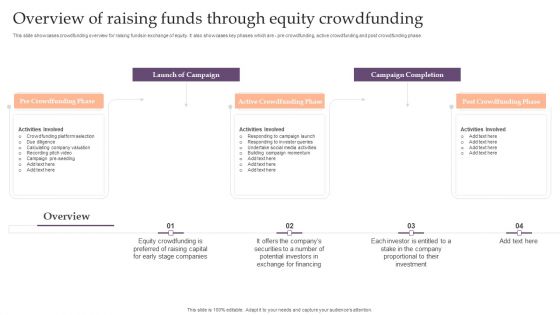
Assessing Debt And Equity Fundraising Alternatives For Business Growth Overview Of Raising Funds Through Diagrams PDF
This slide showcases initial public offering overview for raising funds in exchange of equity. It also showcases steps to raise funds which are appoint investment bank, submit regulatory fillings, setting IPO price, using after market stabilization tools, transition to market competition. The best PPT templates are a great way to save time, energy, and resources. Slidegeeks have 100 percent editable powerpoint slides making them incredibly versatile. With these quality presentation templates, you can create a captivating and memorable presentation by combining visually appealing slides and effectively communicating your message. DownloadAssessing Debt And Equity Fundraising Alternatives For Business Growth Overview Of Raising Funds Through Diagrams PDF from Slidegeeks and deliver a wonderful presentation.
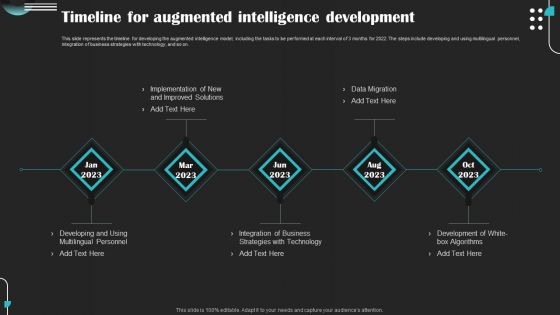
Intelligence Amplification IA IT Timeline For Augmented Intelligence Development Diagrams PDF
This slide represents the timeline for developing the augmented intelligence model, including the tasks to be performed at each interval of 3 months for 2022. The steps include developing and using multilingual personnel, integration of business strategies with technology, and so on. If your project calls for a presentation, then Slidegeeks is your go-to partner because we have professionally designed, easy-to-edit templates that are perfect for any presentation. After downloading, you can easily edit Intelligence Amplification IA IT Timeline For Augmented Intelligence Development Diagrams PDF and make the changes accordingly. You can rearrange slides or fill them with different images. Check out all the handy templates
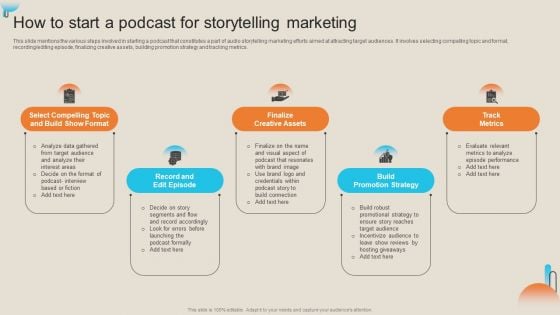
Comprehensive Guide For Storytelling Promotion How To Start A Podcast For Storytelling Marketing Diagrams PDF
This slide mentions the various steps involved in starting a podcast that constitutes a part of audio storytelling marketing efforts aimed at attracting target audiences. It involves selecting compelling topic and format, recording editing episode, finalizing creative assets, building promotion strategy and tracking metrics. Make sure to capture your audiences attention in your business displays with our gratis customizable Comprehensive Guide For Storytelling Promotion How To Start A Podcast For Storytelling Marketing Diagrams PDF. These are great for business strategies, office conferences, capital raising or task suggestions. If you desire to acquire more customers for your tech business and ensure they stay satisfied, create your own sales presentation with these plain slides.
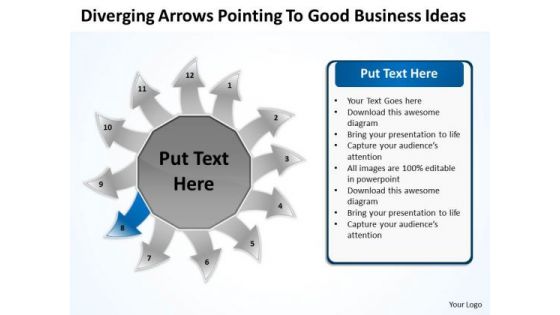
PowerPoint Presentation Ideas Ppt Relative Circular Flow Arrow Diagram Templates
We present our powerpoint presentation ideas ppt Relative Circular Flow Arrow Diagram templates.Use our Communication PowerPoint Templates because there are so many different pieces to the puzzle. Use our Arrows PowerPoint Templates because they enhance the essence of your viable ideas. Use our Circle Charts PowerPoint Templates because they are Gauranteed to focus the minds of your team. Use our Business PowerPoint Templates because your product has established a foothold in the market. Customers are happy with the value it brings to their lives. Present our Shapes PowerPoint Templates because you can Transmit your passion via our creative templates.Use these PowerPoint slides for presentations relating to Arrow, Bio, Business, Chart, Circle, Concept, Control, Cycle, Design, Development, Diagram, Eco, Ecology, Environmental, Evaluate, Flow, Flowchart, Fresh, Graphic, Green, Idea, Infographic, Iterative, Life, Lifecycle, Management, Method, Model, Natural, Nature, Organic, Process, Quality, Recycle, Research, Schema, Spiral, Step, Strategy, Success, System. The prominent colors used in the PowerPoint template are Blue, Gray, Black. Customers tell us our powerpoint presentation ideas ppt Relative Circular Flow Arrow Diagram templates provide great value for your money. Be assured of finding the best projection to highlight your words. Customers tell us our Chart PowerPoint templates and PPT Slides are Fabulous. Presenters tell us our powerpoint presentation ideas ppt Relative Circular Flow Arrow Diagram templates are Glamorous. PowerPoint presentation experts tell us our Cycle PowerPoint templates and PPT Slides are Great. Customers tell us our powerpoint presentation ideas ppt Relative Circular Flow Arrow Diagram templates are Stylish. Professionals tell us our Design PowerPoint templates and PPT Slides will get their audience's attention. Fashionable is what fashionable does. With our PowerPoint Presentation Ideas Ppt Relative Circular Flow Arrow Diagram Templates you will fit the bill.
Intelligent Manufacturing How Does 3D Printing Work Icons PDF
This slide represents the working of a 3D printer to make a prototype. It includes three steps such as 3D modeling software, slicing the model, and the 3D printing process. The printing process steps include inserting the paper sheet, applying glue, and so on. This modern and well arranged Intelligent Manufacturing How Does 3D Printing Work Icons PDF provides lots of creative possibilities. It is very simple to customize and edit with the Powerpoint Software. Just drag and drop your pictures into the shapes. All facets of this template can be edited with Powerpoint no extra software is necessary. Add your own material, put your images in the places assigned for them, adjust the colors, and then you can show your slides to the world, with an animated slide included.
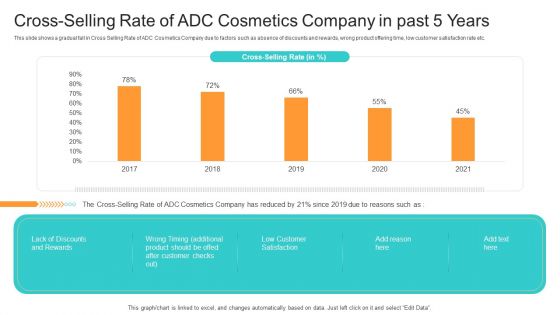
Utilization Of Current Techniques To Improve Efficiency Case Competition Cross Selling Rate Of ADC Cosmetics Company In Past 5 Years Information PDF
This slide shows a gradual fall in Cross Selling Rate of ADC Cosmetics Company due to factors such as absence of discounts and rewards, wrong product offering time, low customer satisfaction rate etc. Deliver and pitch your topic in the best possible manner with this utilization of current techniques to improve efficiency case competition cross selling rate of adc cosmetics company in past 5 years information pdf. Use them to share invaluable insights on lack of discounts and rewards, low customer satisfaction, wrong timing additional product should be offed after customer checks out and impress your audience. This template can be altered and modified as per your expectations. So, grab it now.
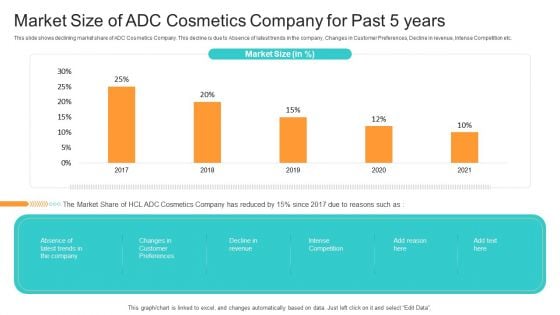
Utilization Of Current Techniques To Improve Efficiency Case Competition Market Size Of ADC Cosmetics Company For Past 5 Years Portrait PDF
This slide shows declining market share of ADC Cosmetics Company. This decline is due to Absence of latest trends in the company, Changes in Customer Preferences, Decline in revenue, Intense Competition etc. Deliver an awe inspiring pitch with this creative utilization of current techniques to improve efficiency case competition market size of adc cosmetics company for past 5 years portrait pdf bundle. Topics like absence of latest trends in the company, changes in customer preferences, decline in revenue can be discussed with this completely editable template. It is available for immediate download depending on the needs and requirements of the user.
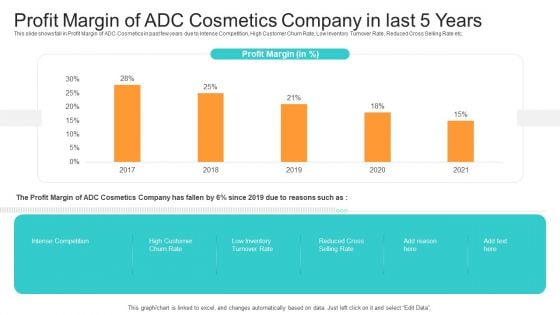
Utilization Of Current Techniques To Improve Efficiency Case Competition Profit Margin Of ADC Cosmetics Company In Last 5 Years Brochure PDF
This slide shows fall in Profit Margin of ADC Cosmetics in past few years due to Intense Competition, High Customer Churn Rate, Low Inventory Turnover Rate, Reduced Cross Selling Rate etc. Deliver and pitch your topic in the best possible manner with this utilization of current techniques to improve efficiency case competition profit margin of adc cosmetics company in last 5 years brochure pdf. Use them to share invaluable insights on intense competition, reduced cross selling rate, low inventory turnover rate and impress your audience. This template can be altered and modified as per your expectations. So, grab it now.
Arrows With Team Goal And Planning Icons Powerpoint Templates
This business diagram contains graphics of arrows with icons. You may use this diagram to display team goal planning. Communicate effectively with your group through this slide.
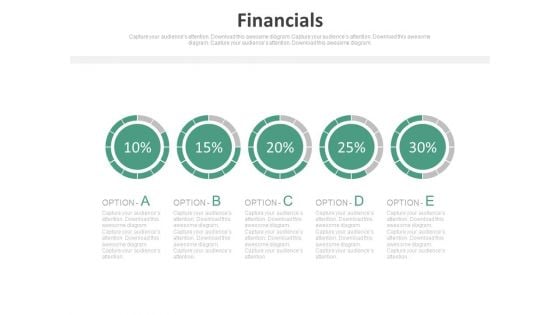
Pie Charts For Percentage Value Analysis Powerpoint Slides
Our above PPT slide displays graphics of Pie charts. This PowerPoint template may be used to display percentage value analysis. Download this template to leave permanent impression on your audience.


 Continue with Email

 Home
Home


