Fixed Income
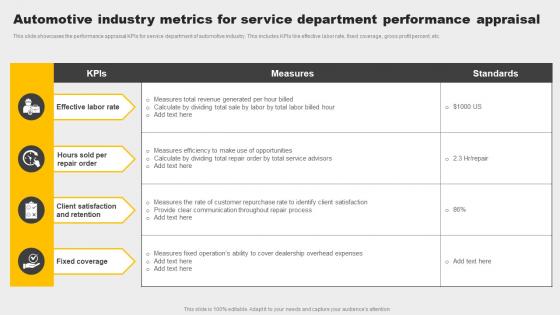
Automotive Industry Metrics For Service Department Performance Appraisal Brochure Pdf
This slide showcases the performance appraisal KPIs for service department of automotive industry. This includes KPIs like effective labor rate, fixed coverage, gross profit percent, etc. Pitch your topic with ease and precision using this Automotive Industry Metrics For Service Department Performance Appraisal Brochure Pdf. This layout presents information on Effective Labor Rate, Client Satisfaction And Retention, Fixed Coverage. It is also available for immediate download and adjustment. So, changes can be made in the color, design, graphics or any other component to create a unique layout. This slide showcases the performance appraisal KPIs for service department of automotive industry. This includes KPIs like effective labor rate, fixed coverage, gross profit percent, etc.
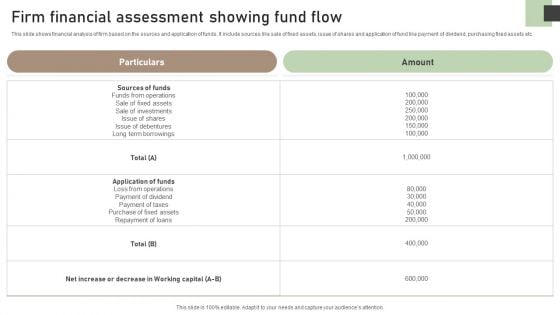
Firm Financial Assessment Showing Fund Flow Professional PDF
This slide shows financial analysis of firm based on the sources and application of funds. It include sources like sale of fixed assets, issue of shares and application of fund like payment of dividend, purchasing fixed assets etc. Showcasing this set of slides titled Firm Financial Assessment Showing Fund Flow Professional PDF. The topics addressed in these templates are Sources Funds, Funds Operations, Sale Fixed Assets. All the content presented in this PPT design is completely editable. Download it and make adjustments in color, background, font etc. as per your unique business setting.
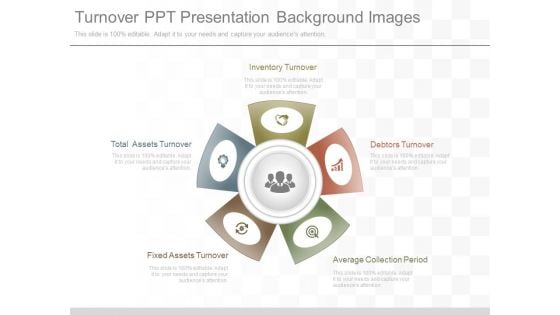
Turnover Ppt Presentation Background Images
This is a turnover ppt presentation background images. This is a five stage process. The stages in this process are inventory turnover, debtors turnover, average collection period, fixed assets turnover, total assets turnover.
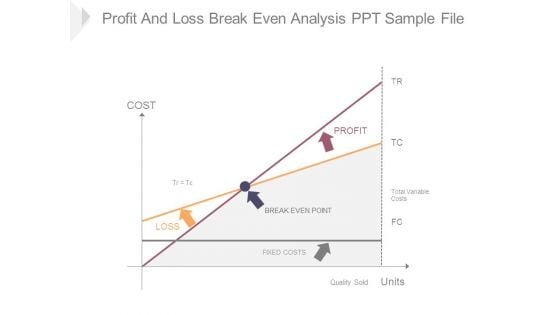
Profit And Loss Break Even Analysis Ppt Sample File
This is a profit and loss break even analysis ppt sample file. This is a two stage process. The stages in this process are cost, loss, profit, fixed costs, break even point, quantity sold, units, total variable costs.
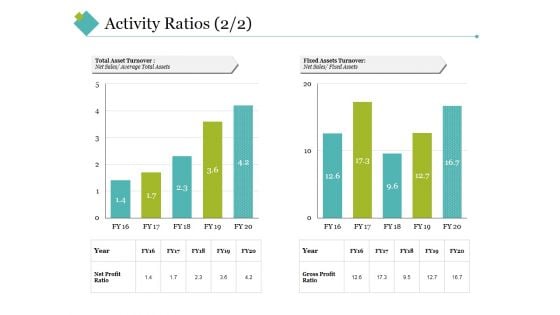
Activity Ratios Template 4 Ppt PowerPoint Presentation Styles Slideshow
This is a activity ratios template 4 ppt powerpoint presentation styles slideshow. This is a two stage process. The stages in this process are total asset turnover, fixed assets turnover, net sales, year, net profit ratio, gross profit ratio.
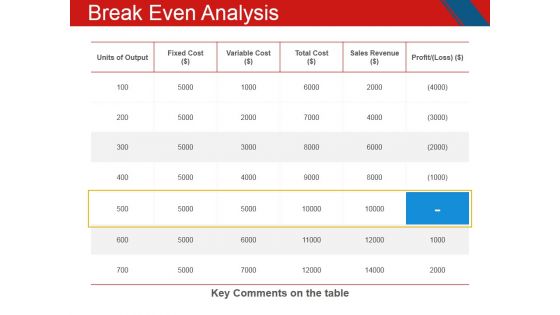
Break Even Analysis Ppt PowerPoint Presentation Inspiration Templates
This is a break even analysis ppt powerpoint presentation inspiration templates. This is a five stage process. The stages in this process are units of output, fixed cost, variable cost, total cost, sales revenue, profit.
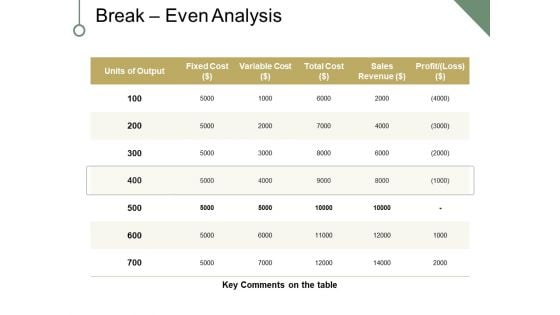
Break Even Analysis Ppt PowerPoint Presentation Portfolio Clipart
This is a break even analysis ppt powerpoint presentation portfolio clipart. This is a five stage process. The stages in this process are fixed cost, variable cost, sales revenue, profit, key comments on the table, units of output.
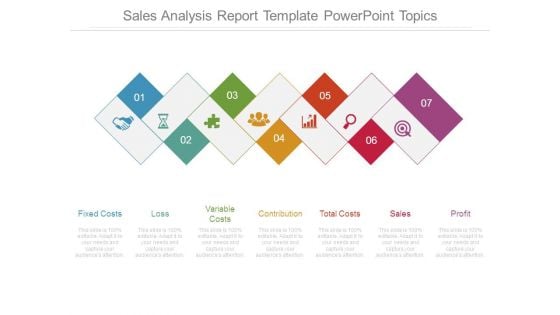
Sales Analysis Report Template Powerpoint Topics
This is a sales analysis report template powerpoint topics. This is a seven stage process. The stages in this process are fixed costs, loss, variable costs, contribution, total costs, sales, profit.
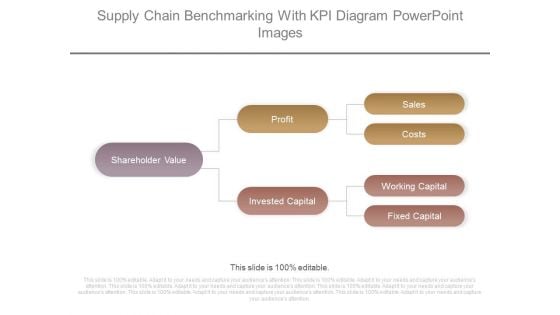
Supply Chain Benchmarking With Kpi Diagram Powerpoint Images
This is a supply chain benchmarking with kpi diagram powerpoint images. This is a three stage process. The stages in this process are shareholder value, profit, invested capital, sales, costs, working capital, fixed capital.
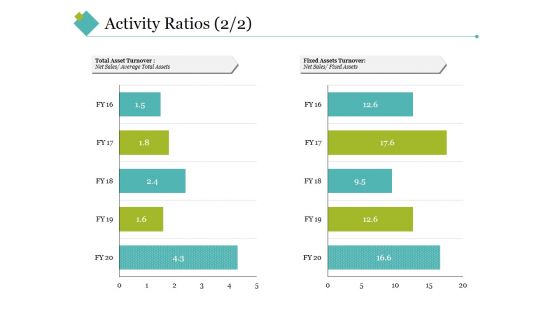
Activity Ratios Template 3 Ppt PowerPoint Presentation File Diagrams
This is a activity ratios template 3 ppt powerpoint presentation file diagrams. This is a two stage process. The stages in this process are total asset turnover, fixed assets turnover, net sales.
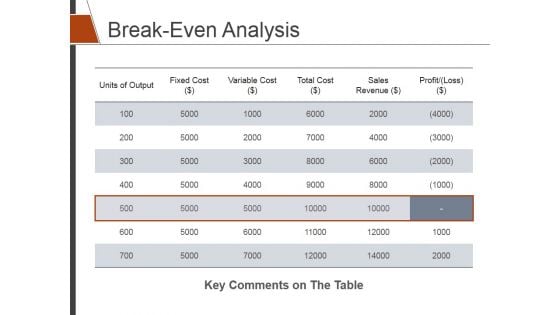
Break Even Analysis Ppt PowerPoint Presentation Summary Background Designs
This is a break even analysis ppt powerpoint presentation summary background designs. This is a five stage process. The stages in this process are units of output, fixed cost, variable cost, total cost, sales revenue.
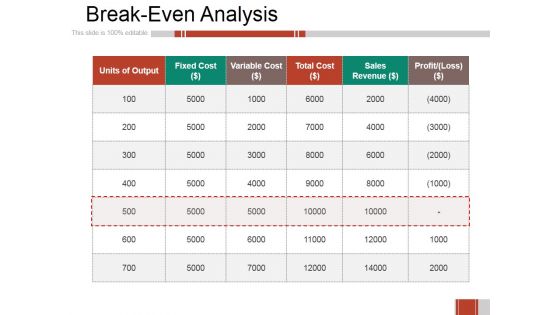
Breakeven Analysis Ppt PowerPoint Presentation Professional Design Templates
This is a breakeven analysis ppt powerpoint presentation professional design templates. This is a six stage process. The stages in this process are units of output, fixed cost, variable cost, total cost, sales revenue.
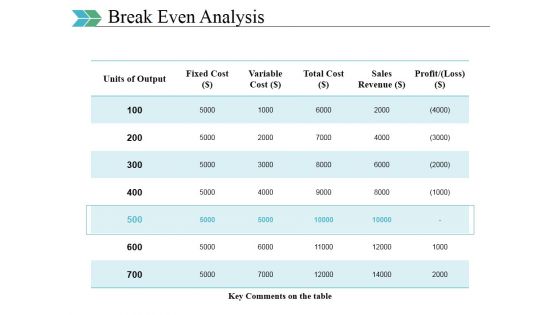
Break Even Analysis Ppt PowerPoint Presentation Styles Influencers
This is a break even analysis ppt powerpoint presentation styles influencers. This is a five stage process. The stages in this process are units of output, fixed cost, variable cost, total cost, sales revenue.
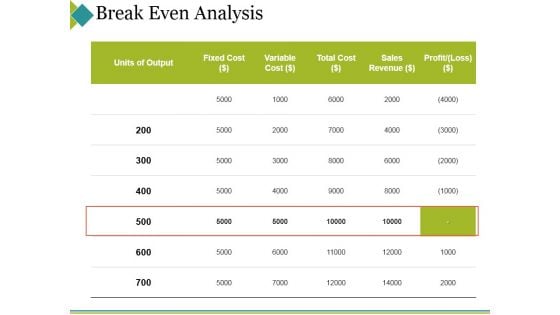
Break Even Analysis Ppt PowerPoint Presentation Outline Example Topics
This is a break even analysis ppt powerpoint presentation outline example topics. This is a five stage process. The stages in this process are units of output, variable, fixed cost, total cost, sales revenue.
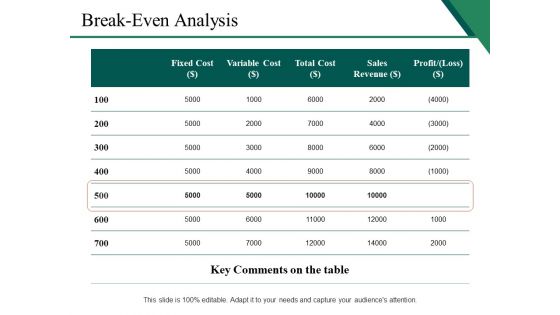
Break Even Analysis Ppt PowerPoint Presentation Pictures Good
This is a break even analysis ppt powerpoint presentation pictures good. This is a five stage process. The stages in this process are key comments on the table, units of output, fixed cost, variable cost, sales revenue.
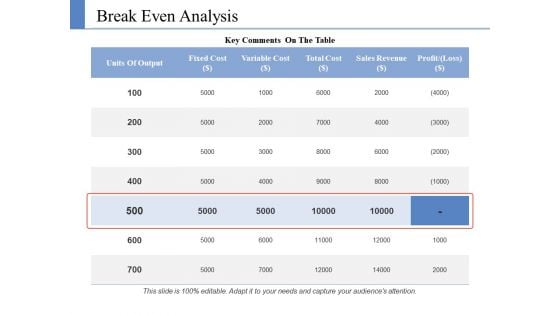
Break Even Analysis Ppt PowerPoint Presentation Portfolio Graphics Design
This is a break even analysis ppt powerpoint presentation portfolio graphics design. This is a five stage process. The stages in this process are units of output, fixed cost, variable cost, total cost, sales revenue.
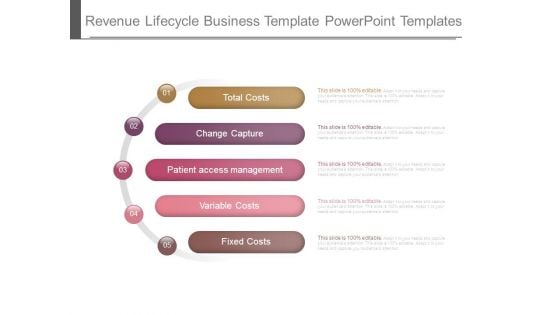
Revenue Lifecycle Business Template Powerpoint Templates
This is a revenue lifecycle business template powerpoint templates. This is a five stage process. The stages in this process are total costs, change capture, patient access management, variable costs, fixed costs.
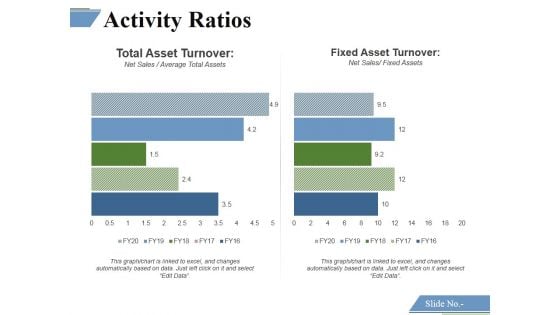
Activity Ratios Template 3 Ppt PowerPoint Presentation Visual Aids Example 2015
This is a activity ratios template 3 ppt powerpoint presentation visual aids example 2015. This is a two stage process. The stages in this process are total asset turnover, fixed asset turnover.
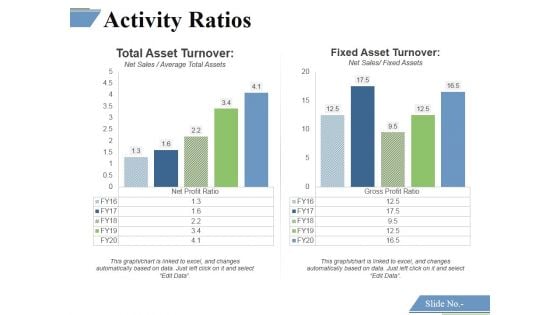
Activity Ratios Template 4 Ppt PowerPoint Presentation Slides Example Introduction
This is a activity ratios template 4 ppt powerpoint presentation slides example introduction. This is a two stage process. The stages in this process are total asset turnover, fixed asset turnover.
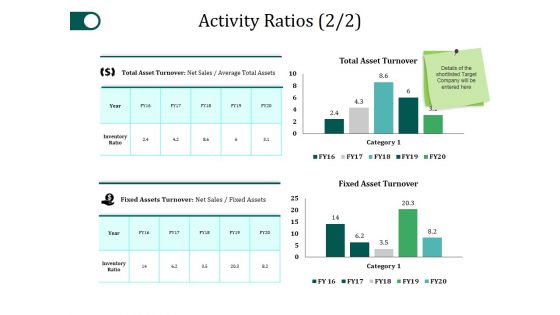
Activity Ratios Template 2 Ppt PowerPoint Presentation File Example File
This is a activity ratios template 2 ppt powerpoint presentation file example file. This is a two stage process. The stages in this process are total asset turnover, fixed asset turnover, category, table, business.
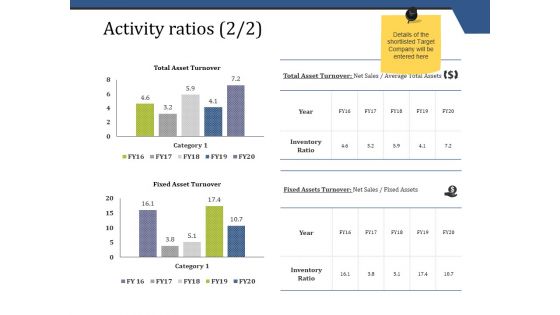
Activity Ratios Template 2 Ppt PowerPoint Presentation Pictures Template
This is a activity ratios template 2 ppt powerpoint presentation pictures template. This is a two stage process. The stages in this process are total asset turnover, fixed asset turnover.
Break Even Analysis Ppt PowerPoint Presentation Icon Slide
This is a break even analysis ppt powerpoint presentation icon slide. This is a four stage process. The stages in this process are total revenue, total costs, variable cost, fixed costs.
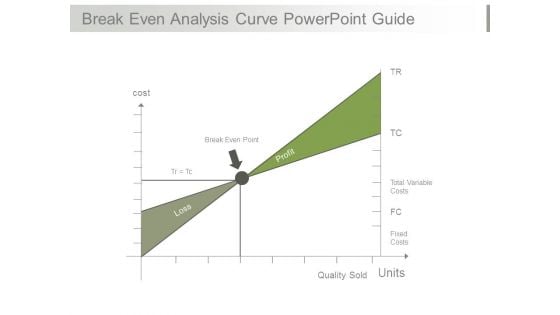
Break Even Analysis Curve Powerpoint Guide
This is a break even analysis curve powerpoint guide. This is a one stage process. The stages in this process are cost, break even point, loss, profit, total variable costs, fixed costs, quality sold, units.
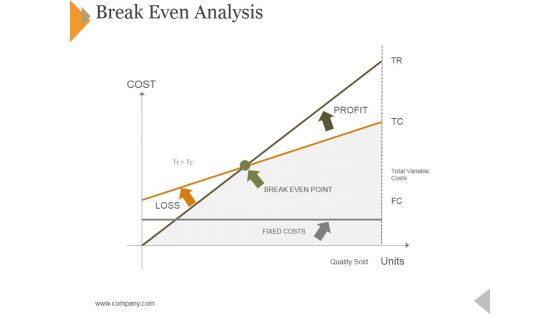
Break Even Analysis Ppt PowerPoint Presentation Model File Formats
This is a break even analysis ppt powerpoint presentation model file formats. This is a two stage process. The stages in this process are cost, loss, break even point, profit, fixed costs.
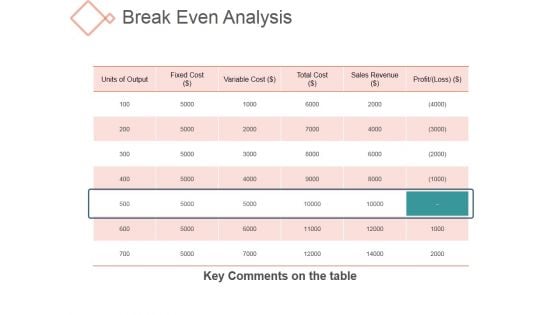
Break Even Analysis Ppt PowerPoint Presentation Deck
This is a break even analysis ppt powerpoint presentation deck. This is a five stage process. The stages in this process are key comments on the table, units of output, fixed cost, variable cost.
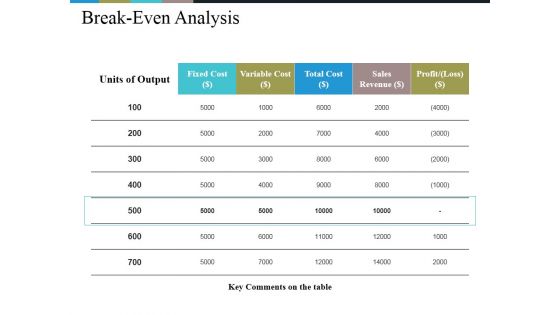
Break Even Analysis Ppt PowerPoint Presentation Styles Template
This is a break even analysis ppt powerpoint presentation styles template. This is a five stage process. The stages in this process are fixed cost, variable cost, key comments on the table, units of output, business.

Outline Overview Ppt Powerpoint Presentation Summary Graphics Design
This is a outline overview ppt powerpoint presentation summary graphics design. This is a two stage process. The stages in this process are financial instruments, time value of money, cash flow, fixed capital analysis, inventory management, commodity exchange.
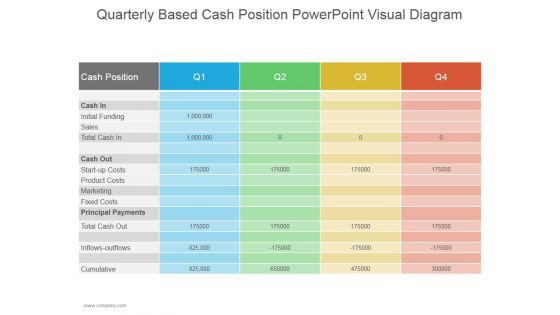
Quarterly Based Cash Position Ppt PowerPoint Presentation Summary
This is a quarterly based cash position ppt powerpoint presentation summary. This is a four stage process. The stages in this process are cash position, initial funding, product costs, start up costs, fixed costs, total cash out.
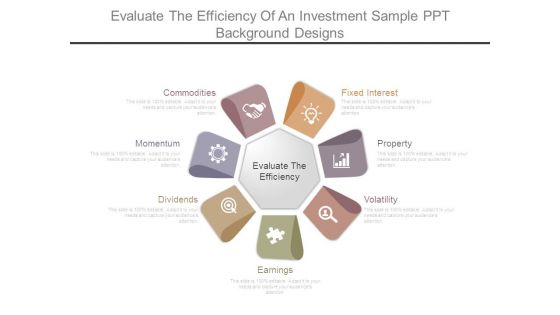
Evaluate The Efficiency Of An Investment Sample Ppt Background Designs
This is a evaluate the efficiency of an investment sample ppt background designs. This is a seven stage process. The stages in this process are fixed interest, property, volatility, earnings, dividends, momentum, commodities.
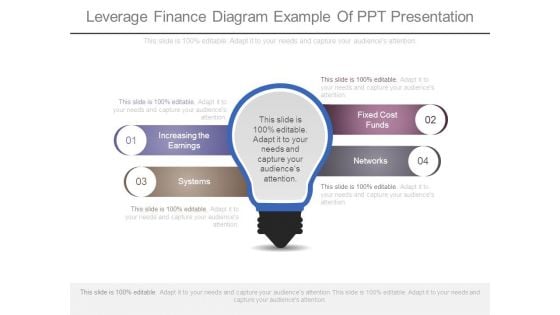
Leverage Finance Diagram Example Of Ppt Presentation
This is a leverage finance diagram example of ppt presentation. This is a four stage process. The stages in this process are increasing the earnings, systems, fixed cost funds, networks.
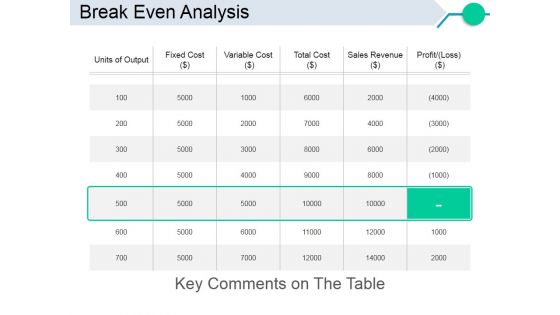
Break Even Analysis Ppt PowerPoint Presentation Model Portfolio
This is a break even analysis ppt powerpoint presentation model portfolio. This is a five stage process. The stages in this process are fixed cost, variable cost, total cost, sales revenue.
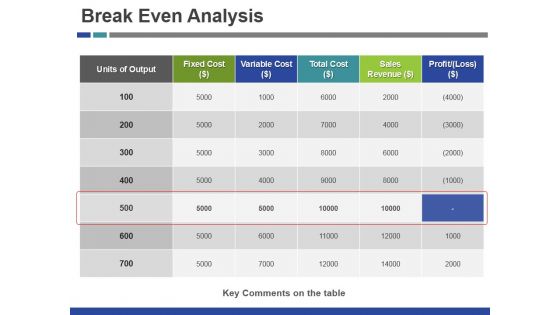
Break Even Analysis Ppt PowerPoint Presentation Inspiration Microsoft
This is a break even analysis ppt powerpoint presentation inspiration microsoft. This is a five stage process. The stages in this process are fixed cost, variable cost, total cost, sales revenue.
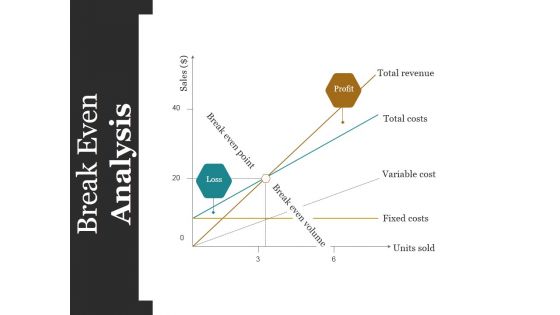
Break Even Analysis Ppt PowerPoint Presentation Inspiration Layouts
This is a break even analysis ppt powerpoint presentation inspiration layouts. This is a three stage process. The stages in this process are total revenue, total costs, variable cost, fixed costs, units sold.
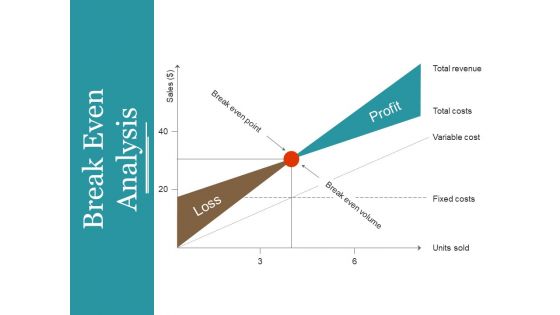
Break Even Analysis Ppt PowerPoint Presentation Gallery Master Slide
This is a break even analysis ppt powerpoint presentation gallery master slide. This is a two stage process. The stages in this process are total revenue, total costs, variable cost, fixed costs, units sold.
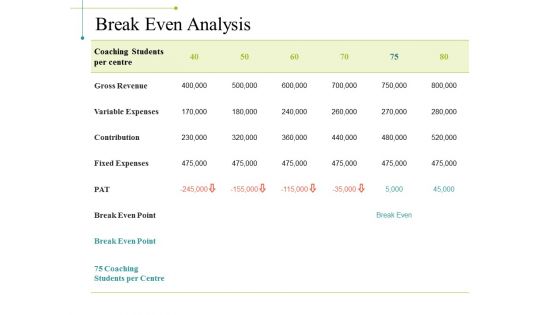
Break Even Analysis Ppt PowerPoint Presentation Model Example File
This is a break even analysis ppt powerpoint presentation model example file. This is a six stage process. The stages in this process are gross revenue, variable expenses, contribution, fixed expenses, break even point.
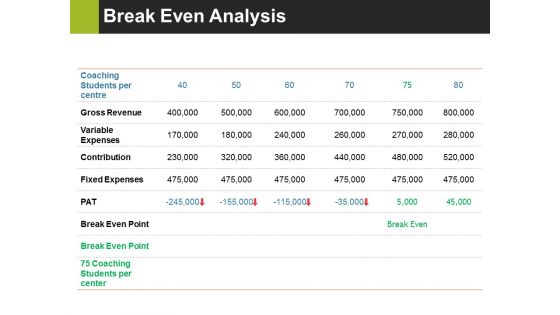
Break Even Analysis Ppt PowerPoint Presentation Layouts Rules
This is a break even analysis ppt powerpoint presentation layouts rules. This is a six stage process. The stages in this process are gross revenue, variable expenses, contribution, fixed expenses.
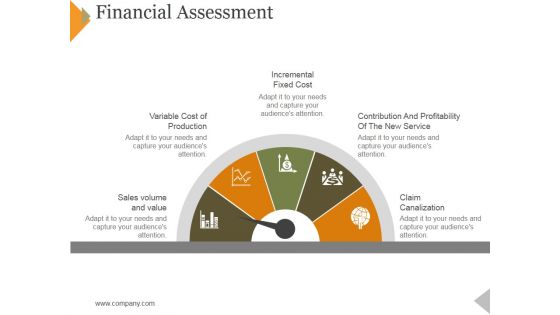
Financial Assessment Ppt PowerPoint Presentation Infographic Template Graphics Pictures
This is a financial assessment ppt powerpoint presentation infographic template graphics pictures. This is a five stage process. The stages in this process are incremental fixed cost, variable cost of production, volume and value, claim canalization.
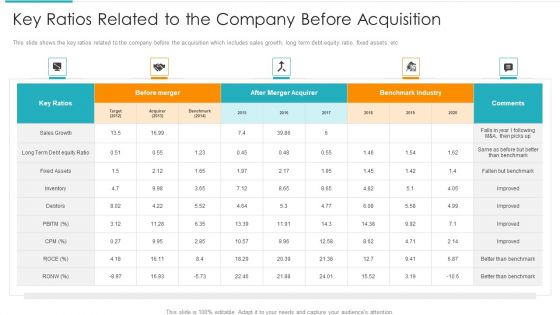
Inorganic Expansion Plan And Progression Key Ratios Related To The Company Before Acquisition Portrait PDF
This slide shows the key ratios related to the company before the acquisition which includes sales growth, long term debt equity ratio, fixed assets, etc. Deliver an awe inspiring pitch with this creative inorganic expansion plan and progression key ratios related to the company before acquisition portrait pdf bundle. Topics like sales growth, inventory, fixed assets, benchmark industry can be discussed with this completely editable template. It is available for immediate download depending on the needs and requirements of the user.

Key Financial Chart Digital Marketings Strategies PPT PowerPoint CP SS V
This slide showcases the sales of Aerospace company. It includes sales growth and net income growth of five years. Sales growth measures the ability of sales team to increase revenue over a fixed period of time. Coming up with a presentation necessitates that the majority of the effort goes into the content and the message you intend to convey. The visuals of a PowerPoint presentation can only be effective if it supplements and supports the story that is being told. Keeping this in mind our experts created Key Financial Chart Digital Marketings Strategies PPT PowerPoint CP SS V to reduce the time that goes into designing the presentation. This way, you can concentrate on the message while our designers take care of providing you with the right template for the situation. This slide showcases the sales of Aerospace company. It includes sales growth and net income growth of five years. Sales growth measures the ability of sales team to increase revenue over a fixed period of time.
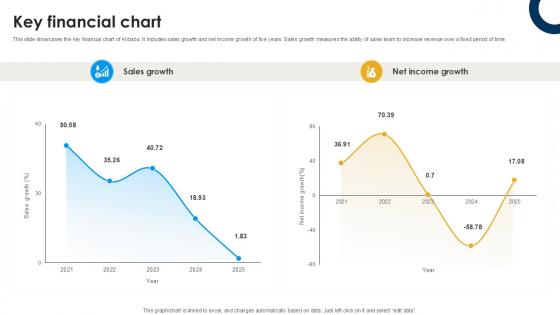
Key Financial Chart International Trade Of Products And Services PPT Template CP SS V
This slide showcases the key financial chart of Alibaba. It includes sales growth and net income growth of five years. Sales growth measures the ability of sales team to increase revenue over a fixed period of time. This modern and well-arranged Key Financial Chart International Trade Of Products And Services PPT Template CP SS V provides lots of creative possibilities. It is very simple to customize and edit with the Powerpoint Software. Just drag and drop your pictures into the shapes. All facets of this template can be edited with Powerpoint, no extra software is necessary. Add your own material, put your images in the places assigned for them, adjust the colors, and then you can show your slides to the world, with an animated slide included. This slide showcases the key financial chart of Alibaba. It includes sales growth and net income growth of five years. Sales growth measures the ability of sales team to increase revenue over a fixed period of time.
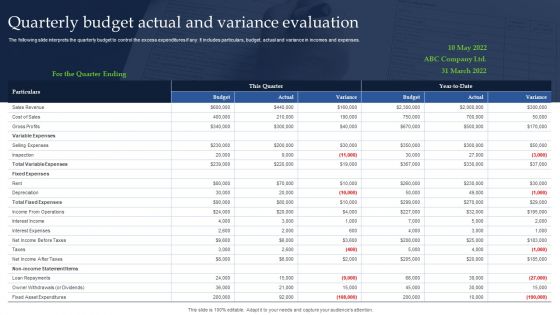
Quarterly Budget Actual And Variance Evaluation Portrait PDF
The following slide interprets the quarterly budget to control the excess expenditures if any. It includes particulars, budget, actual and variance in incomes and expenses. Pitch your topic with ease and precision using this Quarterly Budget Actual And Variance Evaluation Portrait PDF. This layout presents information on Sales Revenue, Fixed Expenses, Interest Expenses. It is also available for immediate download and adjustment. So, changes can be made in the color, design, graphics or any other component to create a unique layout.
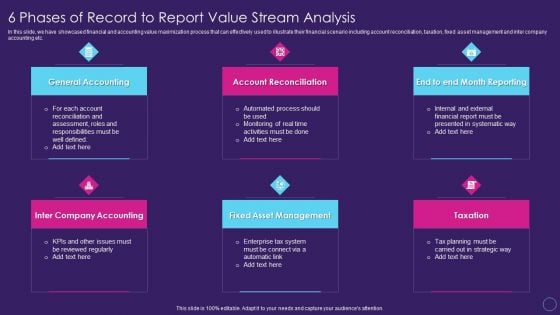
Digital Transformation Toolkit Accounting Finance 6 Phases Of Record To Report Value Stream Analysis Information PDF
In this slide, we have showcased financial and accounting value maximization process that can effectively used to illustrate their financial scenario including account reconciliation, taxation, fixed asset management and inter company accounting etc.Presenting digital transformation toolkit accounting finance 6 phases of record to report value stream analysis information pdf to provide visual cues and insights. Share and navigate important information on six stages that need your due attention. This template can be used to pitch topics like general accounting, account reconciliation, fixed asset management, taxation. In addtion, this PPT design contains high resolution images, graphics, etc, that are easily editable and available for immediate download.
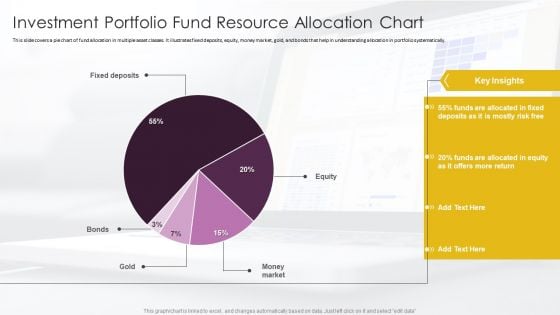
Investment Portfolio Fund Resource Allocation Chart Summary PDF
This slide covers a pie chart of fund allocation in multiple asset classes. It illustrates fixed deposits, equity, money market, gold, and bonds that help in understanding allocation in portfolio systematically. Showcasing this set of slides titled Investment Portfolio Fund Resource Allocation Chart Summary PDF. The topics addressed in these templates are Money Market, Equity, Fixed Deposits. All the content presented in this PPT design is completely editable. Download it and make adjustments in color, background, font etc. as per your unique business setting.
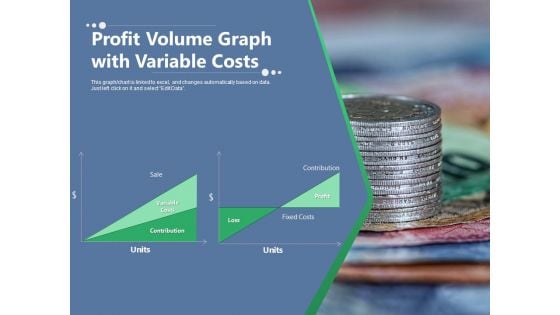
Profit Volume Graph With Variable Costs Ppt PowerPoint Presentation Outline Brochure PDF
Presenting this set of slides with name profit volume graph with variable costs ppt powerpoint presentation outline brochure pdf. This is a one stage process. The stages in this process are sale, contribution, variable costs, profit, fixed costs, loss, units. This is a completely editable PowerPoint presentation and is available for immediate download. Download now and impress your audience.
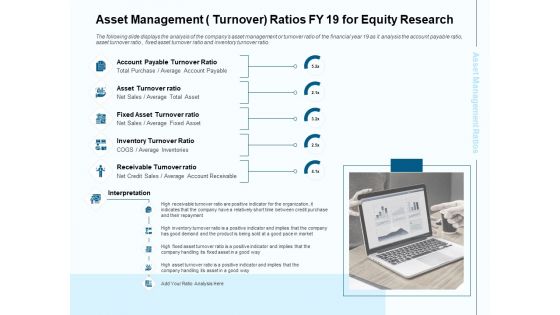
Fund Investment Advisory Statement Asset Management Turnover Ratios FY 19 For Equity Research Introduction PDF
Presenting this set of slides with name fund investment advisory statement asset management turnover ratios fy 19 for equity research introduction pdf. This is a five stage process. The stages in this process are payable, sales, fixed asset, inventories. This is a completely editable PowerPoint presentation and is available for immediate download. Download now and impress your audience.
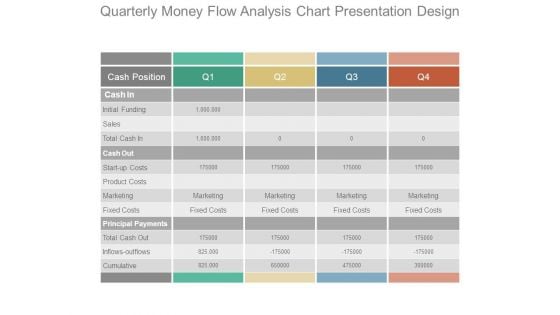
Quarterly Money Flow Analysis Chart Presentation Design
This is a quarterly money flow analysis chart presentation design. This is a four stage process. The stages in this process are cash position, cash in, initial funding, sales, total cash in, cash out, start up costs, product costs, marketing, fixed costs, principal payments, total cash out, inflows outflows, cumulative.
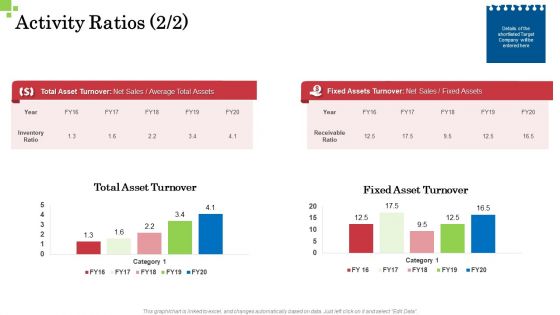
Inorganic Growth Business Activity Ratios Sales Ppt File Inspiration PDF
Deliver and pitch your topic in the best possible manner with this inorganic growth business activity ratios sales ppt file inspiration pdf. Use them to share invaluable insights on total asset turnover, fixed asset turnover and impress your audience. This template can be altered and modified as per your expectations. So, grab it now.
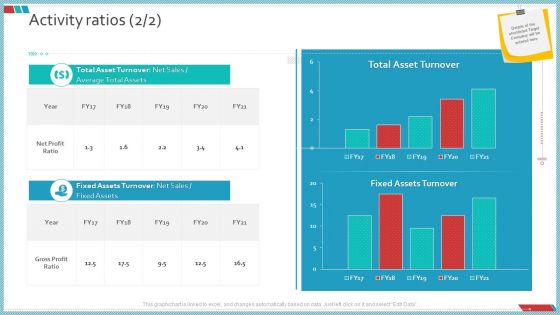
Enterprise Action Plan For Growth Activity Ratios Mockup PDF
Deliver an awe inspiring pitch with this creative enterprise action plan for growth activity ratios mockup pdf bundle. Topics like total asset turnover, fixed assets turnover, total asset turnover net sales or average total assets can be discussed with this completely editable template. It is available for immediate download depending on the needs and requirements of the user.

Merger And Acquisition Strategy For Inorganic Growth Activity Ratios Net Sales Ppt Inspiration Good PDF
Deliver and pitch your topic in the best possible manner with this merger and acquisition strategy for inorganic growth activity ratios net sales ppt inspiration good pdf. Use them to share invaluable insights on activity ratios, net sales, fixed assets, net operating profit, employed capital and impress your audience. This template can be altered and modified as per your expectations. So, grab it now.
Hotel Management Plan Restaurant Operating Expenses Icons PDF
Deliver an awe inspiring pitch with this creative hotel management plan restaurant operating expenses icons pdf bundle. Topics like cost, sales, salaries and wages, fixed costs, revenue can be discussed with this completely editable template. It is available for immediate download depending on the needs and requirements of the user.
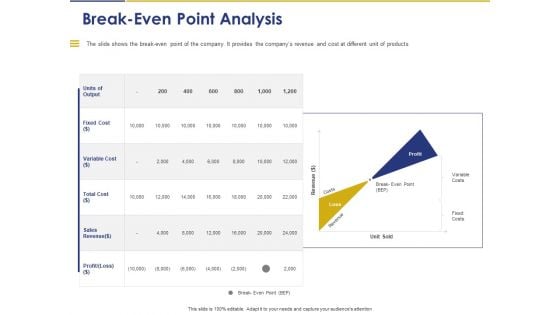
Convertible Note Pitch Deck Funding Strategy Break Even Point Analysis Ppt PowerPoint Presentation Summary Gallery PDF
Presenting this set of slides with name convertible note pitch deck funding strategy break even point analysis ppt powerpoint presentation summary gallery pdf. The topics discussed in these slides are variable cost, fixed cost, sales revenue, profit loss. This is a completely editable PowerPoint presentation and is available for immediate download. Download now and impress your audience.
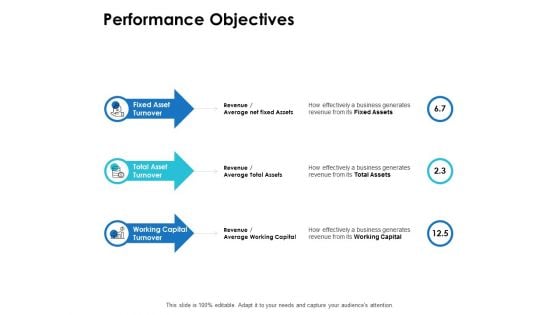
Performance Objectives Ppt PowerPoint Presentation File Samples
Presenting this set of slides with name performance objectives ppt powerpoint presentation file samples. This is a three stage process. The stages in this process are fixed asset turnover, total asset turnover, working capital turnover. This is a completely editable PowerPoint presentation and is available for immediate download. Download now and impress your audience.
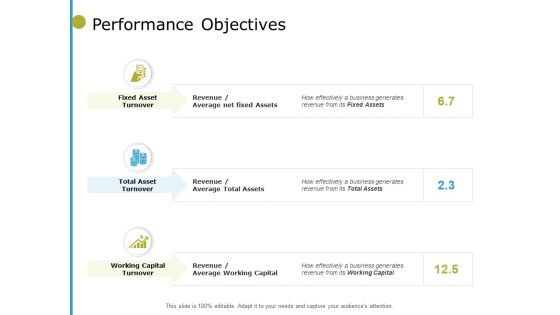
Performance Objectives Capital Ppt PowerPoint Presentation Portfolio Deck
Presenting this set of slides with name performance objectives capital ppt powerpoint presentation portfolio deck. This is a three stage process. The stages in this process are fixed asset turnover, total asset turnover, working capital turnover. This is a completely editable PowerPoint presentation and is available for immediate download. Download now and impress your audience.
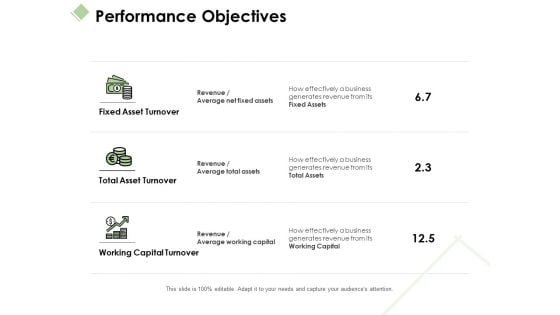
Performance Objectives Ppt PowerPoint Presentation Infographics Themes
Presenting this set of slides with name performance objectives ppt powerpoint presentation infographics themes. This is a three stage process. The stages in this process are fixed asset turnover, total asset turnover, working capital turnover. This is a completely editable PowerPoint presentation and is available for immediate download. Download now and impress your audience.
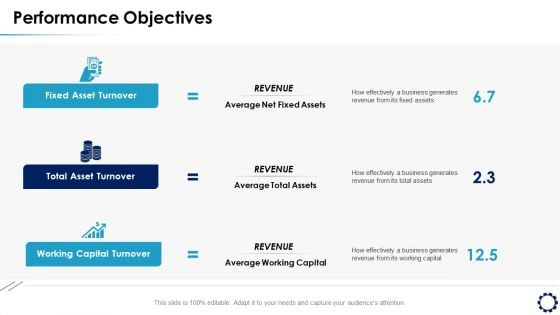
Business Expansion Framework Performance Objectives Ppt Professional Design Templates PDF
Presenting this set of slides with name business expansion framework performance objectives ppt professional design templates pdf. This is a three stage process. The stages in this process are fixed asset turnover, total asset turnover, working capital turnover. This is a completely editable PowerPoint presentation and is available for immediate download. Download now and impress your audience.
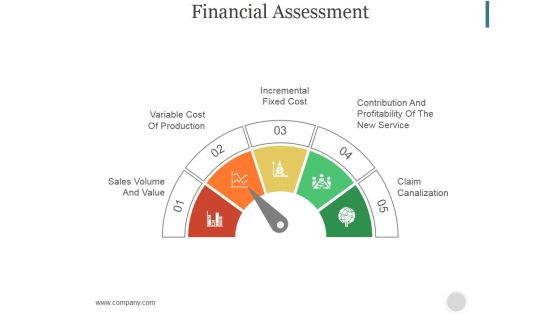
Financial Assessment Ppt PowerPoint Presentation Picture
This is a financial assessment ppt powerpoint presentation picture. This is a five stage process. The stages in this process are sales volume and value, variable cost of production, incremental fixed cost, contribution and profitability of the new service, claim canalization.
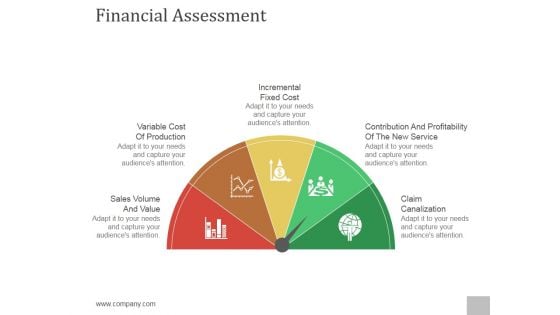
Financial Assessment Ppt PowerPoint Presentation Styles
This is a financial assessment ppt powerpoint presentation styles. This is a five stage process. The stages in this process are sales volume and value, variable cost of production, incremental fixed cost, contribution and profitability of the new service, claim canalization.
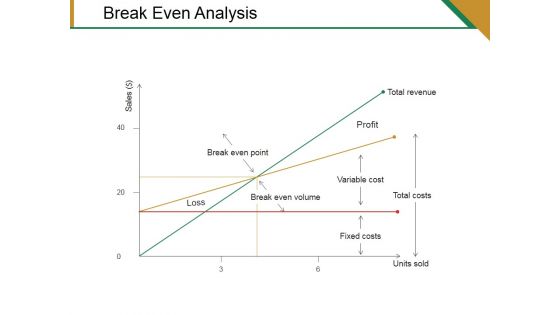
Break Even Analysis Ppt PowerPoint Presentation Infographics Example Topics
This is a break even analysis ppt powerpoint presentation infographics example topics. This is a three stage process. The stages in this process are break even point, break even volume, variable cost, total costs, fixed costs, units sold, total revenue profit, loss.
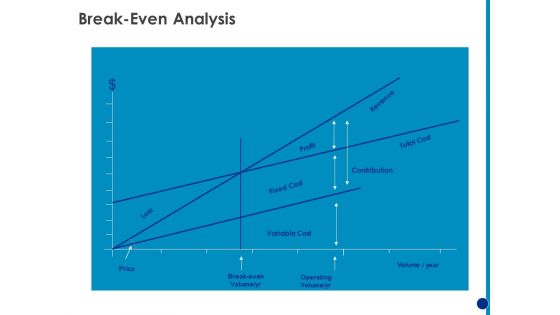
Generating Financial Support Break Even Analysis Ppt Infographic Template Mockup PDF
Presenting this set of slides with name generating financial support break even analysis ppt infographic template mockup pdf. This is a one stage process. The stages in this process are contribution, revenue, profit, fixed cost, variable cost. This is a completely editable PowerPoint presentation and is available for immediate download. Download now and impress your audience.
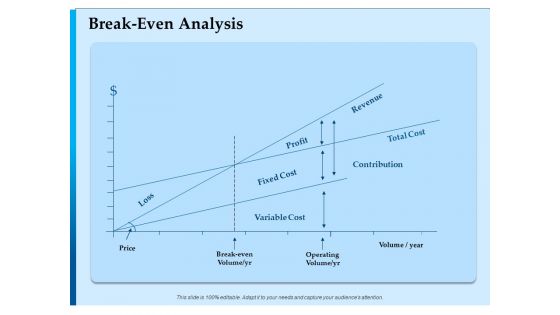
Corporate Fundraising Ideas And Strategies Break Even Analysis Ppt Pictures Layouts PDF
Presenting this set of slides with name corporate fundraising ideas and strategies break even analysis ppt pictures layouts pdf. This is a one stage process. The stages in this process are contribution, revenue, profit, fixed cost, variable cost. This is a completely editable PowerPoint presentation and is available for immediate download. Download now and impress your audience.


 Continue with Email

 Home
Home


