Flag Icon
Negative Impact Of Ineffective Farm Marketing Agricultural Product Promotion Graphics Pdf
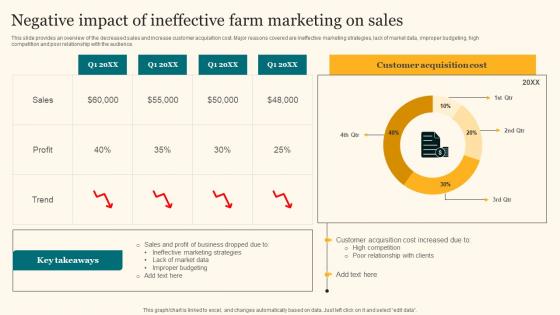
This slide provides an overview of the decreased sales and increase customer acquisition cost. Major reasons covered are ineffective marketing strategies, lack of market data, improper budgeting, high competition and poor relationship with the audience. Here you can discover an assortment of the finest PowerPoint and Google Slides templates. With these templates, you can create presentations for a variety of purposes while simultaneously providing your audience with an eye-catching visual experience. Download Negative Impact Of Ineffective Farm Marketing Agricultural Product Promotion Graphics Pdf to deliver an impeccable presentation. These templates will make your job of preparing presentations much quicker, yet still, maintain a high level of quality. Slidegeeks has experienced researchers who prepare these templates and write high-quality content for you. Later on, you can personalize the content by editing the Negative Impact Of Ineffective Farm Marketing Agricultural Product Promotion Graphics Pdf. This slide provides an overview of the decreased sales and increase customer acquisition cost. Major reasons covered are ineffective marketing strategies, lack of market data, improper budgeting, high competition and poor relationship with the audience.
Global Hospitality Industry Market Size Analysis Lodging And Accommodation Industry IR SS V
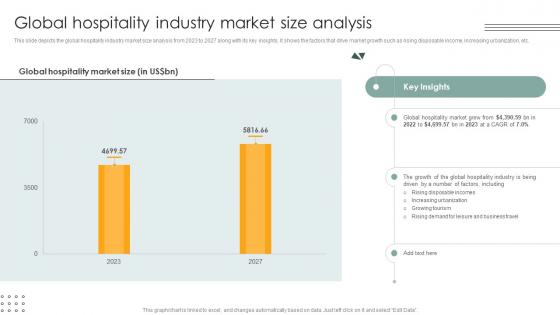
This slide depicts the global hospitality industry market size analysis from 2023 to 2027 along with its key insights. It shows the factors that drive market growth such as rising disposable income, increasing urbanization, etc. Do you have an important presentation coming up Are you looking for something that will make your presentation stand out from the rest Look no further than Global Hospitality Industry Market Size Analysis Lodging And Accommodation Industry IR SS V. With our professional designs, you can trust that your presentation will pop and make delivering it a smooth process. And with Slidegeeks, you can trust that your presentation will be unique and memorable. So why wait Grab Global Hospitality Industry Market Size Analysis Lodging And Accommodation Industry IR SS V today and make your presentation stand out from the rest This slide depicts the global hospitality industry market size analysis from 2023 to 2027 along with its key insights. It shows the factors that drive market growth such as rising disposable income, increasing urbanization, etc.
Leisure Market Overview And Analysis Lodging And Accommodation Industry IR SS V
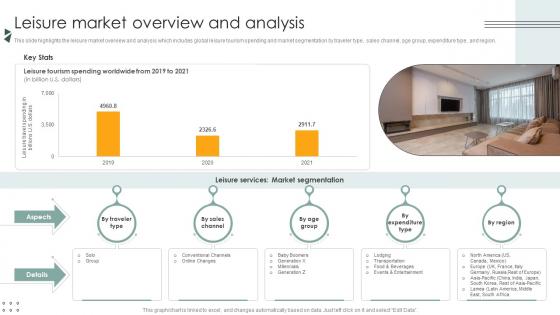
This slide highlights the leisure market overview and analysis which includes global leisure tourism spending and market segmentation by traveler type, sales channel, age group, expenditure type, and region. Here you can discover an assortment of the finest PowerPoint and Google Slides templates. With these templates, you can create presentations for a variety of purposes while simultaneously providing your audience with an eye-catching visual experience. Download Leisure Market Overview And Analysis Lodging And Accommodation Industry IR SS V to deliver an impeccable presentation. These templates will make your job of preparing presentations much quicker, yet still, maintain a high level of quality. Slidegeeks has experienced researchers who prepare these templates and write high-quality content for you. Later on, you can personalize the content by editing the Leisure Market Overview And Analysis Lodging And Accommodation Industry IR SS V. This slide highlights the leisure market overview and analysis which includes global leisure tourism spending and market segmentation by traveler type, sales channel, age group, expenditure type, and region.

Online Bookstore Business Plan Global Books Market Statistics And Outlook BP SS V
This slide aims to highlight the market size of the global books market outlook, including its share in 2022, forecasted value in 2030, and its CAGR. It also reflects emerging trends, offering insights into the current state and future projections of the industry. Crafting an eye-catching presentation has never been more straightforward. Let your presentation shine with this tasteful yet straightforward Online Bookstore Business Plan Global Books Market Statistics And Outlook BP SS V template. It offers a minimalistic and classy look that is great for making a statement. The colors have been employed intelligently to add a bit of playfulness while still remaining professional. Construct the ideal Online Bookstore Business Plan Global Books Market Statistics And Outlook BP SS V that effortlessly grabs the attention of your audience Begin now and be certain to wow your customers This slide aims to highlight the market size of the global books market outlook, including its share in 2022, forecasted value in 2030, and its CAGR. It also reflects emerging trends, offering insights into the current state and future projections of the industry.
Global Crowdfunding Market Size Analysis Crowdfunding Strategies To Raise Funds Fin SS V
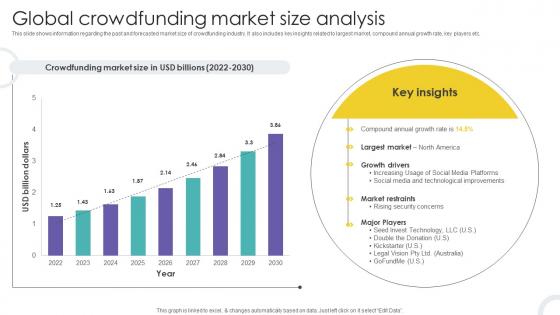
This slide shows information regarding the past and forecasted market size of crowdfunding industry. It also includes key insights related to largest market, compound annual growth rate, key players etc. Formulating a presentation can take up a lot of effort and time, so the content and message should always be the primary focus. The visuals of the PowerPoint can enhance the presenters message, so our Global Crowdfunding Market Size Analysis Crowdfunding Strategies To Raise Funds Fin SS V was created to help save time. Instead of worrying about the design, the presenter can concentrate on the message while our designers work on creating the ideal templates for whatever situation is needed. Slidegeeks has experts for everything from amazing designs to valuable content, we have put everything into Global Crowdfunding Market Size Analysis Crowdfunding Strategies To Raise Funds Fin SS V. This slide shows information regarding the past and forecasted market size of crowdfunding industry. It also includes key insights related to largest market, compound annual growth rate, key players etc.
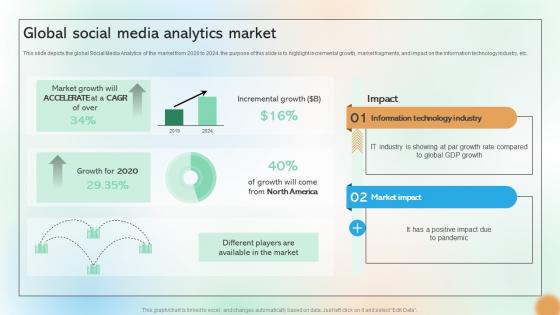
Global Social Media Analytics Market Cracking The Code Of Social Media
This slide depicts the global Social Media Analytics of the market from 2020 to 2024. the purpose of this slide is to highlight incremental growth, market fragments, and impact on the information technology industry, etc. Do you have to make sure that everyone on your team knows about any specific topic I yes, then you should give Global Social Media Analytics Market Cracking The Code Of Social Media a try. Our experts have put a lot of knowledge and effort into creating this impeccable Global Social Media Analytics Market Cracking The Code Of Social Media. You can use this template for your upcoming presentations, as the slides are perfect to represent even the tiniest detail. You can download these templates from the Slidegeeks website and these are easy to edit. So grab these today This slide depicts the global Social Media Analytics of the market from 2020 to 2024. the purpose of this slide is to highlight incremental growth, market fragments, and impact on the information technology industry, etc.

Unlocking Potential IoTs Application Global IoT Market Share By Industry IoT SS V
This slide provides the market share of IoT by industry. It covers the market share owned by the following sectors utilities, manufacturing, transportation, oil and gas, life sciences, consumer goods, healthcare, travel and hospitality, insurance, banking, transportation, etc. Explore a selection of the finest Unlocking Potential IoTs Application Global IoT Market Share By Industry IoT SS V here. With a plethora of professionally designed and pre-made slide templates, you can quickly and easily find the right one for your upcoming presentation. You can use our Unlocking Potential IoTs Application Global IoT Market Share By Industry IoT SS V to effectively convey your message to a wider audience. Slidegeeks has done a lot of research before preparing these presentation templates. The content can be personalized and the slides are highly editable. Grab templates today from Slidegeeks. This slide provides the market share of IoT by industry. It covers the market share owned by the following sectors utilities, manufacturing, transportation, oil and gas, life sciences, consumer goods, healthcare, travel and hospitality, insurance, banking, transportation, etc.
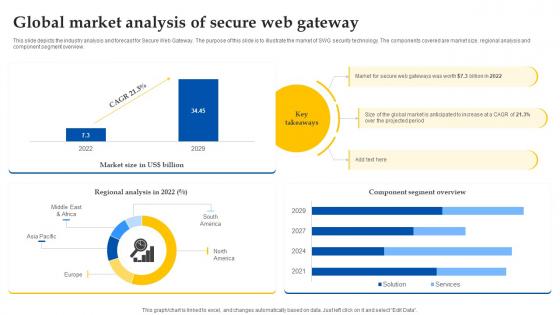
Web Access Control Solution Global Market Analysis Of Secure Web Gateway
This slide depicts the industry analysis and forecast for Secure Web Gateway. The purpose of this slide is to illustrate the market of SWG security technology. The components covered are market size, regional analysis and component segment overview. This Web Access Control Solution Global Market Analysis Of Secure Web Gateway is perfect for any presentation, be it in front of clients or colleagues. It is a versatile and stylish solution for organizing your meetings. The Web Access Control Solution Global Market Analysis Of Secure Web Gateway features a modern design for your presentation meetings. The adjustable and customizable slides provide unlimited possibilities for acing up your presentation. Slidegeeks has done all the homework before launching the product for you. So, do not wait, grab the presentation templates today This slide depicts the industry analysis and forecast for Secure Web Gateway. The purpose of this slide is to illustrate the market of SWG security technology. The components covered are market size, regional analysis and component segment overview.
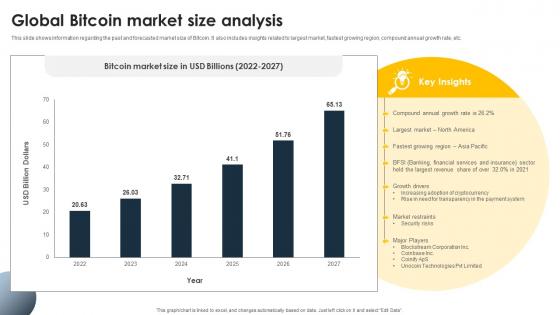
Complete Beginners Guide Global Bitcoin Market Size Analysis Fin SS V
This slide shows information regarding the past and forecasted market size of Bitcoin. It also includes insights related to largest market, fastest growing region, compound annual growth rate, etc. Formulating a presentation can take up a lot of effort and time, so the content and message should always be the primary focus. The visuals of the PowerPoint can enhance the presenters message, so our Complete Beginners Guide Global Bitcoin Market Size Analysis Fin SS V was created to help save time. Instead of worrying about the design, the presenter can concentrate on the message while our designers work on creating the ideal templates for whatever situation is needed. Slidegeeks has experts for everything from amazing designs to valuable content, we have put everything into Complete Beginners Guide Global Bitcoin Market Size Analysis Fin SS V. This slide shows information regarding the past and forecasted market size of Bitcoin. It also includes insights related to largest market, fastest growing region, compound annual growth rate, etc.
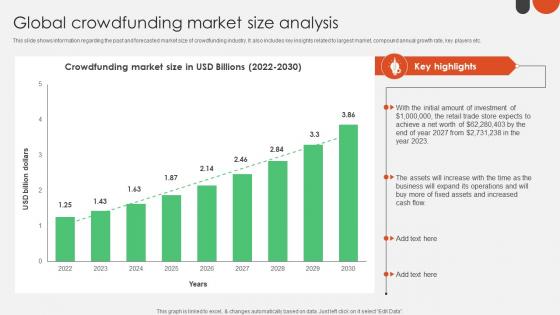
Global Crowdfunding Market Size Analysis Crowdfunding For Nonprofits To Support Fin SS V
This slide shows information regarding the past and forecasted market size of crowdfunding industry. It also includes key insights related to largest market, compound annual growth rate, key players etc. Formulating a presentation can take up a lot of effort and time, so the content and message should always be the primary focus. The visuals of the PowerPoint can enhance the presenters message, so our Global Crowdfunding Market Size Analysis Crowdfunding For Nonprofits To Support Fin SS V was created to help save time. Instead of worrying about the design, the presenter can concentrate on the message while our designers work on creating the ideal templates for whatever situation is needed. Slidegeeks has experts for everything from amazing designs to valuable content, we have put everything into Global Crowdfunding Market Size Analysis Crowdfunding For Nonprofits To Support Fin SS V This slide shows information regarding the past and forecasted market size of crowdfunding industry. It also includes key insights related to largest market, compound annual growth rate, key players etc.
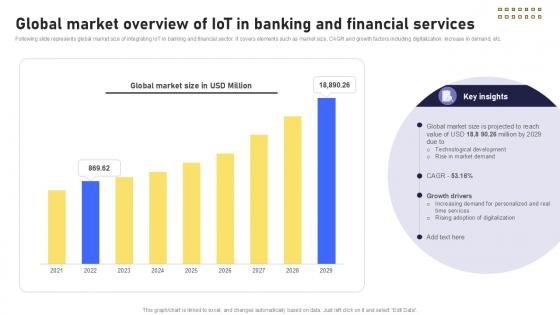
Global Market Overview Of Banking Future With IoT Ppt Powerpoint IoT SS V
Following slide represents global market size of integrating IoT in banking and financial sector. It covers elements such as market size, CAGR and growth factors including digitalization, increase in demand, etc. Do you have to make sure that everyone on your team knows about any specific topic I yes, then you should give Global Market Overview Of Banking Future With IoT Ppt Powerpoint IoT SS V a try. Our experts have put a lot of knowledge and effort into creating this impeccable Global Market Overview Of Banking Future With IoT Ppt Powerpoint IoT SS V. You can use this template for your upcoming presentations, as the slides are perfect to represent even the tiniest detail. You can download these templates from the Slidegeeks website and these are easy to edit. So grab these today Following slide represents global market size of integrating IoT in banking and financial sector. It covers elements such as market size, CAGR and growth factors including digitalization, increase in demand, etc.
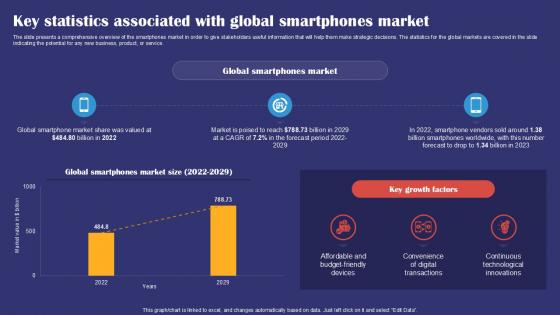
Key Statistics Associated With Global Smartphones Market Smartphones Industry Report PPT Presentation IR SS V
The slide presents a comprehensive overview of the smartphones market in order to give stakeholders useful information that will help them make strategic decisions. The statistics for the global markets are covered in the slide indicating the potential for any new business, product, or service. Crafting an eye catching presentation has never been more straightforward. Let your presentation shine with this tasteful yet straightforward Key Statistics Associated With Global Smartphones Market Smartphones Industry Report PPT Presentation IR SS V template. It offers a minimalistic and classy look that is great for making a statement. The colors have been employed intelligently to add a bit of playfulness while still remaining professional. Construct the ideal Key Statistics Associated With Global Smartphones Market Smartphones Industry Report PPT Presentation IR SS V that effortlessly grabs the attention of your audience Begin now and be certain to wow your customers The slide presents a comprehensive overview of the smartphones market in order to give stakeholders useful information that will help them make strategic decisions. The statistics for the global markets are covered in the slide indicating the potential for any new business, product, or service.
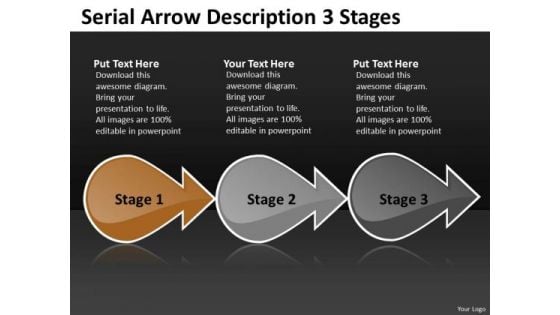
Serial Arrow Description 3 Stages New Product Flow Chart PowerPoint Templates
We present our serial arrow description 3 stages new product flow chart PowerPoint templates.Use our Arrows PowerPoint Templates because,This template helps you to illustrate your method, piece by piece, and interlock the whole process in the minds of your audience. Use our Symbol PowerPoint Templates because,It helps you to Inform your team of your innovative ideas. Use our Marketing PowerPoint Templates because, You can Refine them all as you take them through the numerous filtering stages of the funnel of your quality control process. Use our Leadership PowerPoint Templates because,With the help of our Slides you can Illustrate your plans to your listeners with the same accuracy. Use our Process and Flows PowerPoint Templates because,It have all to represent to your viewers.Use these PowerPoint slides for presentations relating to Arrow, Arrows, Block, Business, Chart, Design, Development, Diagram, Direction, Element, Flow, Flowchart, Graph, Linear, Management, Organization, Process, Program, Section, Sign, Solution, Symbol. The prominent colors used in the PowerPoint template are Brown, Gray, Black. People tell us our serial arrow description 3 stages new product flow chart PowerPoint templates are Tranquil. PowerPoint presentation experts tell us our Development PowerPoint templates and PPT Slides will make you look like a winner. PowerPoint presentation experts tell us our serial arrow description 3 stages new product flow chart PowerPoint templates are Youthful. Professionals tell us our Block PowerPoint templates and PPT Slides are Enchanting. Professionals tell us our serial arrow description 3 stages new product flow chart PowerPoint templates will make the presenter successul in his career/life. People tell us our Diagram PowerPoint templates and PPT Slides are Clever. Impress a church with our Serial Arrow Description 3 Stages New Product Flow Chart PowerPoint Templates. Just download, type and present.
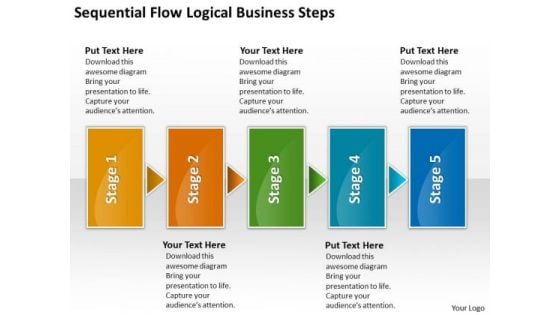
Logical New Business PowerPoint Presentation Steps Basic Process Flow Chart Templates
We present our logical new business powerpoint presentation steps basic process flow chart templates.Download our Arrows PowerPoint Templates because you understand how each drives the next to motor the entire sequence. Use our Marketing PowerPoint Templates because networking is an imperative in todays world. You need to access the views of others. Similarly you need to give access to them of your abilities. Download and present our Advertising PowerPoint Templates because you have it all down to a nicety, slice by slice, layer by layer. Use our Leadership PowerPoint Templates because this diagram can be used to illustrate the logical path or system. Download and present our Process and Flows PowerPoint Templates because you can see In any endeavour people matter most.Use these PowerPoint slides for presentations relating to Abstract, Action, Attach, Box, Business, Center, Chain, Chart, Color, Communication, Concept, Connection, Cube, Cycle, Data, Diagram, Flow, Globe, Horizontal, Idea, Illustration, Information, Interaction, Jigsaw, Join, Link, Pieces, Process, Puzzle, Relation, Relationship, Shape, Success. The prominent colors used in the PowerPoint template are Orange, Yellow, Green. Customers tell us our logical new business powerpoint presentation steps basic process flow chart templates are effectively colour coded to prioritise your plans They automatically highlight the sequence of events you desire. The feedback we get is that our Chain PowerPoint templates and PPT Slides are Adorable. Professionals tell us our logical new business powerpoint presentation steps basic process flow chart templates are Whimsical. People tell us our Chain PowerPoint templates and PPT Slides are Awesome. Customers tell us our logical new business powerpoint presentation steps basic process flow chart templates are Appealing. Professionals tell us our Color PowerPoint templates and PPT Slides are Excellent. Communicate your clear thoughts with our Logical New Business PowerPoint Presentation Steps Basic Process Flow Chart Templates. You will come out on top.
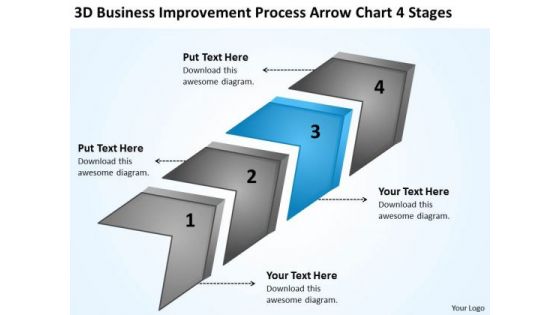
Improvement Process Arrow Chart 4 Stages Startup Business Plan Examples PowerPoint Templates
We present our improvement process arrow chart 4 stages startup business plan examples PowerPoint templates.Download our Marketing PowerPoint Templates because displaying your ideas and highlighting your ability will accelerate the growth of your company and yours. Download and present our Success PowerPoint Templates because the choices you make today will determine the future growth of your enterprise. Download and present our Business PowerPoint Templates because this diagram can set an example to enthuse your team with the passion and fervour of your ideas. Present our Process and Flows PowerPoint Templates because you have it all down to a nicety, slice by slice, layer by layer. Download our Arrows PowerPoint Templates because this slide shows each path to the smallest detail.Use these PowerPoint slides for presentations relating to Algorithm, Arrow, Arrows, Block, Business, Chart, Connection, Design, Development, Diagram, Direction, Element, Flow, Flowchart, Graph, Kind, Linear, Management, Organization, Process, Program, Section, Segment, Set, Sign, Solution, Strategy, Symbol. The prominent colors used in the PowerPoint template are Blue, Gray, Black. We assure you our improvement process arrow chart 4 stages startup business plan examples PowerPoint templates are Nice. We assure you our Connection PowerPoint templates and PPT Slides are topically designed to provide an attractive backdrop to any subject. Customers tell us our improvement process arrow chart 4 stages startup business plan examples PowerPoint templates are Whimsical. Presenters tell us our Connection PowerPoint templates and PPT Slides are Lush. You can be sure our improvement process arrow chart 4 stages startup business plan examples PowerPoint templates are aesthetically designed to attract attention. We guarantee that they will grab all the eyeballs you need. The feedback we get is that our Arrows PowerPoint templates and PPT Slides are Beautiful. Plan your field work with our Improvement Process Arrow Chart 4 Stages Startup Business Plan Examples PowerPoint Templates. Let your team know what you expect.
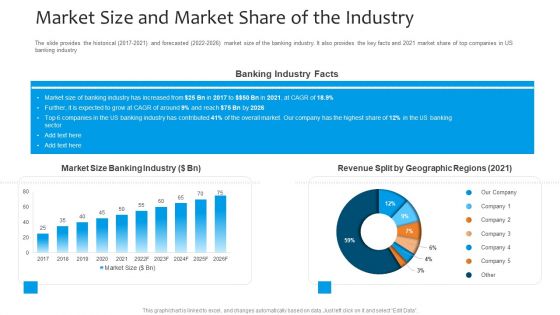
Funding Pitch To Raise Funds From PE Market Size And Market Share Of The Industry Background PDF
The slide provides the historical 2017 2021 and forecasted 2022 2026 market size of the banking industry. It also provides the key facts and 2021 market share of top companies in US banking industry. Deliver and pitch your topic in the best possible manner with this funding pitch to raise funds from pe market size and market share of the industry background pdf. Use them to share invaluable insights on geographic, market, industry and impress your audience. This template can be altered and modified as per your expectations. So, grab it now.
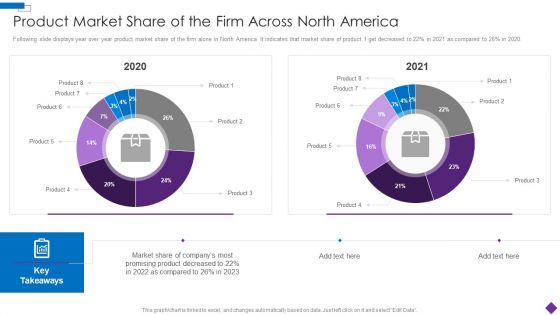
Introducing A New Product To The Market Product Market Share Of The Firm Across North America Structure PDF
Following slide displays year over year product market share of the firm alone in North America. It indicates that market share of product 1 get decreased to 22persent in 2021 as compared to 26persent in 2020.Deliver and pitch your topic in the best possible manner with this Introducing A New Product To The Market Product Market Share Of The Firm Across North America Structure PDF Use them to share invaluable insights on Product Market Share Of The Firm Across North America and impress your audience. This template can be altered and modified as per your expectations. So, grab it now.
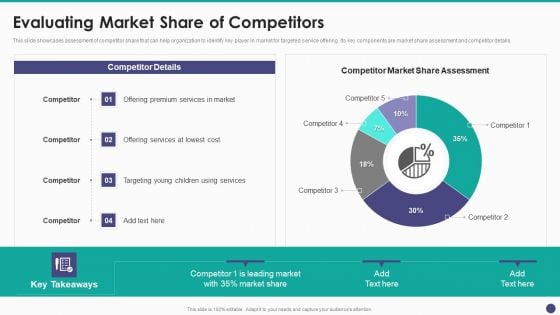
New Service Launch And Development Strategy To Gain Market Share Evaluating Market Share Of Competitors Information PDF
This slide showcases assessment of competitor share that can help organization to identify key player in market for targeted service offering. Its key components are market share assessment and competitor details.Deliver and pitch your topic in the best possible manner with this New Service Launch And Development Strategy To Gain Market Share Evaluating Market Share Of Competitors Information PDF Use them to share invaluable insights on Competitor Details, Competitor Market, Premium Services and impress your audience. This template can be altered and modified as per your expectations. So, grab it now.
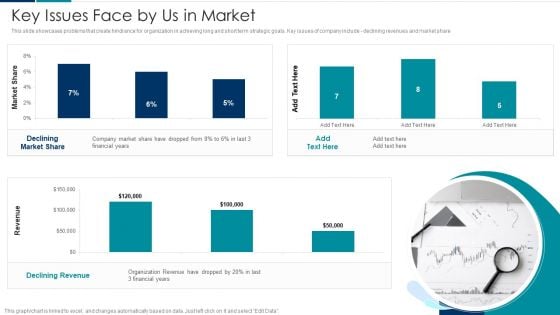
Managing New Service Roll Out And Marketing Procedure Key Issues Face By Us In Market Sample PDF
This slide showcases problems that create hindrance for organization in achieving long and short term strategic goals. Key issues of company include declining revenues and market share. Deliver an awe inspiring pitch with this creative Managing New Service Roll Out And Marketing Procedure Key Issues Face By Us In Market Sample PDF bundle. Topics like Declining Market Share, Organization Revenue, Company Market Share can be discussed with this completely editable template. It is available for immediate download depending on the needs and requirements of the user.
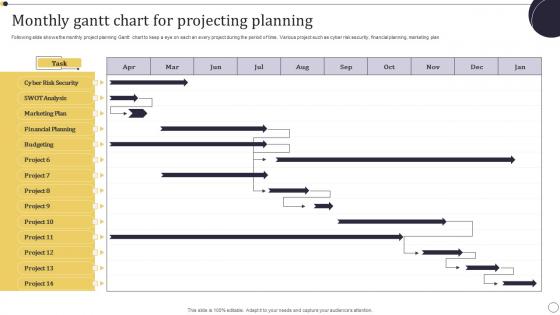
Monthly Gantt Chart For Projecting Planning Information Pdf
Following slide shows the monthly project planning Gantt chart to keep a eye on each an every project during the period of time. Various project such as cyber risk security, financial planning, marketing plan Showcasing this set of slides titled Monthly Gantt Chart For Projecting Planning Information Pdf. The topics addressed in these templates are Marketing Plan, Financial Planning, Cyber Risk Security . All the content presented in this PPT design is completely editable. Download it and make adjustments in color, background, font etc. as per your unique business setting. Following slide shows the monthly project planning Gantt chart to keep a eye on each an every project during the period of time. Various project such as cyber risk security, financial planning, marketing plan
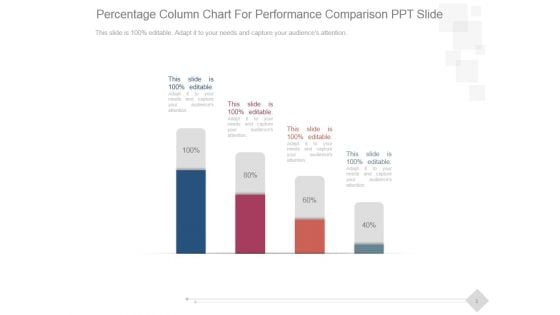
Percentage Column Chart For Performance Comparison Ppt PowerPoint Presentation Good
This is a percentage column chart for performance comparison ppt powerpoint presentation good. This is a four stage process. The stages in this process are business, marketing, technology, presentation, management.
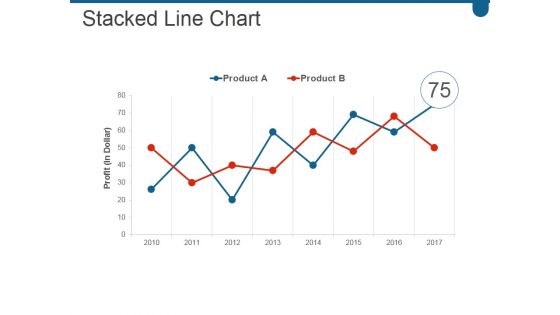
Stacked Line Chart Ppt PowerPoint Presentation Infographic Template Show
This is a stacked line chart ppt powerpoint presentation infographic template show. This is a two stage process. The stages in this process are business, marketing, growth, success, line.

Combo Chart Ppt PowerPoint Presentation Infographic Template Influencers
This is a combo chart ppt powerpoint presentation infographic template influencers. This is a three stage process. The stages in this process are market size rmb million, growth rate.
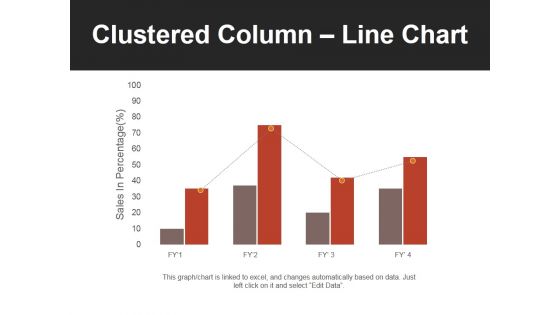
Clustered Column Line Chart Ppt PowerPoint Presentation Professional Slides
This is a clustered column line chart ppt powerpoint presentation professional slides. This is a four stage process. The stages in this process are bar, finance, business, marketing, growth.
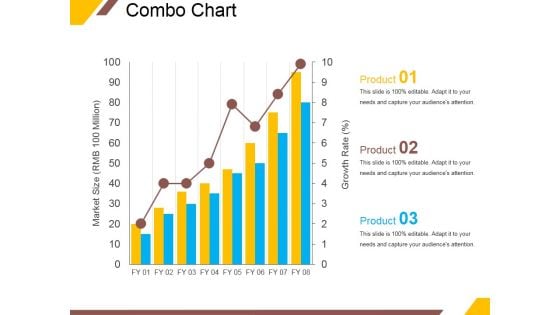
Combo Chart Ppt PowerPoint Presentation Professional Slide Download
This is a combo chart ppt powerpoint presentation professional slide download. This is a three stage process. The stages in this process are market size, growth rate, product, graph, growth.
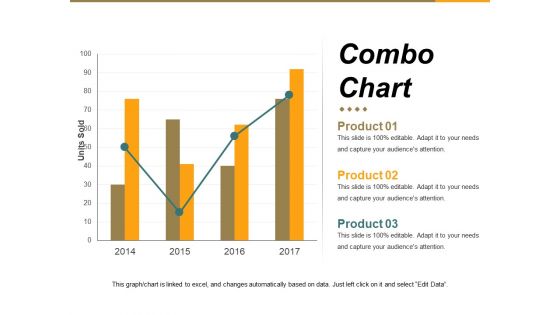
Combo Chart Ppt PowerPoint Presentation Infographics Example Introduction
This is a combo chart ppt powerpoint presentation infographics example introduction. This is a four stage process. The stages in this process are units sold, business, marketing, graph, growth.
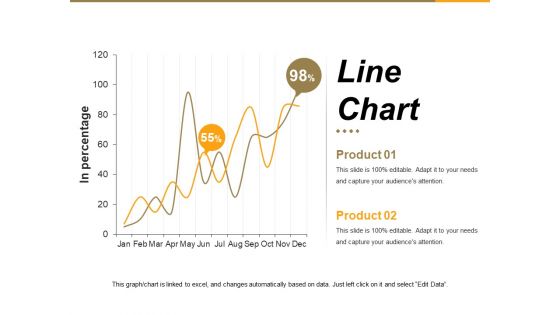
Line Chart Ppt PowerPoint Presentation Summary File Formats
This is a line chart ppt powerpoint presentation summary file formats. This is a two stage process. The stages in this process are in percentage, graph, business, marketing, growth.
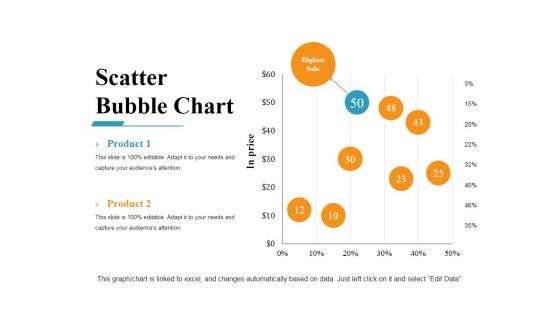
Scatter Bubble Chart Ppt PowerPoint Presentation Gallery Example Introduction
This is a scatter bubble chart ppt powerpoint presentation gallery example introduction. This is a eight stage process. The stages in this process are business, marketing, finance, bubble, scatter.
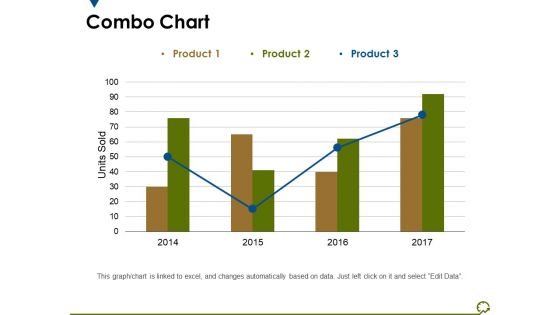
Combo Chart Ppt PowerPoint Presentation Outline Graphics Tutorials
This is a combo chart ppt powerpoint presentation outline graphics tutorials. This is a three stage process. The stages in this process are units sold, years, business, marketing, graph.

Line Chart Ppt PowerPoint Presentation Infographics Graphic Images
This is a line chart ppt powerpoint presentation infographics graphic images. This is a two stage process. The stages in this process are sales in percentage, financial years, growth, business, marketing.
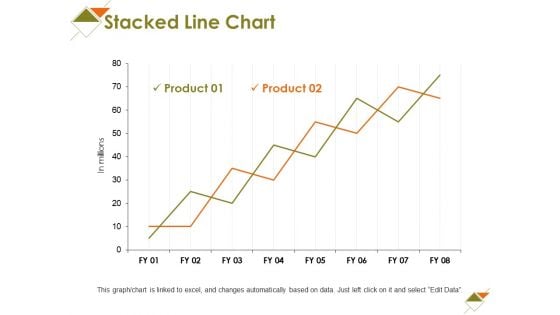
Stacked Line Chart Ppt PowerPoint Presentation File Display
This is a stacked line chart ppt powerpoint presentation file display. This is a two stage process. The stages in this process are business, marketing, graph, strategy, in millions.
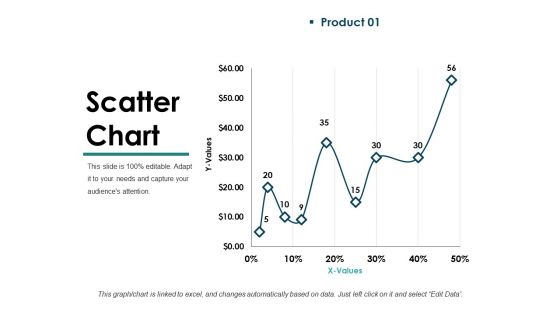
Scatter Chart Template 1 Ppt PowerPoint Presentation Inspiration Guidelines
This is a scatter chart template 1 ppt powerpoint presentation inspiration guidelines. This is a one stage process. The stages in this process are business, marketing, graph, values, growth.
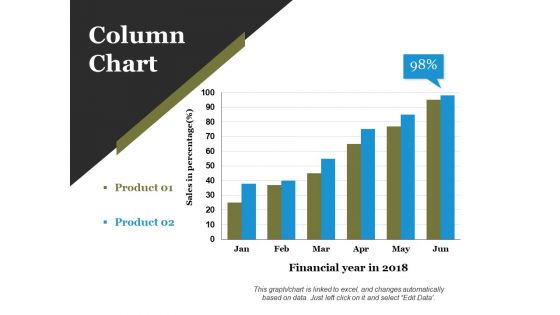
Column Chart Ppt PowerPoint Presentation Infographics Layout Ideas
This is a column chart ppt powerpoint presentation infographics layout ideas. This is a two stage process. The stages in this process are financial year in, business, marketing, growth, graph.
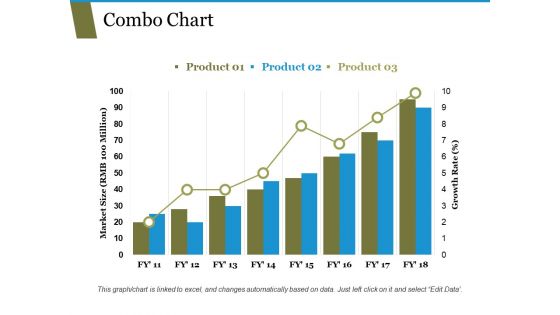
Combo Chart Ppt PowerPoint Presentation Ideas Infographic Template
This is a combo chart ppt powerpoint presentation ideas infographic template. This is a three stage process. The stages in this process are market size growth rate, graph, business, strategy.
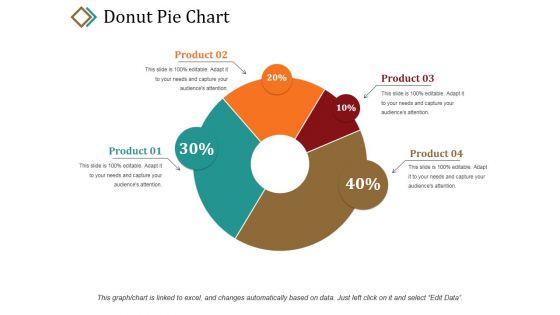
Donut Pie Chart Ppt PowerPoint Presentation Portfolio Graphic Tips
This is a donut pie chart ppt powerpoint presentation portfolio graphic tips. This is a four stage process. The stages in this process are product, percentage, business, marketing, donut.
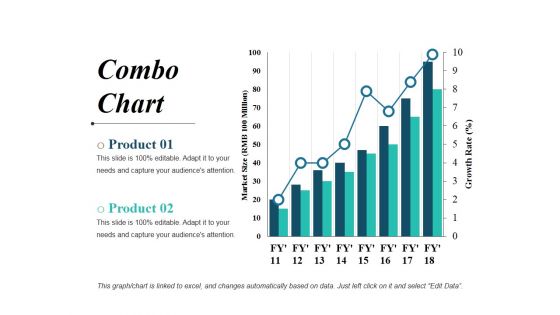
Combo Chart Ppt PowerPoint Presentation File Visual Aids
This is a combo chart ppt powerpoint presentation file visual aids. This is a two stage process. The stages in this process are bar graph, business, marketing, finance, planning.
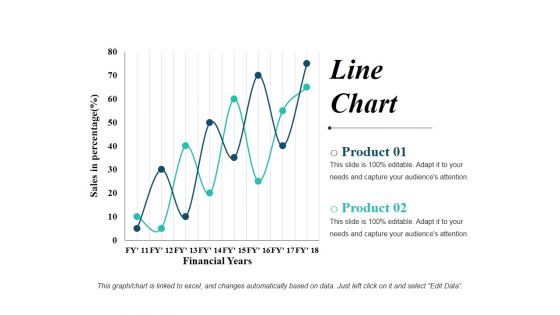
Line Chart Ppt PowerPoint Presentation Show Graphics Design
This is a line chart ppt powerpoint presentation show graphics design. This is a two stage process. The stages in this process are line graph, business, marketing, finance, planning.
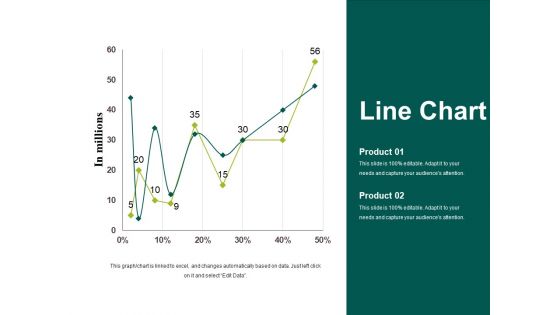
Line Chart Template 1 Ppt PowerPoint Presentation Styles Graphics Tutorials
This is a line chart template 1 ppt powerpoint presentation styles graphics tutorials. This is a two stage process. The stages in this process are in millions, business, marketing, strategy, graph.
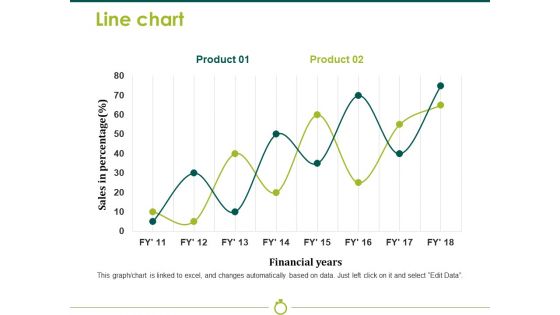
Line Chart Template 2 Ppt PowerPoint Presentation Model Background Image
This is a line chart template 2 ppt powerpoint presentation model background image. This is a two stage process. The stages in this process are sales in percentage, financial years, business, marketing, strategy, graph.
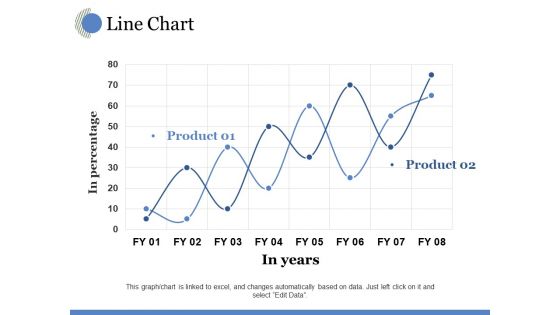
Line Chart Ppt PowerPoint Presentation Model Visual Aids
This is a line chart ppt powerpoint presentation model visual aids. This is a two stage process. The stages in this process are in years, in percentage, growth, business, marketing.

Line Chart Ppt PowerPoint Presentation Gallery Example Topics
This is a line chart ppt powerpoint presentation gallery example topics. This is a two stage process. The stages in this process are in millions, business, marketing, strategy, graph.
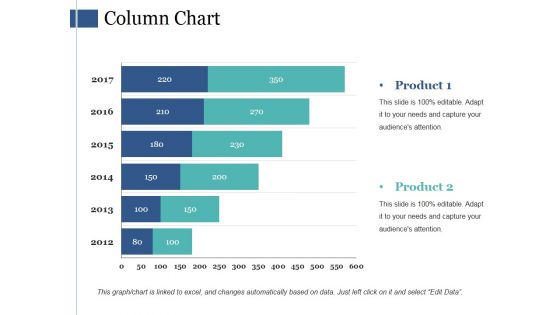
Column Chart Ppt PowerPoint Presentation Model Background Images
This is a column chart ppt powerpoint presentation model background images. This is a six stage process. The stages in this process are bar graph, marketing, finance, strategy, planning.
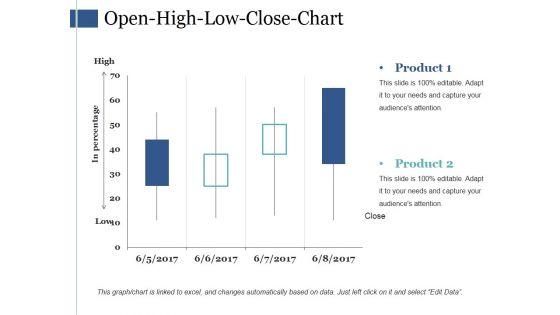
Open High Low Close Chart Ppt PowerPoint Presentation Styles Example
This is a open high low close chart ppt powerpoint presentation styles example. This is a four stage process. The stages in this process are business, marketing, finance, strategy, planning.
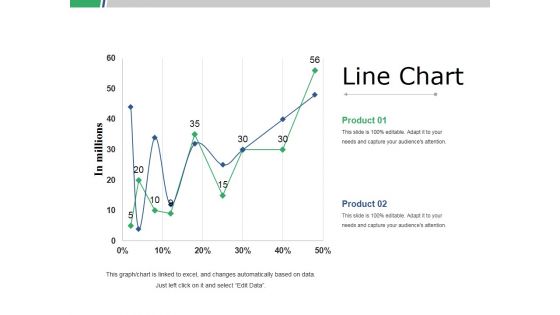
Line Chart Ppt PowerPoint Presentation Slides Graphics Template
This is a line chart ppt powerpoint presentation slides graphics template. This is a two stage process. The stages in this process are business, marketing, strategy, line graph, finance.
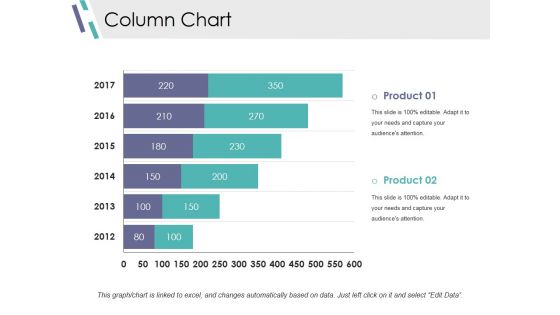
Column Chart Ppt PowerPoint Presentation Infographics Design Inspiration
This is a column chart ppt powerpoint presentation infographics design inspiration. This is a two stage process. The stages in this process are slide bar, marketing, strategy, finance, planning.
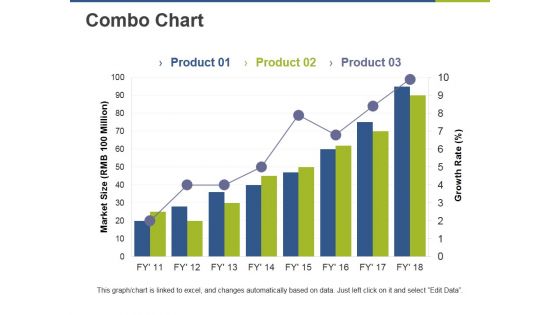
Combo Chart Ppt PowerPoint Presentation Pictures Graphic Images
This is a combo chart ppt powerpoint presentation pictures graphic images. This is a three stage process. The stages in this process are bar graph, growth, market size, growth rate, success.
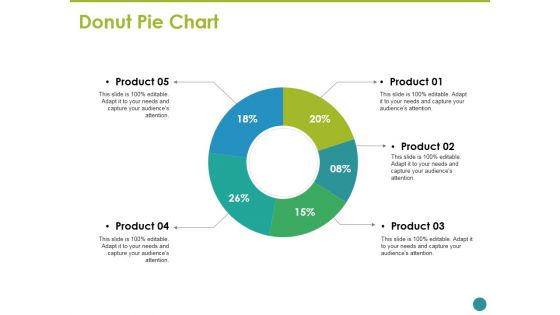
Donut Pie Chart Ppt PowerPoint Presentation Inspiration Graphic Images
This is a donut pie chart ppt powerpoint presentation inspiration graphic images. This is a five stage process. The stages in this process are business, marketing, strategy, planning, donut.
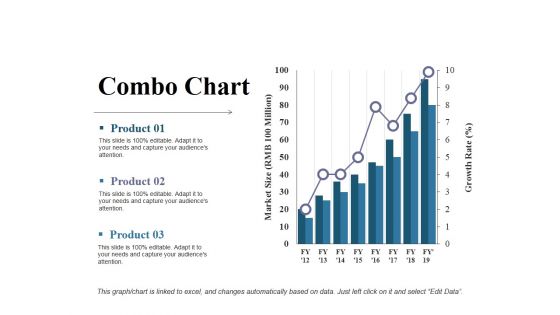
Combo Chart Ppt PowerPoint Presentation Styles Example Introduction
This is a combo chart ppt powerpoint presentation styles example introduction. This is a three stage process. The stages in this process are product, growth rate, market size, growth, success.
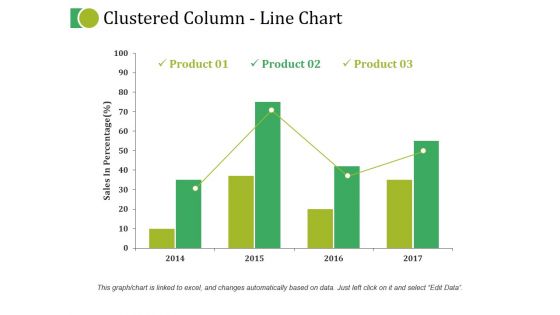
Clustered Column Line Chart Ppt PowerPoint Presentation Inspiration Graphics Pictures
This is a clustered column line chart ppt powerpoint presentation inspiration graphics pictures. This is a four stage process. The stages in this process are business, marketing, strategy, planning, finance.
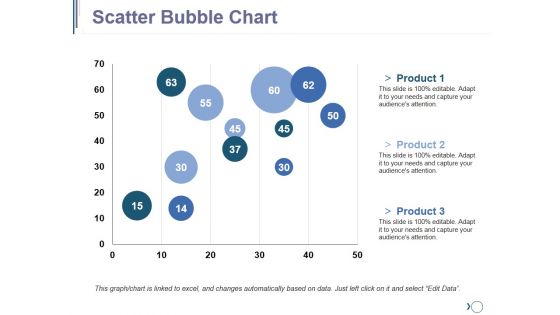
Scatter Bubble Chart Ppt PowerPoint Presentation Outline Graphics Pictures
This is a scatter bubble chart ppt powerpoint presentation outline graphics pictures. This is a three stage process. The stages in this process are finance, planning, business, marketing, strategy.
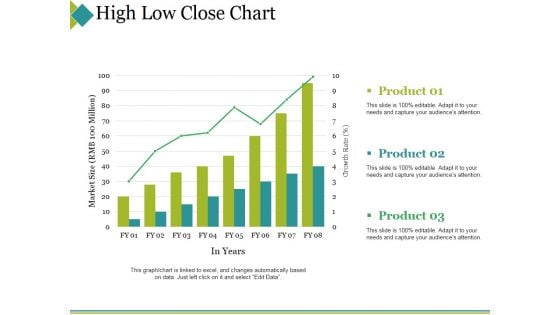
High Low Close Chart Ppt PowerPoint Presentation Portfolio Topics
This is a high low close chart ppt powerpoint presentation portfolio topics. This is a three stage process. The stages in this process are product, market size, in years, success, bar graph.
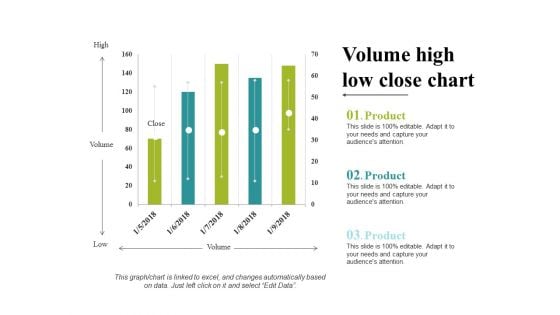
Volume High Low Close Chart Ppt PowerPoint Presentation Portfolio Clipart
This is a volume high low close chart ppt powerpoint presentation portfolio clipart. This is a five stage process. The stages in this process are business, marketing, strategy, planning, finance.
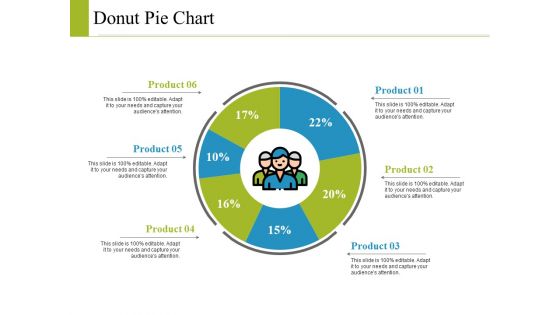
Donut Pie Chart Ppt PowerPoint Presentation Model Graphics Example
This is a donut pie chart ppt powerpoint presentation model graphics example. This is a six stage process. The stages in this process are business, marketing, strategy, planning, finance.
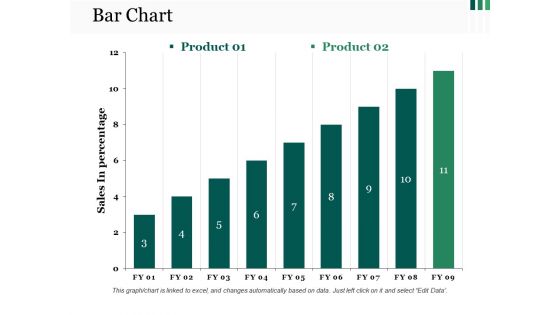
Bar Chart Ppt PowerPoint Presentation Show Format Ideas
This is a bar chart ppt powerpoint presentation show format ideas. This is a two stage process. The stages in this process are bar graph, growth, success, business, marketing.
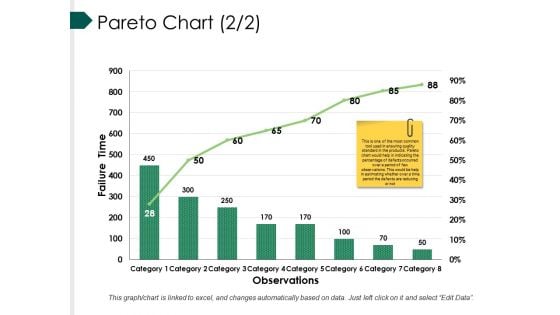
Pareto Chart Template Ppt PowerPoint Presentation Summary Graphic Images
This is a pareto chart template ppt powerpoint presentation summary graphic images. This is a eight stage process. The stages in this process are bar, marketing, strategy, finance, teamwork.
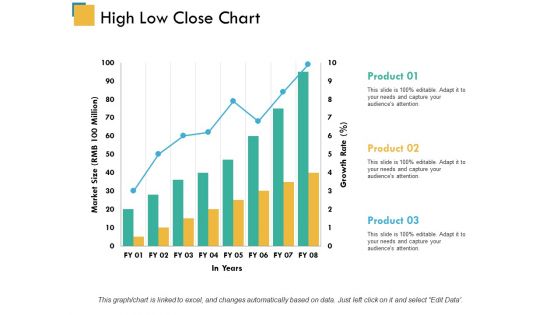
High Low Close Chart Ppt PowerPoint Presentation Model Inspiration
This is a high low close chart ppt powerpoint presentation model inspiration. This is a three stage process. The stages in this process are product, market size, in years.
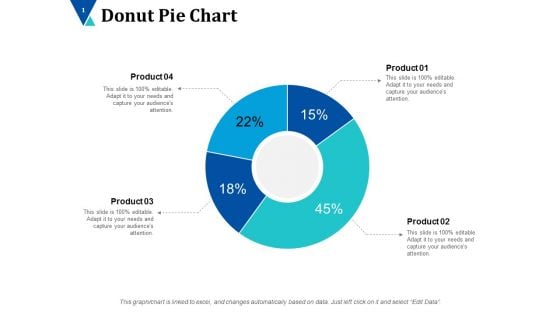
Donut Pie Chart Ppt PowerPoint Presentation Inspiration Designs Download
This is a donut pie chart ppt powerpoint presentation inspiration designs download. This is a four stage process. The stages in this process are donut, business, planning, marketing, finance.
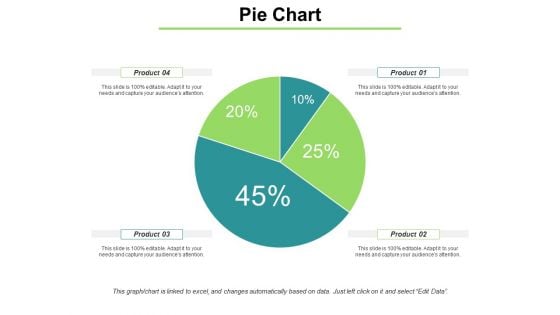
Pie Chart With Distrubation Ppt PowerPoint Presentation Model Ideas
This is a pie chart with distrubation ppt powerpoint presentation model ideas. This is a four stage process. The stages in this process are pie, finance, marketing, strategy, planning.
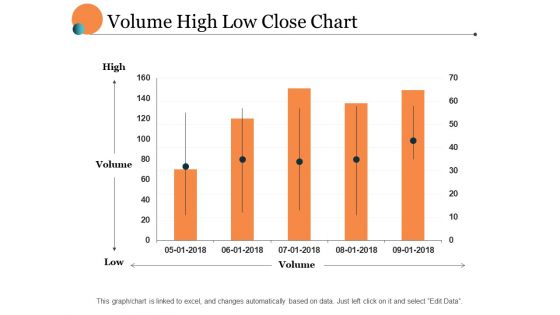
Volume High Low Close Chart Ppt PowerPoint Presentation Portfolio Layout
This is a volume high low close chart ppt powerpoint presentation portfolio layout. This is a five stage process. The stages in this process are finance, marketing, management, investment, analysis.
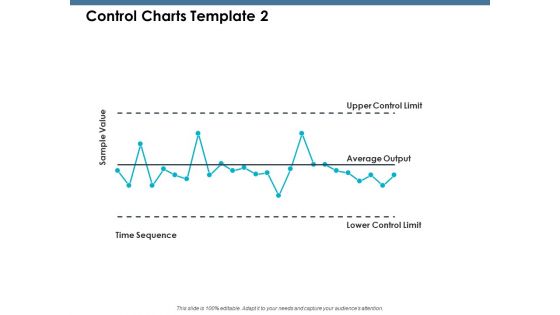
Control Charts Sample Value Ppt PowerPoint Presentation Infographics Demonstration
This is a control charts sample value ppt powerpoint presentation infographics demonstration. This is a five stage process. The stages in this process are product, percentage, marketing, business, management.

 Home
Home