Floor Plan
QA Process Framework For Manufacturing Firms Download PDF
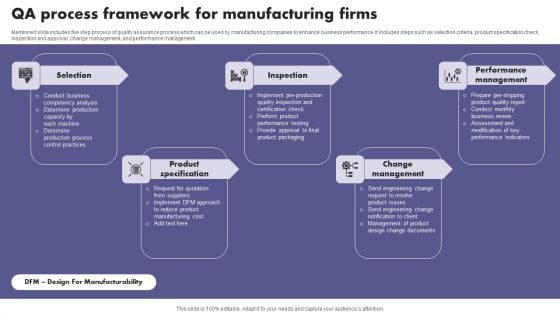
Mentioned slide includes five step process of quality assurance process which can be used by manufacturing companies to enhance business performance. It includes steps such as selection criteria, product specification check, inspection and approval, change management, and performance management. Persuade your audience using this QA Process Framework For Manufacturing Firms Download PDF. This PPT design covers five stages, thus making it a great tool to use. It also caters to a variety of topics including Product Specification, Inspection, Change Management. Download this PPT design now to present a convincing pitch that not only emphasizes the topic but also showcases your presentation skills.
PowerPoint Themes Circular Chart With Globe Ppt Backgrounds
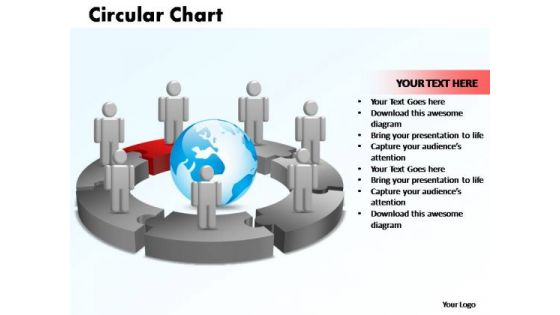
PowerPoint Themes Circular Chart With Globe PPT Backgrounds-The Circle of Life - a concept emmbedded in our minds and hence easy to comprehend. Life and Business is made up of processes comprising stages that flow from one to another. An excellent graphic to attract the attention of and understanding by your audience to improve earnings.-PowerPoint Themes Circular Chart With Globe PPT Backgrounds Bid for it with our PowerPoint Themes Circular Chart With Globe Ppt Backgrounds. Good returns will definitely ensue.
PowerPoint Themes Circular Chart With Globe Ppt Design
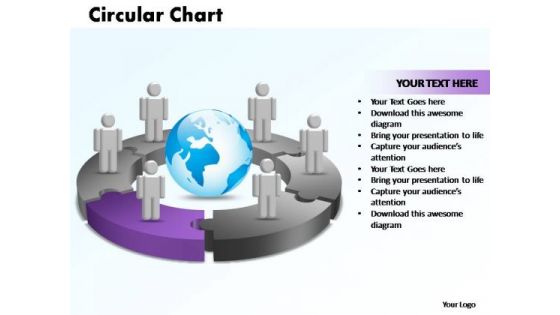
PowerPoint Themes Circular Chart With Globe PPT Design-The Circle of Life - a concept emmbedded in our minds and hence easy to comprehend. Life and Business is made up of processes comprising stages that flow from one to another. An excellent graphic to attract the attention of and understanding by your audience to improve earnings.-PowerPoint Themes Circular Chart With Globe PPT Design Your thoughts are creating an explosion of ideas. Control the consequences with our PowerPoint Themes Circular Chart With Globe Ppt Design.
PowerPoint Themes Circular Chart With Globe Ppt Designs
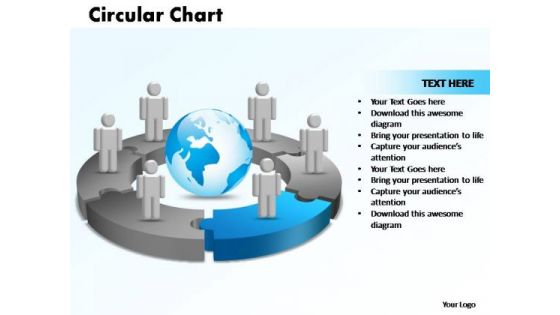
PowerPoint Themes Circular Chart With Globe PPT Designs-The Circle of Life - a concept emmbedded in our minds and hence easy to comprehend. Life and Business is made up of processes comprising stages that flow from one to another. An excellent graphic to attract the attention of and understanding by your audience to improve earnings.-PowerPoint Themes Circular Chart With Globe PPT Designs Our PowerPoint Themes Circular Chart With Globe Ppt Designs exist in abundance. They believe in giving you ample oppurtunities.
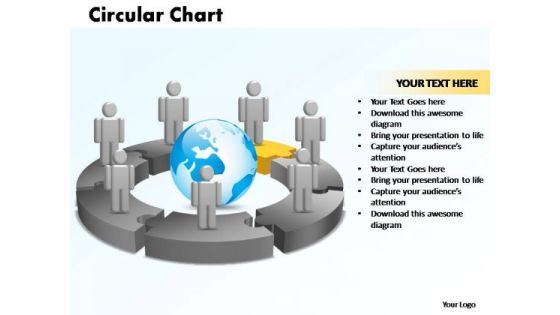
PowerPoint Themes Circular Chart With Globe Ppt Layout
PowerPoint Themes Circular Chart With Globe PPT Layout-The Circle of Life - a concept emmbedded in our minds and hence easy to comprehend. Life and Business is made up of processes comprising stages that flow from one to another. An excellent graphic to attract the attention of and understanding by your audience to improve earnings.-PowerPoint Themes Circular Chart With Globe PPT Layout Double your growth with our PowerPoint Themes Circular Chart With Globe Ppt Layout. Download without worries with our money back guaranteee.
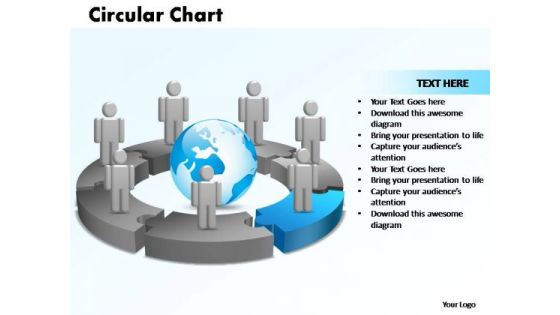
PowerPoint Themes Circular Chart With Globe Ppt Presentation
PowerPoint Themes Circular Chart With Globe PPT Presentation-The Circle of Life - a concept emmbedded in our minds and hence easy to comprehend. Life and Business is made up of processes comprising stages that flow from one to another. An excellent graphic to attract the attention of and understanding by your audience to improve earnings.-PowerPoint Themes Circular Chart With Globe PPT Presentation Cross continents with our PowerPoint Themes Circular Chart With Globe Ppt Presentation. Your thoughts will cover the earth.
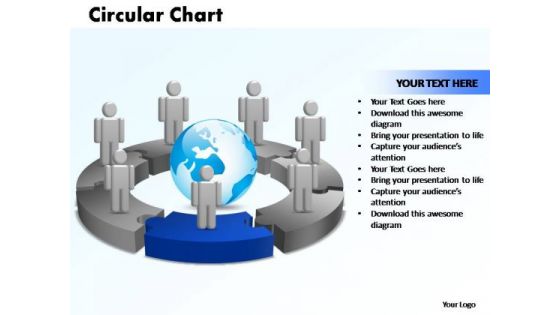
PowerPoint Themes Circular Chart With Globe Ppt Presentation Designs
PowerPoint Themes Circular Chart With Globe PPT Presentation Designs-The Circle of Life - a concept emmbedded in our minds and hence easy to comprehend. Life and Business is made up of processes comprising stages that flow from one to another. An excellent graphic to attract the attention of and understanding by your audience to improve earnings.-PowerPoint Themes Circular Chart With Globe PPT Presentation Designs Amity assists in cementing bonds. Advocate it with our PowerPoint Themes Circular Chart With Globe Ppt Presentation Designs.
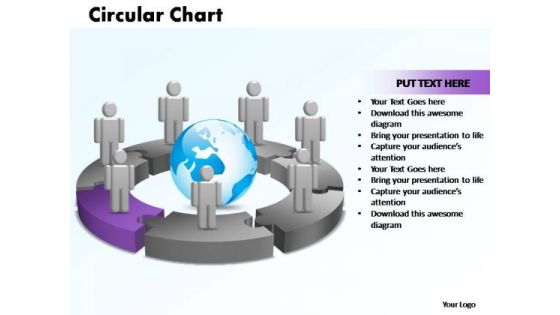
PowerPoint Themes Circular Chart With Globe Ppt Process
PowerPoint Themes Circular Chart With Globe PPT Process-The Circle of Life - a concept emmbedded in our minds and hence easy to comprehend. Life and Business is made up of processes comprising stages that flow from one to another. An excellent graphic to attract the attention of and understanding by your audience to improve earnings.-PowerPoint Themes Circular Chart With Globe PPT Process Our PowerPoint Themes Circular Chart With Globe Ppt Process are exceptionally adaptive. They will blend in with any scenario.
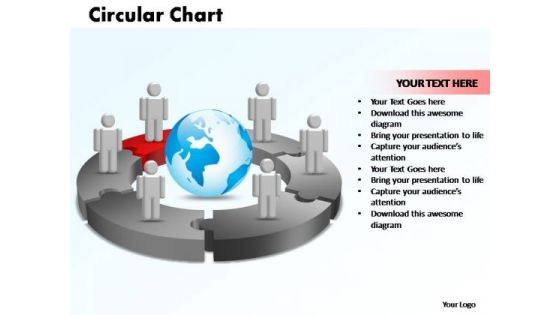
PowerPoint Themes Circular Chart With Globe Ppt Slide
PowerPoint Themes Circular Chart With Globe PPT Slide-The Circle of Life - a concept emmbedded in our minds and hence easy to comprehend. Life and Business is made up of processes comprising stages that flow from one to another. An excellent graphic to attract the attention of and understanding by your audience to improve earnings.-PowerPoint Themes Circular Chart With Globe PPT Slide Make unique presentations with our PowerPoint Themes Circular Chart With Globe Ppt Slide. You'll always stay ahead of the game.
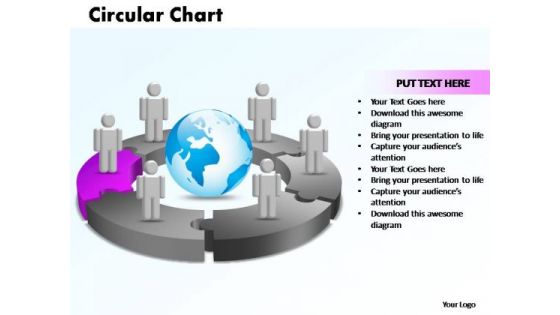
PowerPoint Themes Circular Chart With Globe Ppt Slides
PowerPoint Themes Circular Chart With Globe PPT Slides-The Circle of Life - a concept emmbedded in our minds and hence easy to comprehend. Life and Business is made up of processes comprising stages that flow from one to another. An excellent graphic to attract the attention of and understanding by your audience to improve earnings.-PowerPoint Themes Circular Chart With Globe PPT Slides Convert customers with our PowerPoint Themes Circular Chart With Globe Ppt Slides. Download without worries with our money back guaranteee.
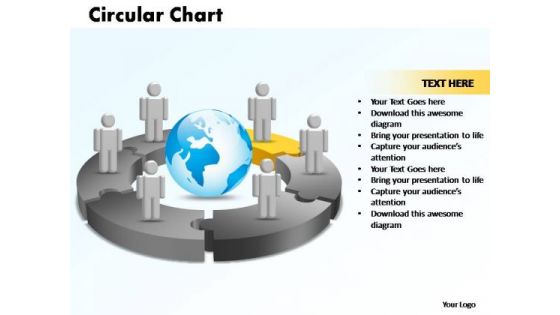
PowerPoint Themes Circular Chart With Globe Ppt Template
PowerPoint Themes Circular Chart With Globe PPT Template-The Circle of Life - a concept emmbedded in our minds and hence easy to comprehend. Life and Business is made up of processes comprising stages that flow from one to another. An excellent graphic to attract the attention of and understanding by your audience to improve earnings.-PowerPoint Themes Circular Chart With Globe PPT Template Convincing others can be an exacting business. Address their doubts with our PowerPoint Themes Circular Chart With Globe Ppt Template.
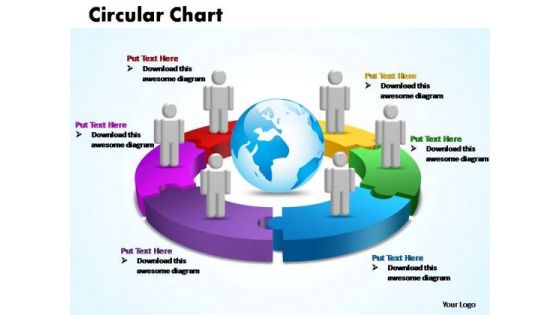
PowerPoint Themes Circular Chart With Globe Ppt Templates
PowerPoint Themes Circular Chart With Globe PPT Templates-The Circle of Life - a concept emmbedded in our minds and hence easy to comprehend. Life and Business is made up of processes comprising stages that flow from one to another. An excellent graphic to attract the attention of and understanding by your audience to improve earnings.-PowerPoint Themes Circular Chart With Globe PPT Templates Experience the striking graphics of our PowerPoint Themes Circular Chart With Globe Ppt Templates. They bring good quality to the table.
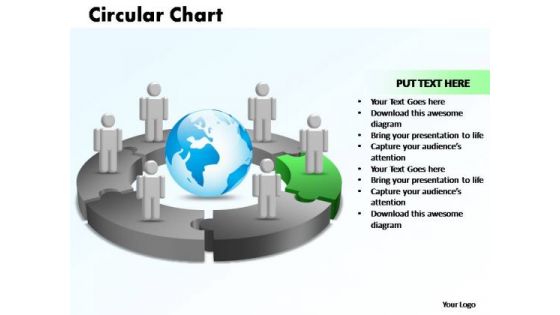
PowerPoint Themes Circular Chart With Globe Ppt Theme
PowerPoint Themes Circular Chart With Globe PPT Theme-The Circle of Life - a concept emmbedded in our minds and hence easy to comprehend. Life and Business is made up of processes comprising stages that flow from one to another. An excellent graphic to attract the attention of and understanding by your audience to improve earnings.-PowerPoint Themes Circular Chart With Globe PPT Theme Beat the budget with our PowerPoint Themes Circular Chart With Globe Ppt Theme. Have enough to spare in the end.
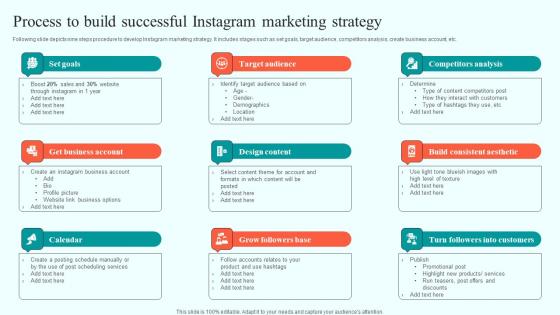
Process To Build Successful Instagram Online Advertising Solutions Information Pdf
Following slide depicts nine steps procedure to develop Instagram marketing strategy. It includes stages such as set goals, target audience, competitors analysis, create business account, etc. Slidegeeks has constructed Process To Build Successful Instagram Online Advertising Solutions Information Pdf after conducting extensive research and examination. These presentation templates are constantly being generated and modified based on user preferences and critiques from editors. Here, you will find the most attractive templates for a range of purposes while taking into account ratings and remarks from users regarding the content. This is an excellent jumping-off point to explore our content and will give new users an insight into our top-notch PowerPoint Templates. Following slide depicts nine steps procedure to develop Instagram marketing strategy. It includes stages such as set goals, target audience, competitors analysis, create business account, etc.
Consulting Slides Business Chart With Icons Business Presentation
This PPT diagram is a simple template that provides a graphical, time-phased overview of a continuing sequence of stages, tasks. This is an effective way of displaying information you can edit text, color, shade and style as per you need.
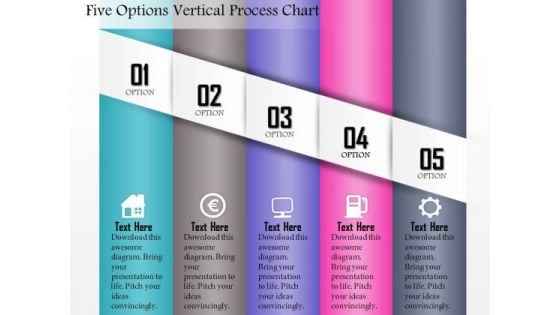
Business Diagram Five Options Vertical Process Chart Presentation Template
The diagram offers an excellent background to build up the various stages of your business process. Give them an overview of your capability and insight into the minute details of the overall picture highlighting the interdependence at every operational level.
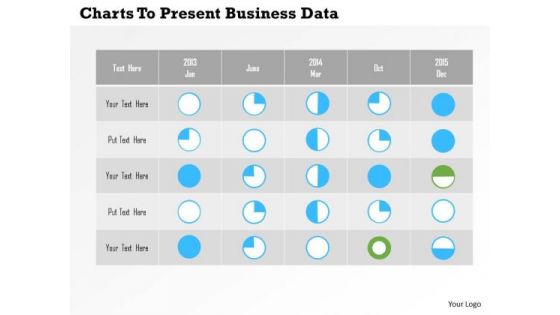
Business Diagram Charts To Present Business Data PowerPoint Templates
Table of pie graphs has been used in this power point diagram. This business diagram contains the concept of result analysis. The template offers an excellent background to build up the various stages of your business process.

Evaluating Performance Organization Chart Ppt Design Templates PDF
Presenting evaluating performance organization chart ppt design templates pdf to provide visual cues and insights. Share and navigate important information on four stages that need your due attention. This template can be used to pitch topics like organization chart, designation, position. In addtion, this PPT design contains high-resolution images, graphics, etc, that are easily editable and available for immediate download.
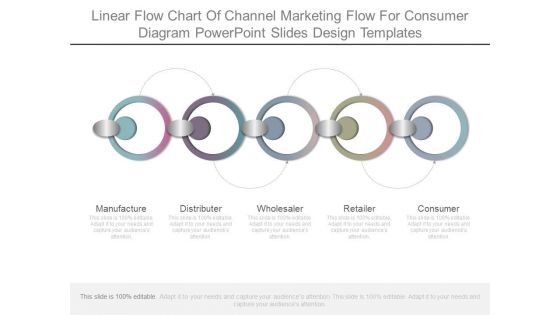
Linear Flow Chart Of Channel Marketing Flow For Consumer Diagram Powerpoint Slides Design Templates
This is a linear flow chart of channel marketing flow for consumer diagram powerpoint slides design templates. This is a five stage process. The stages in this process are manufacture, distributor, wholesaler, retailer, consumer.
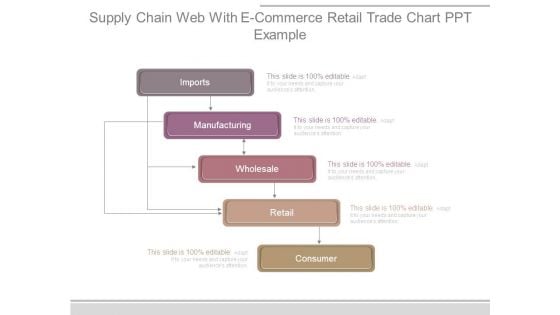
Supply Chain Web With E Commerce Retail Trade Chart Ppt Example
This is a supply chain web with e commerce retail trade chart ppt example. This is a five stage process. The stages in this process are imports, manufacturing, wholesale, retail, consumer.
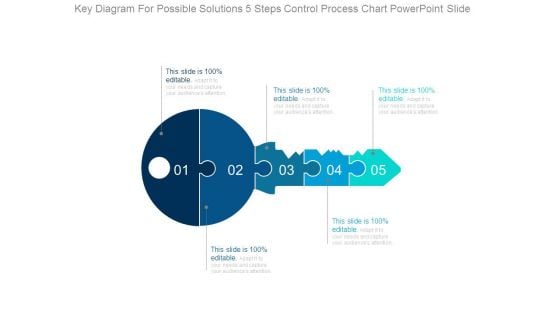
Key Diagram For Possible Solutions 5 Steps Control Process Chart Powerpoint Slide
This is a key diagram for possible solutions 5 steps control process chart powerpoint slide. This is a five stage process. The stages in this process are puzzles, business, problem, solution, game pieces, key.
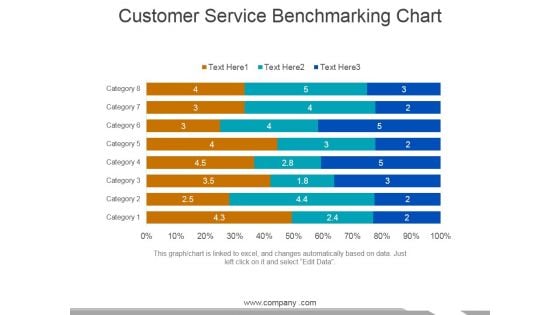
Customer Service Benchmarking Chart Ppt PowerPoint Presentation Infographic Template Graphics Tutorials
This is a customer service benchmarking chart ppt powerpoint presentation infographic template graphics tutorials. This is a eight stage process. The stages in this process are category, business, marketing, management.
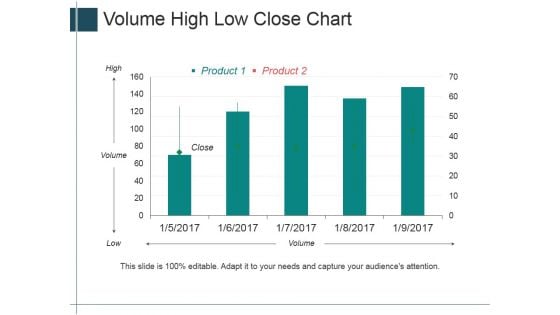
Volume High Low Close Chart Ppt PowerPoint Presentation Summary Layout Ideas
This is a volume high low close chart ppt powerpoint presentation summary layout ideas. This is a five stage process. The stages in this process are high, volume, low, close, product.
Competitive Analysis Template 6 Scatter Chart Ppt PowerPoint Presentation Icon Example Topics
This is a competitive analysis template 6 scatter chart ppt powerpoint presentation icon example topics. This is a eight stage process. The stages in this process are users interface, data import, example, pricing, support, update, tutorials, easy to use.

Process Mapping Flow Charting Ppt PowerPoint Presentation Infographic Template Graphics Pictures
This is a process mapping flow charting ppt powerpoint presentation infographic template graphics pictures. This is a five stage process. The stages in this process are start, end, business, marketing, management.
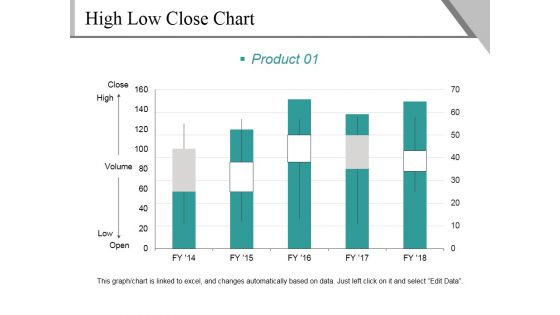
High Low Close Chart Template 1 Ppt PowerPoint Presentation Infographics Graphics Design
This is a high low close chart template 1 ppt powerpoint presentation infographics graphics design. This is a five stage process. The stages in this process are close, high, volume, low, open, product.
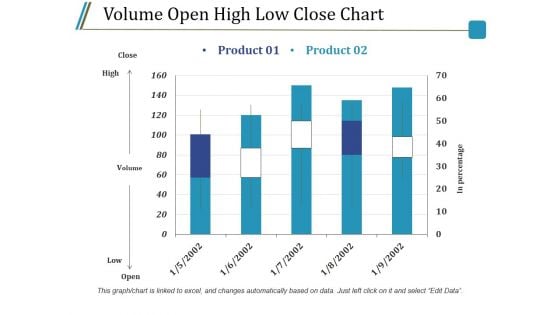
Volume Open High Low Close Chart Ppt PowerPoint Presentation Infographics Guide
This is a volume open high low close chart ppt powerpoint presentation infographics guide. This is a two stage process. The stages in this process are close, high, volume, low, open, product.
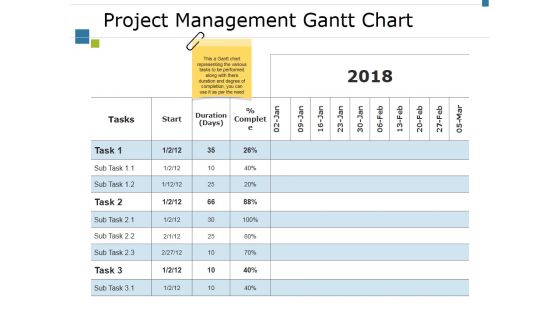
Project Management Gantt Chart Template 2 Ppt PowerPoint Presentation Pictures Outfit
This is a project management gantt chart template 2 ppt powerpoint presentation pictures outfit. This is a three stage process. The stages in this process are start, duration, task, complete, sub task.
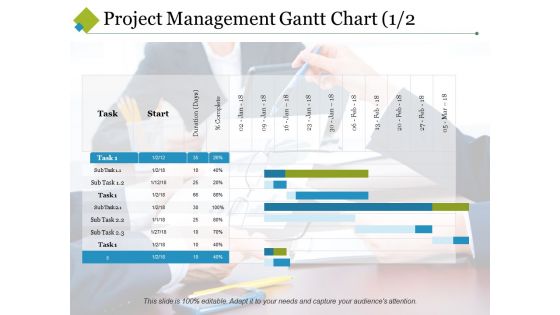
Project Management Gantt Chart Template 1 Ppt PowerPoint Presentation Visual Aids Summary
This is a project management gantt chart template 1 ppt powerpoint presentation visual aids summary. This is a two stage process. The stages in this process are start, task, sub task, duration, complete.
Volume Open High Low Close Chart Ppt PowerPoint Presentation Icon Design Inspiration
This is a volume open high low close chart ppt powerpoint presentation icon design inspiration. This is a three stage process. The stages in this process are close, high, low, volume, open.
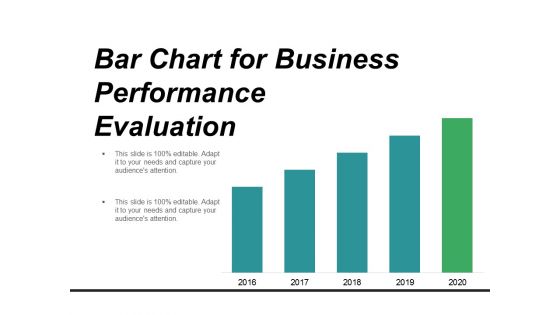
Bar Chart For Business Performance Evaluation Ppt PowerPoint Presentation Infographics Professional
This is a bar chart for business performance evaluation ppt powerpoint presentation infographics professional. This is a five stage process. The stages in this process are metrics icon, kpis icon, statistics icon.
Chart With Magnifying Glass For Business Research Ppt PowerPoint Presentation Inspiration Shapes
This is a chart with magnifying glass for business research ppt powerpoint presentation inspiration shapes. This is a two stage process. The stages in this process are metrics icon, kpis icon, statistics icon.
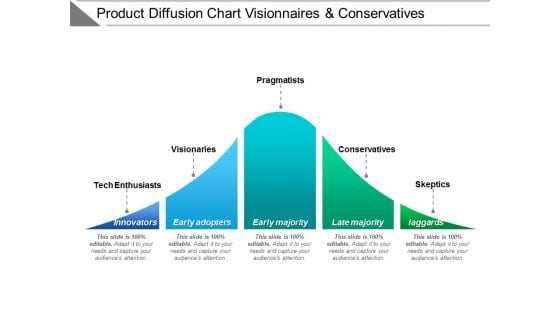
Product Diffusion Chart Visionaries And Conservatives Ppt PowerPoint Presentation Model Clipart
This is a product diffusion chart visionaries and conservatives ppt powerpoint presentation model clipart. This is a five stage process. The stages in this process are adoption curve, crossing the chasm, hype cycle.
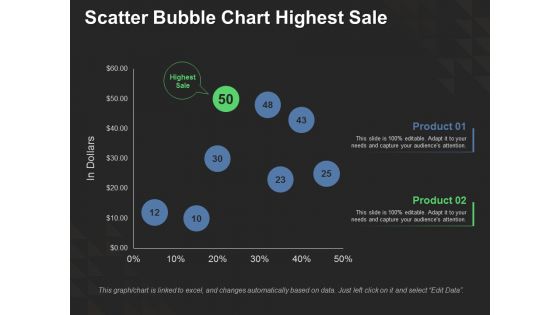
Scatter Bubble Chart Highest Sale Ppt PowerPoint Presentation Show Slide Download
This is a scatter bubble chart highest sale ppt powerpoint presentation show slide download. This is a two stage process. The stages in this process are finance, investment, analysis, business, marketing.
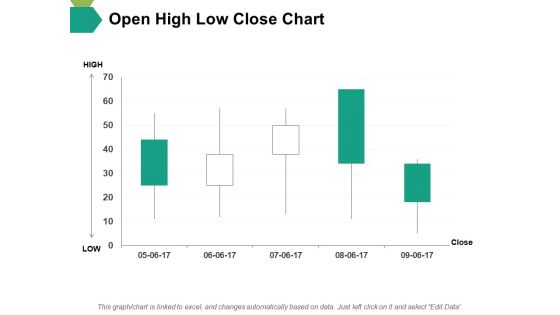
Open High Low Close Chart Ppt PowerPoint Presentation Slides File Formats
This is a open high low close chart ppt powerpoint presentation slides file formats. This is a five stage process. The stages in this process are open, high, low, close, finance.
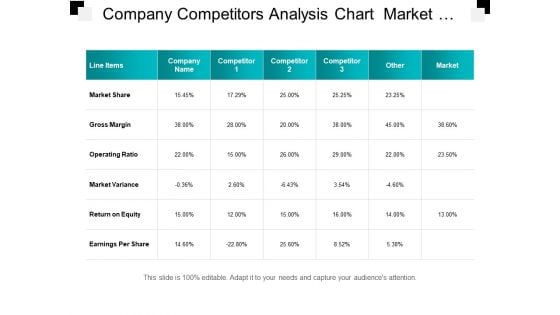
Company Competitors Analysis Chart Market Share And Return On Equity Ppt PowerPoint Presentation Picture
This is a company competitors analysis chart market share and return on equity ppt powerpoint presentation picture. This is a seven stage process. The stages in this process are competitive analysis, benchmark competition, competition landscape.
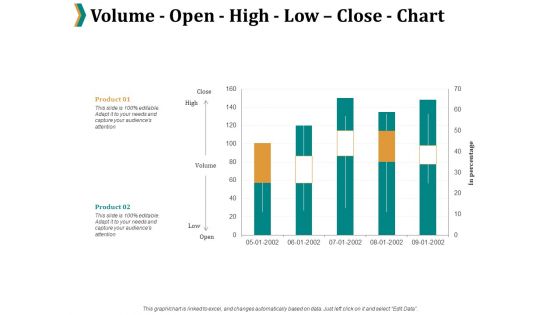
Volume Open High Low Close Chart Ppt PowerPoint Presentation Professional Maker
This is a volume open high low close chart ppt powerpoint presentation professional maker. This is a two stage process. The stages in this process are percentage, product, marketing.
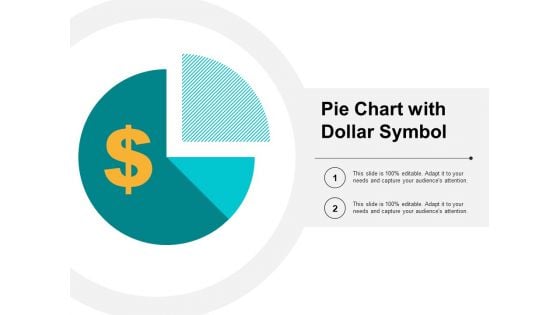
Pie Chart With Dollar Symbol Ppt PowerPoint Presentation Infographic Template Graphics Design
This is a pie chart with dollar symbol ppt powerpoint presentation infographic template graphics design. This is a two stage process. The stages in this process are sectioned circle, segmented circle, partitioned circle.
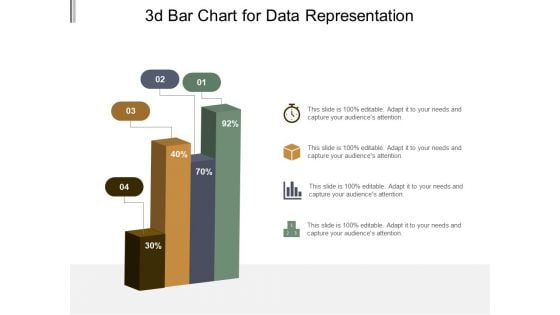
3D Bar Chart For Data Representation Ppt PowerPoint Presentation Model Graphic Tips
This is a 3d bar chart for data representation ppt powerpoint presentation model graphic tips. This is a four stage process. The stages in this process are art, colouring, paint brush.
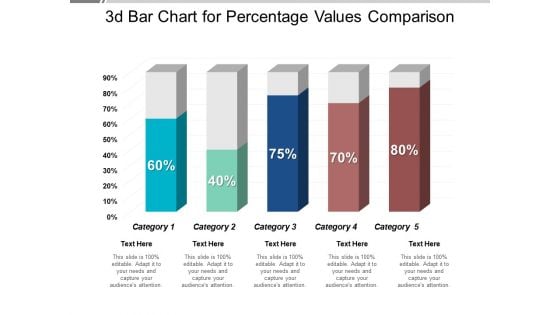
3D Bar Chart For Percentage Values Comparison Ppt PowerPoint Presentation Professional Visual Aids
This is a 3d bar chart for percentage values comparison ppt powerpoint presentation professional visual aids. This is a five stage process. The stages in this process are art, colouring, paint brush.
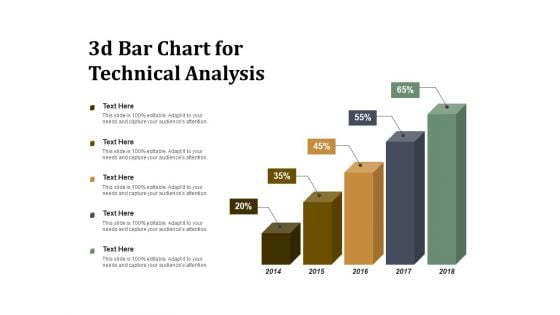
3D Bar Chart For Technical Analysis Ppt PowerPoint Presentation Summary Visuals
This is a 3d bar chart for technical analysis ppt powerpoint presentation summary visuals. This is a five stage process. The stages in this process are art, colouring, paint brush.
3D Bar Chart To Display Data Ppt PowerPoint Presentation Icon Design Inspiration
This is a 3d bar chart to display data ppt powerpoint presentation icon design inspiration. This is a four stage process. The stages in this process are art, colouring, paint brush.
3D Chart For Graphical Display Of Data Ppt PowerPoint Presentation Styles Icon
This is a 3d chart for graphical display of data ppt powerpoint presentation styles icon. This is a four stage process. The stages in this process are art, colouring, paint brush.
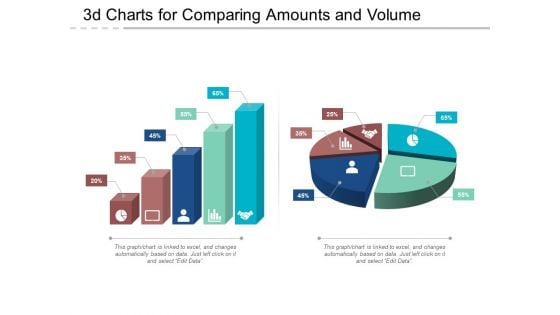
3D Charts For Comparing Amounts And Volume Ppt PowerPoint Presentation Show Deck
This is a 3d charts for comparing amounts and volume ppt powerpoint presentation show deck. This is a five stage process. The stages in this process are art, colouring, paint brush.
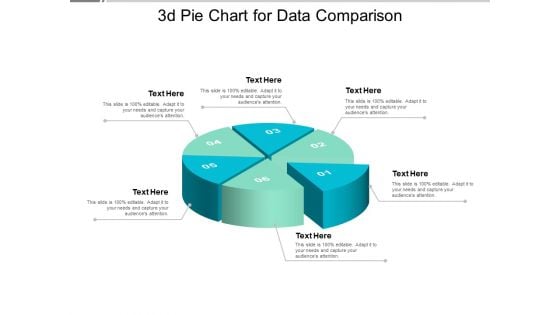
3D Pie Chart For Data Comparison Ppt PowerPoint Presentation Model Design Ideas
This is a 3d pie chart for data comparison ppt powerpoint presentation model design ideas. This is a six stage process. The stages in this process are art, colouring, paint brush.
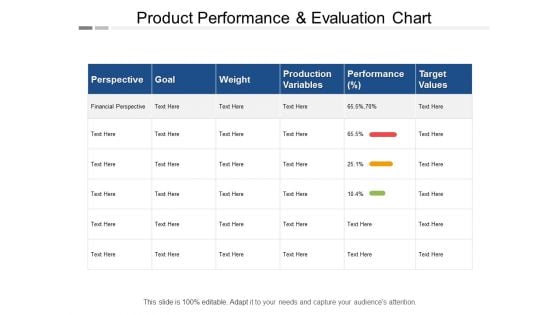
Product Performance And Evaluation Chart Ppt PowerPoint Presentation Pictures Slide Download
This is a product performance and evaluation chart ppt powerpoint presentation pictures slide download. This is a sex stage process. The stages in this process are production management, production performance, production improvement.
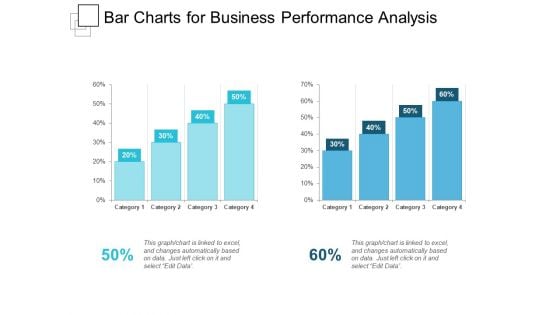
Bar Charts For Business Performance Analysis Ppt PowerPoint Presentation Show Slideshow
This is a bar charts for business performance analysis ppt powerpoint presentation show slideshow. This is a two stage process. The stages in this process are compare, comparison of two, competitive analysis.
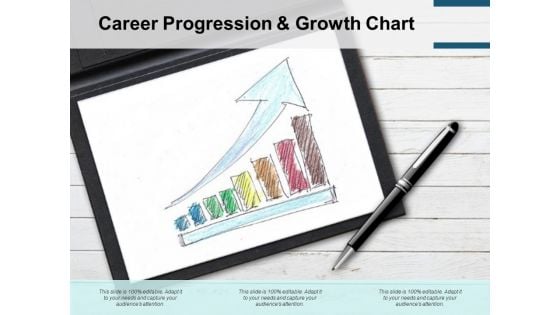
Career Progression And Growth Chart Ppt PowerPoint Presentation Professional Design Inspiration
This is a career progression and growth chart ppt powerpoint presentation professional design inspiration. This is a three stage process. The stages in this process are career progression, career aspiration, career promotion powerpoint presentation slides.
Experimental Control Pie Chart With Dollar Symbol Ppt Powerpoint Presentation Infographics Background Images
This is a experimental control pie chart with dollar symbol ppt powerpoint presentation infographics background images. This is a four stage process. The stages in this process are exploratory, experimental, investigational.
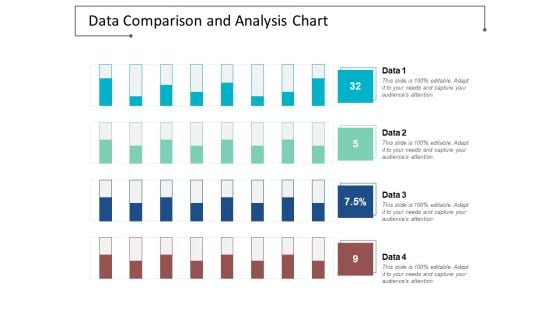
Data Comparison And Analysis Chart Ppt Powerpoint Presentation File Background Images
This is a data comparison and analysis chart ppt powerpoint presentation file background images. This is a four stage process. The stages in this process are data presentation, content presentation, information presentation.
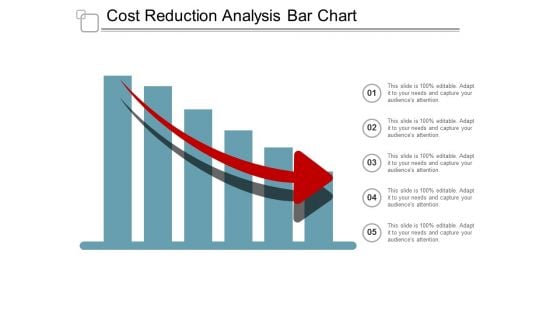
Cost Reduction Analysis Bar Chart Ppt Powerpoint Presentation File Graphics Design
This is a cost reduction analysis bar chart ppt powerpoint presentation file graphics design. This is a five stage process. The stages in this process are data analysis, data science, information science.
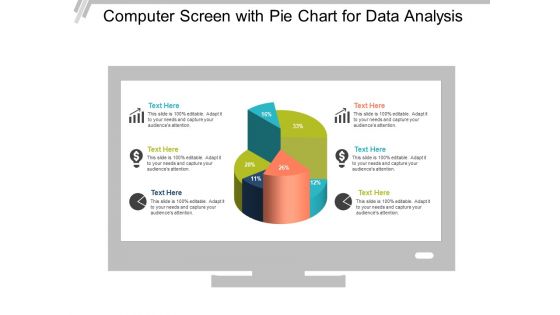
Computer Screen With Pie Chart For Data Analysis Ppt PowerPoint Presentation Show Picture
This is a computer screen with pie chart for data analysis ppt powerpoint presentation show picture. This is a six stage process. The stages in this process are computer icon, desktop icon, laptop screen icon.
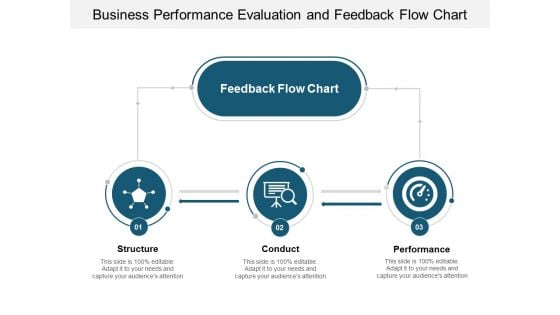
Business Performance Evaluation And Feedback Flow Chart Ppt Powerpoint Presentation Model Example Topics
This is a business performance evaluation and feedback flow chart ppt powerpoint presentation model example topics. This is a three stage process. The stages in this process are performance management, structure conduct performance, performance review and analysis.
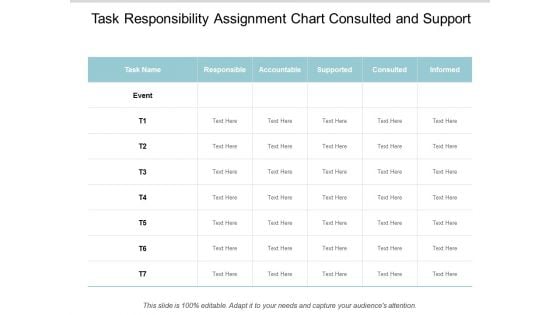
Task Responsibility Assignment Chart Consulted And Support Ppt Powerpoint Presentation Styles Background
This is a task responsibility assignment chart consulted and support ppt powerpoint presentation styles background. This is a seven stage process. The stages in this process are authority matrix, responsibility matrix, leadership matrix.
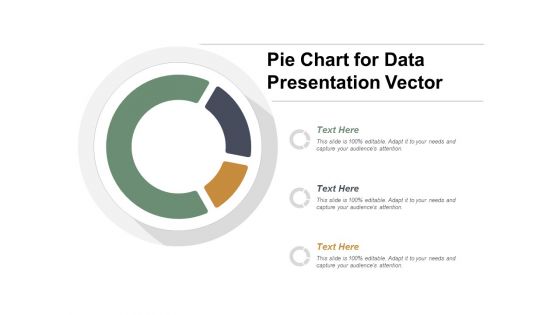
Pie Chart For Data Presentation Vector Ppt Powerpoint Presentation Summary Display
This is a pie chart for data presentation vector ppt powerpoint presentation summary display. This is a three stage process. The stages in this process are data visualization icon, data management icon.
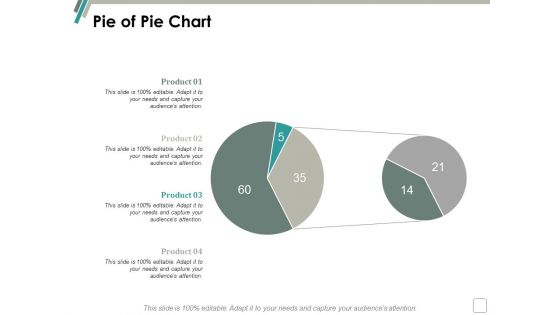
Pie Of Pie Chart Finance Ppt Powerpoint Presentation File Design Templates
This is a pie of pie chart finance ppt powerpoint presentation file design templates. This is a four stage process. The stages in this process are finance, marketing, management, investment, analysis.
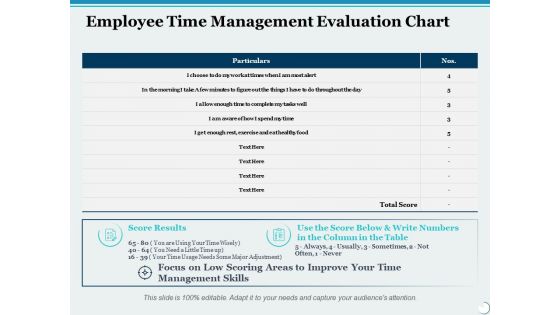
Employee Time Management Evaluation Chart Ppt PowerPoint Presentation File Graphic Images
This is a employee time management evaluation chart ppt powerpoint presentation file graphic images. This is a two stage process. The stages in this process are compare, business, management, marketing.

Bar Chart With Magnifying Glass For Financial Analysis Ppt Powerpoint Presentation Infographics Designs Download
This is a bar chart with magnifying glass for financial analysis ppt powerpoint presentation infographics designs download. This is a three stage process. The stages in this process are business metrics, business kpi, business dashboard.

Business Analysis Data Charts And Reports Ppt Powerpoint Presentation Ideas Portrait
This is a business analysis data charts and reports ppt powerpoint presentation ideas portrait. This is a three stage process. The stages in this process are business metrics, business kpi, business dashboard.
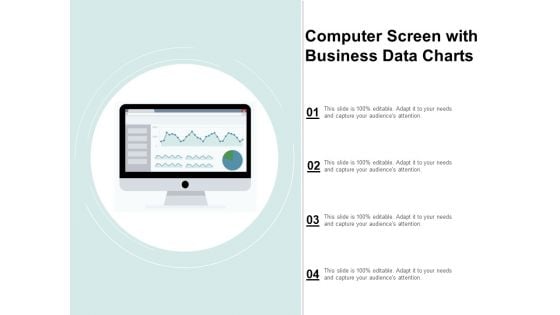
Computer Screen With Business Data Charts Ppt Powerpoint Presentation Show Vector
This is a computer screen with business data charts ppt powerpoint presentation show vector. This is a four stage process. The stages in this process are business metrics, business kpi, business dashboard.


 Continue with Email

 Home
Home


