Forecast Dashboard
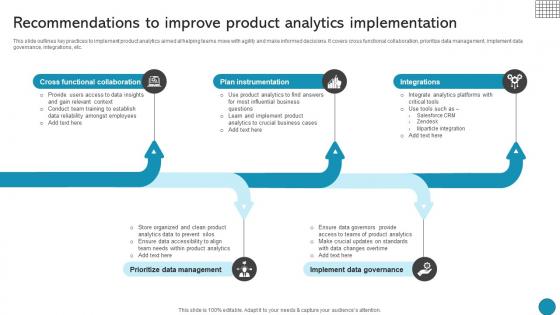
Recommendations To Improve Product Analytics Driving Business Success Integrating Product
This slide outlines key practices to implement product analytics aimed at helping teams move with agility and make informed decisions. It covers cross functional collaboration, prioritize data management, implement data governance, integrations, etc. If your project calls for a presentation, then Slidegeeks is your go-to partner because we have professionally designed, easy-to-edit templates that are perfect for any presentation. After downloading, you can easily edit Recommendations To Improve Product Analytics Driving Business Success Integrating Product and make the changes accordingly. You can rearrange slides or fill them with different images. Check out all the handy templates This slide outlines key practices to implement product analytics aimed at helping teams move with agility and make informed decisions. It covers cross functional collaboration, prioritize data management, implement data governance, integrations, etc.
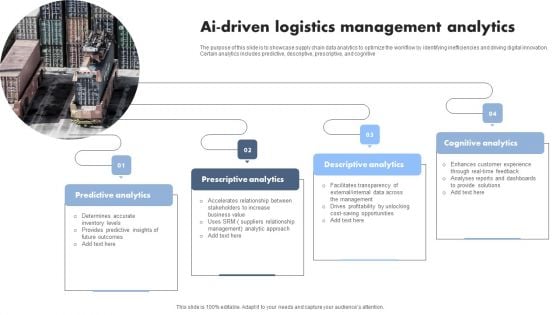
AI Driven Logistics Management Analytics Professional PDF
The purpose of this slide is to showcase supply chain data analytics to optimize the workflow by identifying inefficiencies and driving digital innovation. Certain analytics includes predictive, descriptive, prescriptive, and cognitive. Presenting AI Driven Logistics Management Analytics Professional PDF to dispense important information. This template comprises four stages. It also presents valuable insights into the topics including Predictive Analytics, Prescriptive Analytics, Descriptive Analytics. This is a completely customizable PowerPoint theme that can be put to use immediately. So, download it and address the topic impactfully.
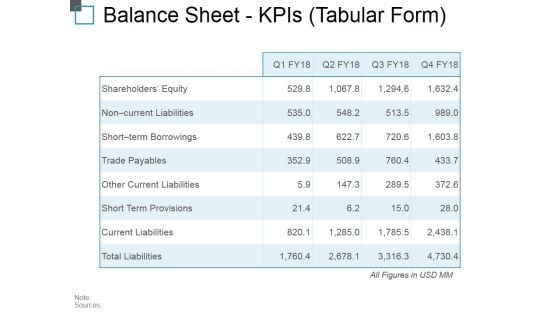
Balance Sheet Kpis Tabular Form Ppt PowerPoint Presentation Outline Background Image
This is a balance sheet kpis tabular form ppt powerpoint presentation outline background image. This is a four stage process. The stages in this process are current assets, current liabilities, total assets, total liabilities.
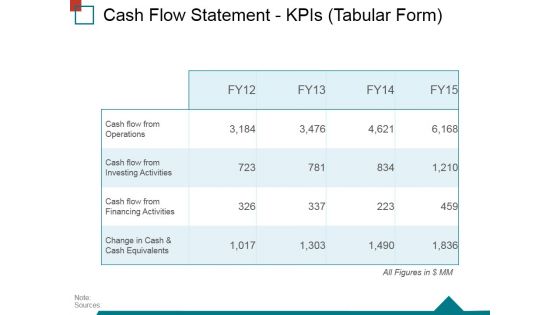
Cash Flow Statement Kpis Tabular Form Ppt PowerPoint Presentation Gallery Good
This is a cash flow statement kpis tabular form ppt powerpoint presentation gallery good. This is a four stage process. The stages in this process are operations, financing activities, investing activities, net increase in cash.

Cash Flow Statement Kpis Tabular Form Ppt PowerPoint Presentation Infographics File Formats
This is a cash flow statement kpis tabular form ppt powerpoint presentation infographics file formats. This is a four stage process. The stages in this process are operations, investing activities, financing activities, net increase in cash.
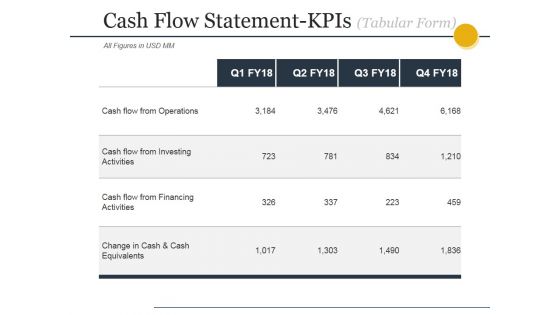
Cash Flow Statement Kpis Tabular Form Ppt PowerPoint Presentation Layouts Grid
This is a cash flow statement kpis tabular form ppt powerpoint presentation layouts grid. This is a four stage process. The stages in this process are operations, financing activities, investing activities, net increase in cash.
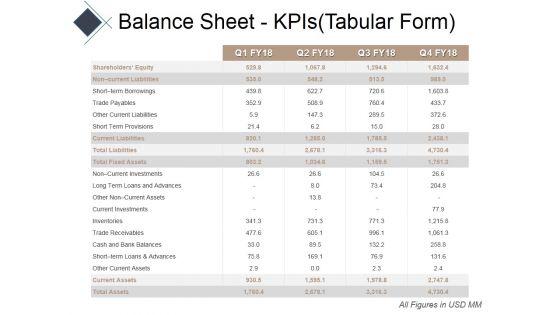
Balance Sheet Kpis Tabular Form Ppt PowerPoint Presentation Show Example Introduction
This is a balance sheet kpis tabular form ppt powerpoint presentation show example introduction. This is a four stage process. The stages in this process are current assets, current liabilities, total assets, total liabilities.
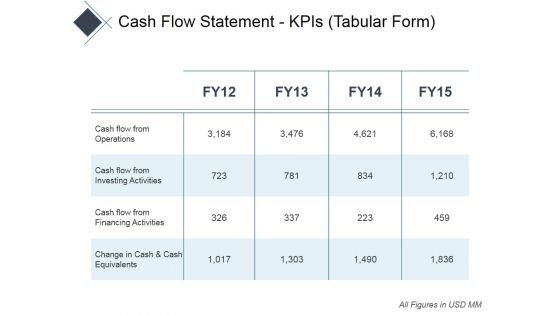
Cash Flow Statement Kpis Tabular Form Ppt PowerPoint Presentation Infographics Professional
This is a cash flow statement kpis tabular form ppt powerpoint presentation infographics professional. This is a four stage process. The stages in this process are operations, financing activities, investing activities, net increase in cash.
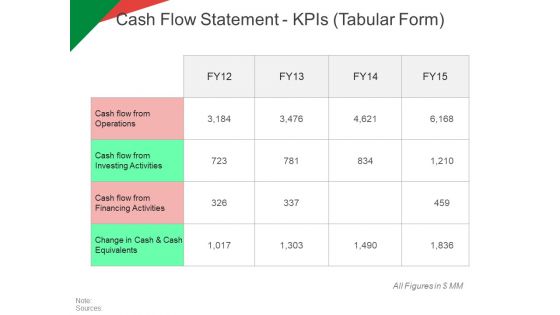
Cash Flow Statement Kpis Tabular Form Ppt PowerPoint Presentation Model Graphic Tips
This is a cash flow statement kpis tabular form ppt powerpoint presentation model graphic tips. This is a four stage process. The stages in this process are operations, investing activities, net increase in cash, financing activities.
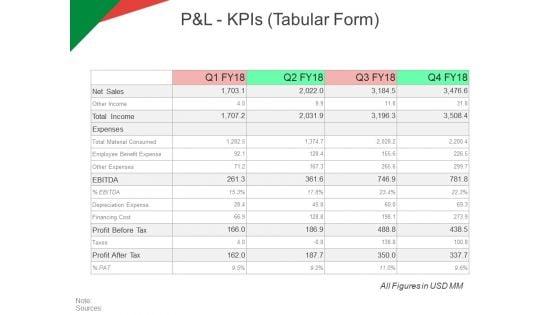
P And L Kpis Tabular Form Ppt PowerPoint Presentation Model Ideas
This is a p and l kpis tabular form ppt powerpoint presentation model ideas. This is a four stage process. The stages in this process are revenue, operating profit, cogs, net profit.
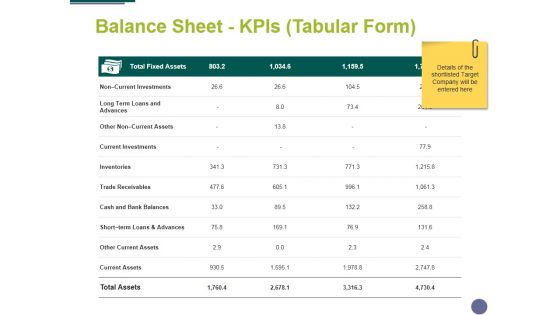
Balance Sheet Kpis Tabular Form Template 2 Ppt PowerPoint Presentation Inspiration Portfolio
This is a balance sheet kpis tabular form template 2 ppt powerpoint presentation inspiration portfolio. This is a four stage process. The stages in this process are business, management, compere, strategy, table.
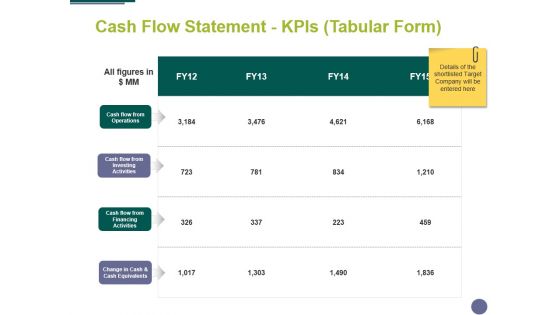
Cash Flow Statement Kpis Tabular Form Ppt PowerPoint Presentation Styles Design Inspiration
This is a cash flow statement kpis tabular form ppt powerpoint presentation styles design inspiration. This is a four stage process. The stages in this process are finance, analysis, management, business, marketing.
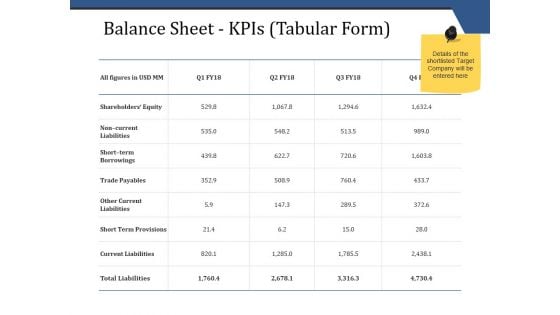
Balance Sheet Kpis Tabular Form Template 1 Ppt PowerPoint Presentation Infographics Picture
This is a balance sheet kpis tabular form template 1 ppt powerpoint presentation infographics picture. This is a four stage process. The stages in this process are business, finance, analysis, investment, strategy.
Balance Sheet Kpis Tabular Form Template 2 Ppt PowerPoint Presentation Icon Clipart
This is a balance sheet kpis tabular form template 2 ppt powerpoint presentation icon clipart. This is a four stage process. The stages in this process are business, finance, analysis, investment, strategy.
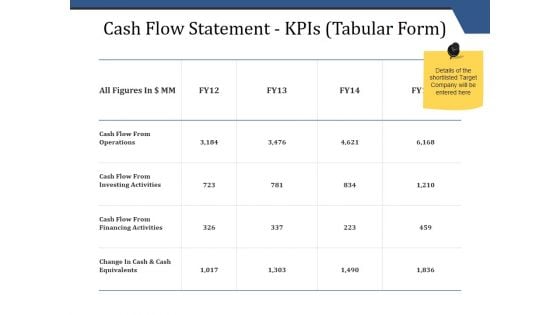
Cash Flow Statement Kpis Tabular Form Ppt PowerPoint Presentation Inspiration Master Slide
This is a cash flow statement kpis tabular form ppt powerpoint presentation inspiration master slide. This is a four stage process. The stages in this process are operations, financing activities, investing activities, net increase in cash.
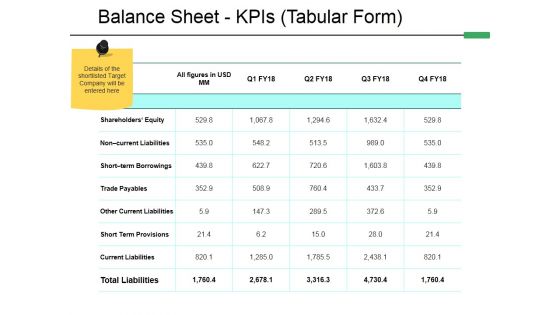
Balance Sheet Kpis Tabular Form Template 1 Ppt PowerPoint Presentation Outline Pictures
This is a balance sheet kpis tabular form template 1 ppt powerpoint presentation outline pictures. This is a five stage process. The stages in this process are compere, business, marketing, table, strategy.
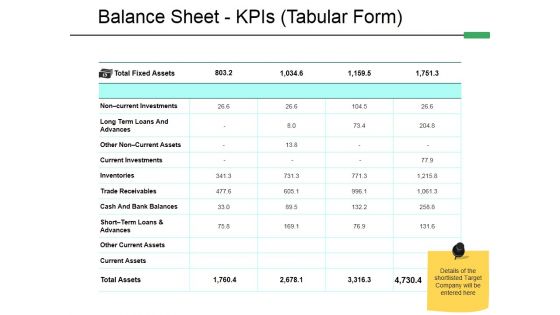
Balance Sheet Kpis Tabular Form Template 2 Ppt PowerPoint Presentation Styles Model
This is a balance sheet kpis tabular form template 2 ppt powerpoint presentation styles model. This is a four stage process. The stages in this process are advances, inventories, trade receivables, current investments, current assets, other current assets.

P And L Kpis Tabular Form Ppt PowerPoint Presentation Ideas Infographics
This is a p and l kpis tabular form ppt powerpoint presentation ideas infographics. This is a four stage process. The stages in this process are other income, expenses, other expenses, depreciation expense, financing cost.
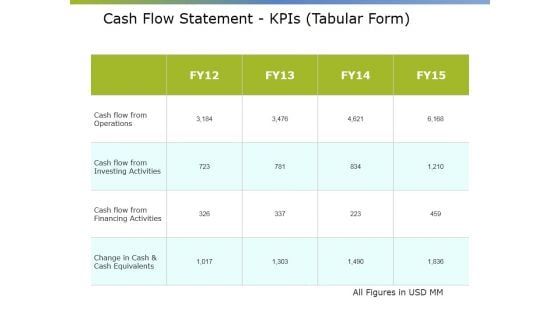
Cash Flow Statement Kpis Tabular Form Ppt PowerPoint Presentation Summary Elements
This is a cash flow statement kpis tabular form ppt powerpoint presentation summary elements. This is a four stage process. The stages in this process are net increase cash, financial activities, operations, investing activities.
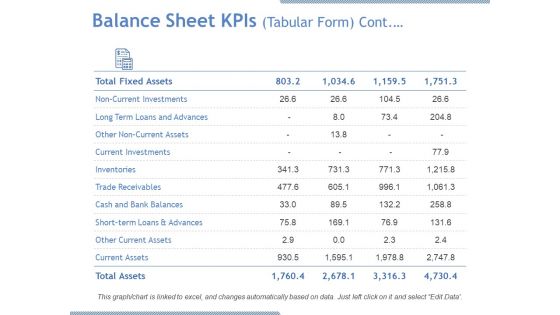
Balance Sheet Kpis Tabular Form Continuous Ppt PowerPoint Presentation Model Graphic Images
This is a balance sheet kpis tabular form continuous ppt powerpoint presentation model graphic images. This is a four stage process. The stages in this process are current investments, inventories, current assets, total assets, trade receivables.
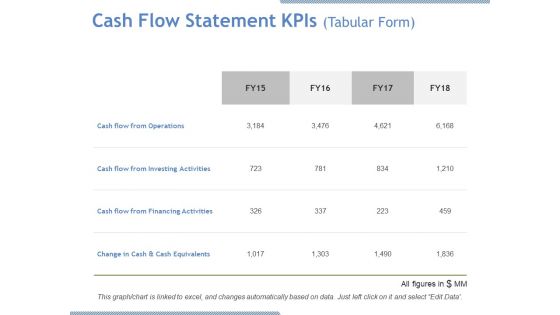
Cash Flow Statement Kpis Tabular Form Ppt PowerPoint Presentation Outline Slides
This is a cash flow statement kpis tabular form ppt powerpoint presentation outline slides. This is a four stage process. The stages in this process are cash flow from operations, cash flow from financing activities.
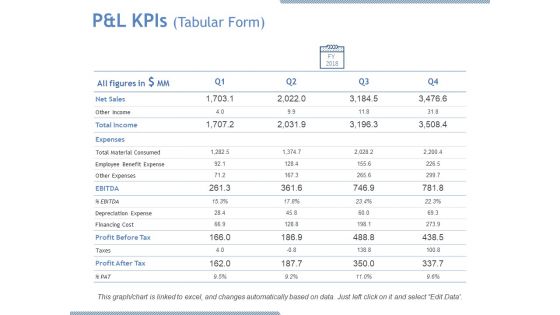
P And L Kpis Tabular Form Ppt PowerPoint Presentation Outline Aids
This is a p and l kpis tabular form ppt powerpoint presentation outline aids. This is a four stage process. The stages in this process are net sales, other income, total income, expenses, taxes.

Balance Sheet Kpis Tabular Form Template 1 Ppt PowerPoint Presentation Pictures Tips
This is a balance sheet kpis tabular form template 1 ppt powerpoint presentation pictures tips. This is a four stage process. The stages in this process are noncurrent liabilities, short term borrowings, trade payables, other current liabilities, short term provisions.
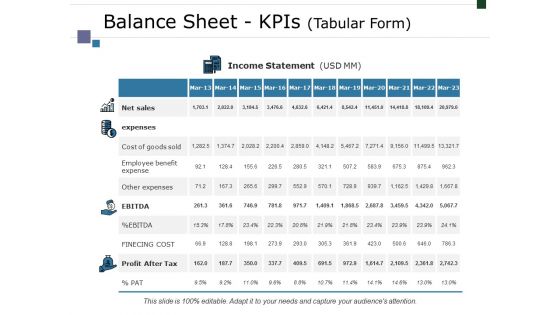
Balance Sheet Kpis Tabular Form Template 2 Ppt PowerPoint Presentation Summary Structure
This is a balance sheet kpis tabular form template 2 ppt powerpoint presentation summary structure. This is a four stage process. The stages in this process are net sales, expenses, ebitda, profit after tax, finecing cost.

Balance Sheet Kpis Tabular Form Cont Ppt PowerPoint Presentation Model Graphics Tutorials
This is a balance sheet kpis tabular form cont ppt powerpoint presentation model graphics tutorials. This is a four stage process. The stages in this process are long term loans and advances, current investments, inventories, trade receivables.
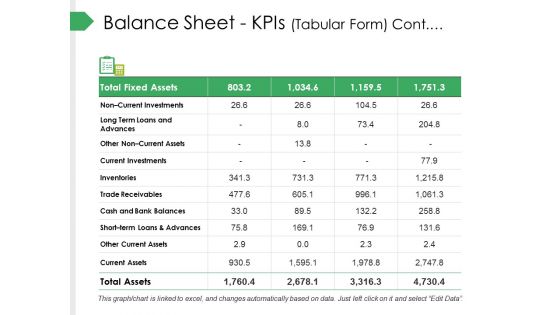
Balance Sheet Kpis Tabular Form Cont Ppt PowerPoint Presentation Summary Templates
This is a balance sheet kpis tabular form cont ppt powerpoint presentation summary templates. This is a four stage process. The stages in this process are current investments, inventories, trade receivables, cash and bank balances.
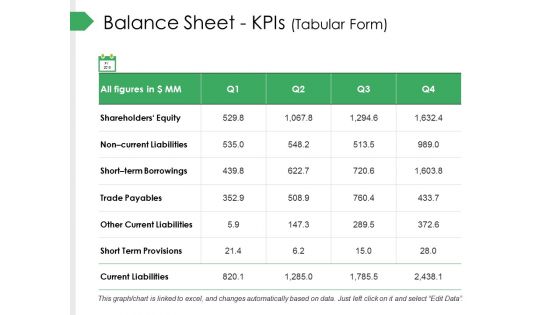
Balance Sheet Kpis Tabular Form Ppt PowerPoint Presentation Slides Designs Download
This is a balance sheet kpis tabular form ppt powerpoint presentation slides designs download. This is a four stage process. The stages in this process are trade payables, other current liabilities, short term provisions, current liabilities, short term borrowings.
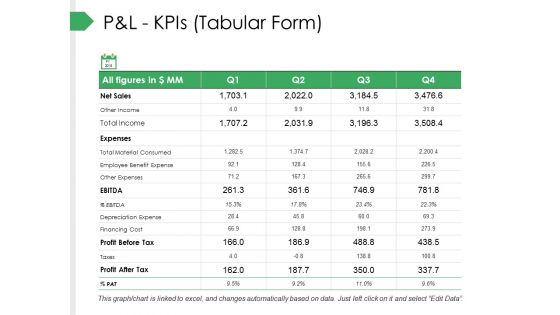
P And L Kpis Tabular Form Ppt PowerPoint Presentation Pictures Gallery
This is a p and l kpis tabular form ppt powerpoint presentation pictures gallery. This is a four stage process. The stages in this process are business, marketing, graph, strategy, finance.
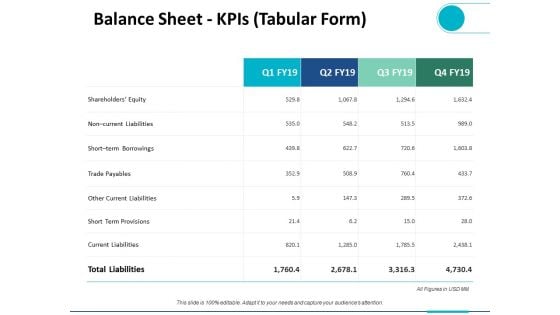
Balance Sheet Kpis Tabular Form Ppt PowerPoint Presentation Ideas Design Templates
This is a balance sheet kpis tabular form ppt powerpoint presentation ideas design templates. This is a four stage process. The stages in this process are finance, analysis, business, investment, marketing.
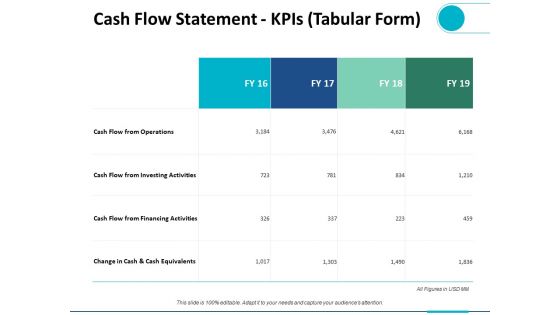
Cash Flow Statement Kpis Tabular Form Ppt PowerPoint Presentation Summary Infographic Template
This is a cash flow statement kpis tabular form ppt powerpoint presentation summary infographic template. This is a four stage process. The stages in this process are finance, analysis, business, investment, marketing.

P And L Kpis Tabular Form Ppt PowerPoint Presentation Ideas Brochure
This is a p and l kpis tabular form ppt powerpoint presentation ideas brochure. This is a four stage process. The stages in this process are business, planning, strategy, marketing, management.

Balance Sheet Kpis Tabular Form Management Ppt PowerPoint Presentation Summary Pictures
This is a balance sheet kpis tabular form management ppt powerpoint presentation summary pictures. This is a four stage process. The stages in this process are compare, marketing, business, management, planning.
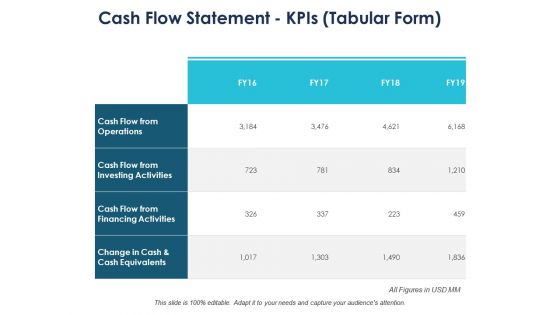
Cash Flow Statement Kpis Tabular Form Ppt PowerPoint Presentation Slides Themes
This is a cash flow statement kpis tabular form ppt powerpoint presentation slides themes. This is a four stage process. The stages in this process are finance, marketing, management, investment, analysis.
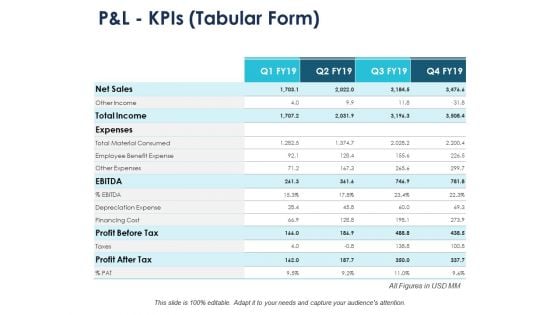
P And L Kpis Tabular Form Compare Ppt PowerPoint Presentation Gallery Maker
This is a p and l kpis tabular form compare ppt powerpoint presentation gallery maker. This is a four stage process. The stages in this process are compare, marketing, business, management, planning.
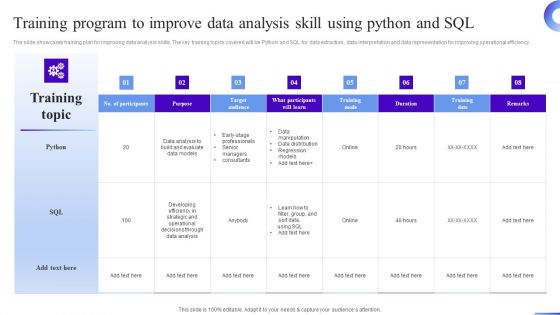
Business Development Program Training Program To Improve Data Analysis Skill Using Microsoft PDF
The slide showcases training plan for improving data analysis skills. The key training topics covered will be Python and SQL for data extraction, data interpretation and data representation for improving operational efficiency. Take your projects to the next level with our ultimate collection of Business Development Program Training Program To Improve Data Analysis Skill Using Microsoft PDF. Slidegeeks has designed a range of layouts that are perfect for representing task or activity duration, keeping track of all your deadlines at a glance. Tailor these designs to your exact needs and give them a truly corporate look with your own brand colors theyll make your projects stand out from the rest.
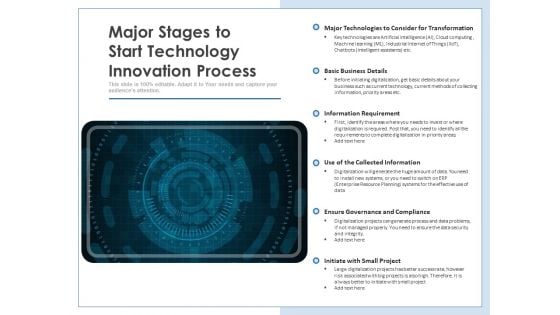
Major Stages To Start Technology Innovation Process Ppt PowerPoint Presentation Show Pictures PDF
Persuade your audience using this major stages to start technology innovation process ppt powerpoint presentation show pictures pdf. This PPT design covers one stages, thus making it a great tool to use. It also caters to a variety of topics including major technologies to consider for transformation, basic business details, information requirement, use of the collected information, ensure governance and compliance, initiate with small project. Download this PPT design now to present a convincing pitch that not only emphasizes the topic but also showcases your presentation skills.

Machine Learning Implementation And Case Study Why Is Machine Learning Important Ppt Styles Grid PDF
Presenting this set of slides with name machine learning implementation and case study why is machine learning important ppt styles grid pdf. This is a one stage process. The stages in this process are training, data, model, new data, prediction, predicted data, learning, error analysis, pre processing. This is a completely editable PowerPoint presentation and is available for immediate download. Download now and impress your audience.
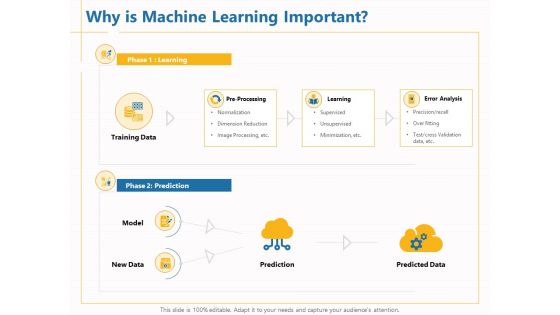
Boosting Machine Learning Why Is Machine Learning Important Ppt PowerPoint Presentation Infographics Graphics Download PDF
Presenting this set of slides with name boosting machine learning why is machine learning important ppt powerpoint presentation infographics graphics download pdf. This is a three stage process. The stages in this process are pre processing, learning, error analysis, training data, prediction, predicted data, new data, model. This is a completely editable PowerPoint presentation and is available for immediate download. Download now and impress your audience.
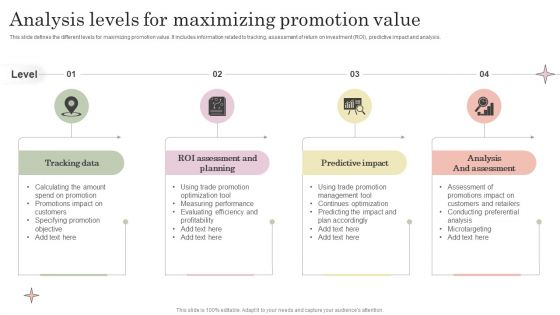
Analysis Levels For Maximizing Promotion Value Template PDF
This slide defines the different levels for maximizing promotion value. It includes information related to tracking, assessment of return on investment ROI, predictive impact and analysis. Persuade your audience using this Analysis Levels For Maximizing Promotion Value Template PDF. This PPT design covers four stages, thus making it a great tool to use. It also caters to a variety of topics including Tracking Data, Roi Assessment Planning, Predictive Impact. Download this PPT design now to present a convincing pitch that not only emphasizes the topic but also showcases your presentation skills.
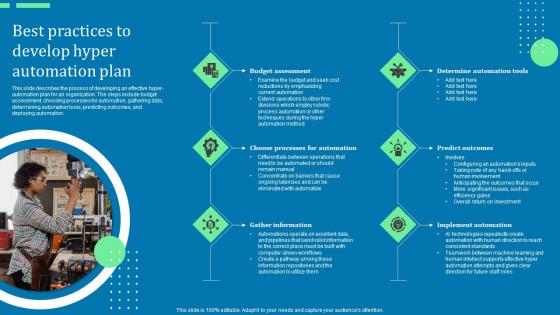
Best Practices To Develop Hyper Automation Plan Ppt Outline Templates Pdf
This slide describes the process of developing an effective hyper-automation plan for an organization. The steps include budget assessment, choosing processes for automation, gathering data, determining automation tools, predicting outcomes, and deploying automation. Slidegeeks is here to make your presentations a breeze with Best Practices To Develop Hyper Automation Plan Ppt Outline Templates Pdf With our easy-to-use and customizable templates, you can focus on delivering your ideas rather than worrying about formatting. With a variety of designs to choose from, you are sure to find one that suits your needs. And with animations and unique photos, illustrations, and fonts, you can make your presentation pop. So whether you are giving a sales pitch or presenting to the board, make sure to check out Slidegeeks first This slide describes the process of developing an effective hyper-automation plan for an organization. The steps include budget assessment, choosing processes for automation, gathering data, determining automation tools, predicting outcomes, and deploying automation.
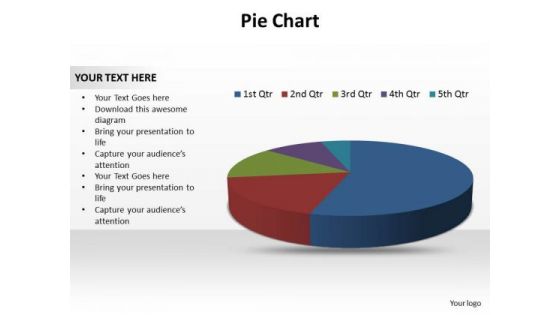
Buisness Leadership PowerPoint Templates Business Pie Chart Data Ppt Slides
Business Leadership PowerPoint Templates Business pie chart data PPT Slides-use this diagram to show your ideas all together to form the complete picture and reach the goal-Business Leadership PowerPoint Templates Business pie chart data PPT Slides-This ppt can be used for concepts relating to-Answer, Assemble, Assembly, Attention, Background, Brains, Build, Business, Challenge, Challenging, Clue, Complete, Complex, Concentration, Concept, Connect, Connection, Education, Entertainment, Finish Educate teams with our Buisness Leadership PowerPoint Templates Business Pie Chart Data Ppt Slides. Download without worries with our money back guaranteee.
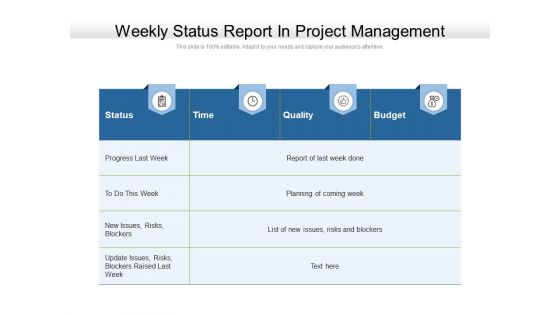
Weekly Status Report In Project Management Ppt PowerPoint Presentation Visual Aids Diagrams PDF
Presenting this set of slides with name weekly status report in project management ppt powerpoint presentation visual aids diagrams pdf. The topics discussed in these slides are status, time, quality, budget, progress last week, planning coming week. This is a completely editable PowerPoint presentation and is available for immediate download. Download now and impress your audience.
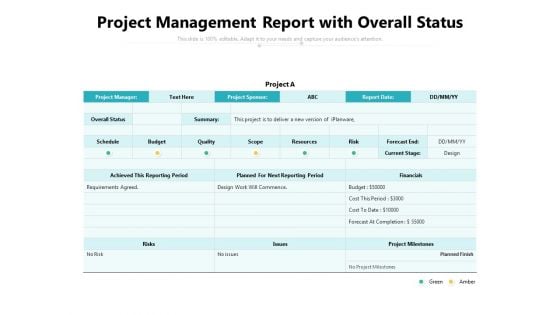
Project Management Report With Overall Status Ppt PowerPoint Presentation File Outline PDF
Pitch your topic with ease and precision using this project management report with overall status ppt powerpoint presentation file outline pdf. This layout presents information on budget, resources, financials. It is also available for immediate download and adjustment. So, changes can be made in the color, design, graphics or any other component to create a unique layout.

Project Deliverables Outline Status Report Schedule Ppt Pictures Layout Ideas PDF
Deliver an awe inspiring pitch with this creative project deliverables outline status report schedule ppt pictures layout ideas pdf bundle. Topics like target, budget, schedule can be discussed with this completely editable template. It is available for immediate download depending on the needs and requirements of the user.

Project Management Trends Ppt PowerPoint Presentation Summary Topics Cpb
Presenting this set of slides with name project management trends ppt powerpoint presentation summary topics cpb. This is an editable Powerpoint five stages graphic that deals with topics like project management trends to help convey your message better graphically. This product is a premium product available for immediate download and is 100 percent editable in Powerpoint. Download this now and use it in your presentations to impress your audience.
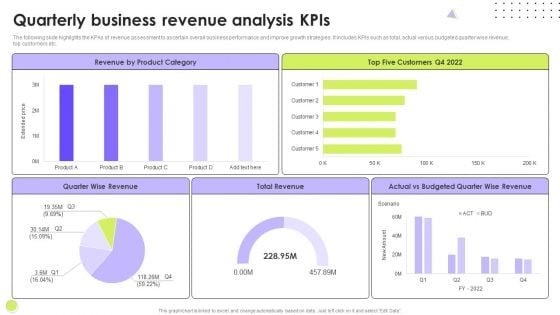
Quarterly Business Revenue Analysis Kpis Slides PDF
The following slide highlights the KPAs of revenue assessment to ascertain overall business performance and improve growth strategies. It includes KPIs such as total, actual versus budgeted quarter wise revenue, top customers etc. Showcasing this set of slides titled Quarterly Business Revenue Analysis Kpis Slides PDF. The topics addressed in these templates are Quarter Wise Revenue, Customers, Budgeted Quarter. All the content presented in this PPT design is completely editable. Download it and make adjustments in color, background, font etc. as per your unique business setting.
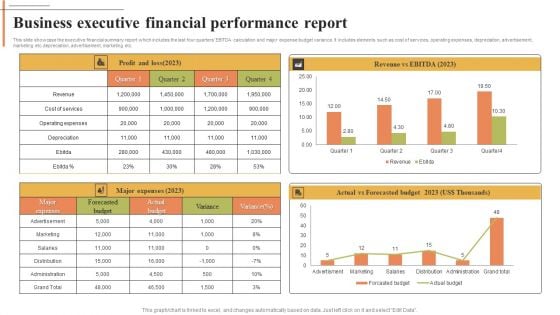
Business Executive Financial Performance Report Download PDF
This slide showcase the executive financial summary report which includes the last four quarters EBITDA calculation and major expense budget variance. It includes elements such as cost of services, operating expenses, depreciation, advertisement, marketing etc.depreciation, advertisement, marketing etc. Showcasing this set of slides titled Business Executive Financial Performance Report Download PDF. The topics addressed in these templates are Revenue, Cost Services, Operating Expenses. All the content presented in this PPT design is completely editable. Download it and make adjustments in color, background, font etc. as per your unique business setting.
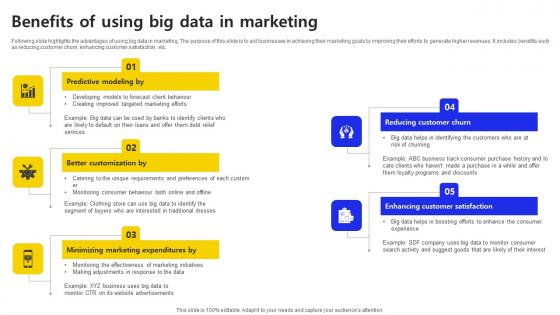
Benefits Of Using Big Data In Marketing Ppt File Brochure PDF
Following slide highlights the advantages of using big data in marketing. The purpose of this slide is to aid businesses in achieving their marketing goals by improving their efforts to generate higher revenues. It includes benefits such as reducing customer churn, enhancing customer satisfaction, etc. Showcasing this set of slides titled Benefits Of Using Big Data In Marketing Ppt File Brochure PDF. The topics addressed in these templates are Predictive Modelling, Better Customization, Minimizing Marketing Expenditures. All the content presented in this PPT design is completely editable. Download it and make adjustments in color, background, font etc. as per your unique business setting. Following slide highlights the advantages of using big data in marketing. The purpose of this slide is to aid businesses in achieving their marketing goals by improving their efforts to generate higher revenues. It includes benefits such as reducing customer churn, enhancing customer satisfaction, etc.
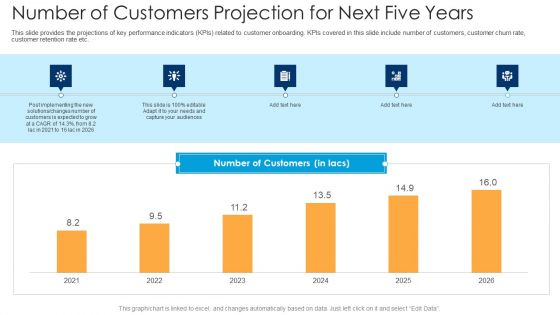
Number Of Customers Projection For Next Five Years Ppt Infographics Format PDF
This slide provides the projections of key performance indicators KPIs related to customer onboarding. KPIs covered in this slide include number of customers, customer churn rate, customer retention rate etc. Deliver and pitch your topic in the best possible manner with this number of customers projection for next five years ppt infographics format pdf. Use them to share invaluable insights on number of customers projection for next five years and impress your audience. This template can be altered and modified as per your expectations. So, grab it now.

Advantages Of Using Big Data Use Cases In Marketing Ppt Layouts Design Ideas pdf
This slide represents the advantages or benefits of big data use in boosting the marketing of a product or brand. It further includes better personalization, optimizing marketing spend, reduces customer churn, improves customer experience, etc. Showcasing this set of slides titled Advantages Of Using Big Data Use Cases In Marketing Ppt Layouts Design Ideas pdf. The topics addressed in these templates are Better Personalization,Improves Customer Experience,Effective Predictive Modelling. All the content presented in this PPT design is completely editable. Download it and make adjustments in color, background, font etc. as per your unique business setting. This slide represents the advantages or benefits of big data use in boosting the marketing of a product or brand. It further includes better personalization, optimizing marketing spend, reduces customer churn, improves customer experience, etc.
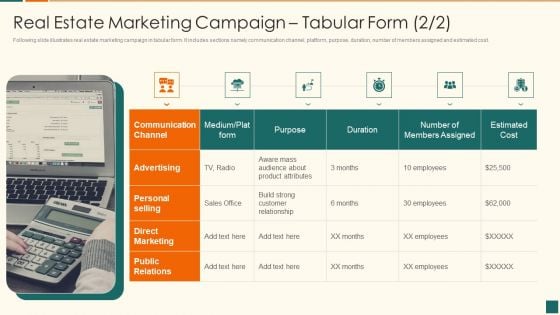
Developing Marketing Campaign For Real Estate Project Real Estate Marketing Campaign Tabular Form Clipart PDF
This slide shows real estate marketing campaign in tabular form. It includes sections namely buyers journey, objective, social strategy, activity, KPIs and results. Deliver and pitch your topic in the best possible manner with this developing marketing campaign for real estate project real estate marketing campaign tabular form clipart pdf. Use them to share invaluable insights on awareness, consideration, decision, adoption, advocacy and impress your audience. This template can be altered and modified as per your expectations. So, grab it now.
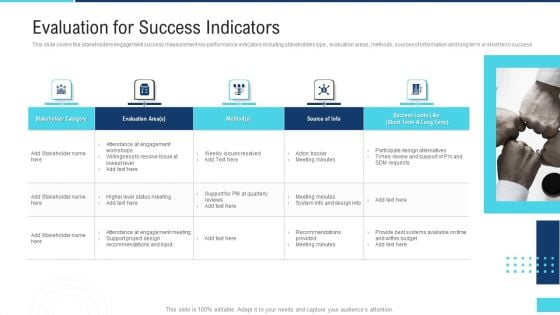
Profitable Initiation Project Engagement Process Evaluation For Success Indicators Ppt Outline Background Image PDF
This slide covers the stakeholders engagement success measurement key performance indicators including stakeholders type , evaluation areas, methods, sources of information and long term or short term success Deliver and pitch your topic in the best possible manner with this profitable initiation project engagement process evaluation for success indicators ppt outline background image pdf. Use them to share invaluable insights on stakeholder, evaluation, project design and impress your audience. This template can be altered and modified as per your expectations. So, grab it now.
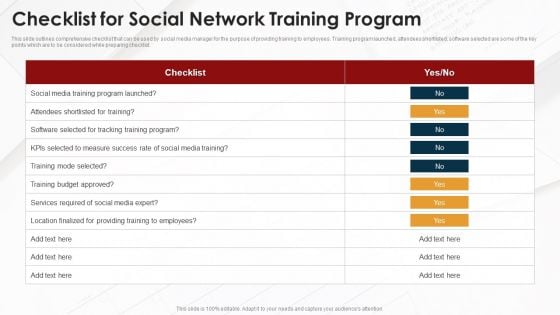
Checklist For Social Network Training Program Ppt Ideas Slideshow PDF
This slide outlines comprehensive checklist that can be used by social media manager for the purpose of providing training to employees. Training program launched, attendees shortlisted, software selected are some of the key points which are to be considered while preparing checklist. Showcasing this set of slides titled checklist for social network training program ppt ideas slideshow pdf. The topics addressed in these templates are social media training, program launched, kpis selected, measure success rate. All the content presented in this PPT design is completely editable. Download it and make adjustments in color, background, font etc. as per your unique business setting.
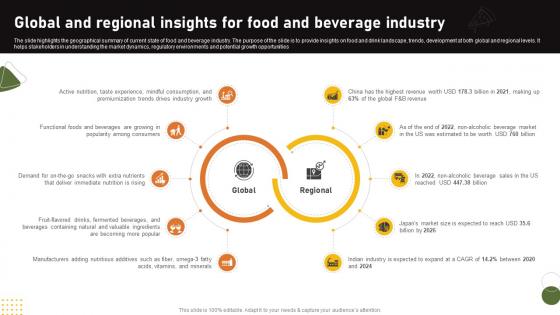
Food And Drink Industry Report Global And Regional Insights For Food And Beverage Industry IR SS V
The slide highlights the geographical summary of current state of food and beverage industry. The purpose of the slide is to provide insights on food and drink landscape, trends, development at both global and regional levels. It helps stakeholders in understanding the market dynamics, regulatory environments and potential growth opportunities. If your project calls for a presentation, then Slidegeeks is your go-to partner because we have professionally designed, easy-to-edit templates that are perfect for any presentation. After downloading, you can easily edit Food And Drink Industry Report Global And Regional Insights For Food And Beverage Industry IR SS V and make the changes accordingly. You can rearrange slides or fill them with different images. Check out all the handy templates The slide highlights the geographical summary of current state of food and beverage industry. The purpose of the slide is to provide insights on food and drink landscape, trends, development at both global and regional levels. It helps stakeholders in understanding the market dynamics, regulatory environments and potential growth opportunities.
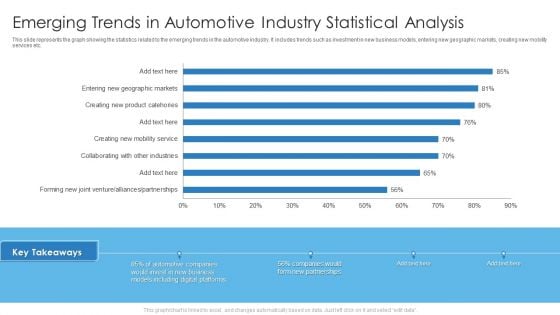
Emerging Trends In Automotive Industry Statistical Analysis Mockup PDF
This slide represents the graph showing the statistics related to the emerging trends in the automotive industry. It includes trends such as investment in new business models, entering new geographic markets, creating new mobility services etc. Deliver an awe inspiring pitch with this creative Emerging Trends In Automotive Industry Statistical Analysis Mockup PDF bundle. Topics like Emerging Trends In Automotive, Industry Statistical Analysis can be discussed with this completely editable template. It is available for immediate download depending on the needs and requirements of the user.
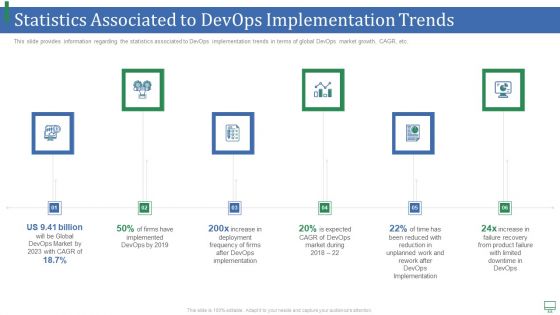
Statistics Associated To Devops Implementation Trends Formats PDF
This slide provides information regarding the statistics associated to DevOps implementation trends in terms of global DevOps market growth, CAGR, etc. Presenting statistics associated to devops implementation trends formats pdf to provide visual cues and insights. Share and navigate important information on six stages that need your due attention. This template can be used to pitch topics like implemented, global, firms, implementation, reduced. In addtion, this PPT design contains high resolution images, graphics, etc, that are easily editable and available for immediate download.
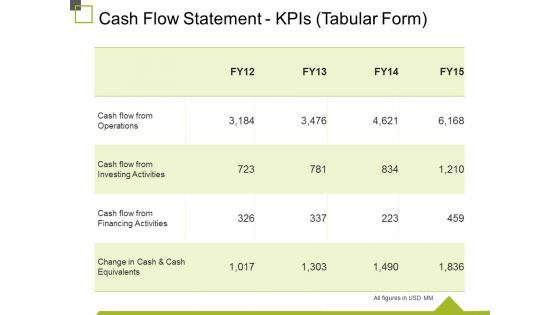
Cash Flow Statement Kpis Tabular Form Ppt PowerPoint Presentation Gallery Infographic Template
This is a cash flow statement kpis tabular form ppt powerpoint presentation gallery infographic template. This is a four stage process. The stages in this process are cash flow from operations, cash flow from investing activities, cash flow from financing activities, change in cash and cash equivalents change in cash and cash equivalents.
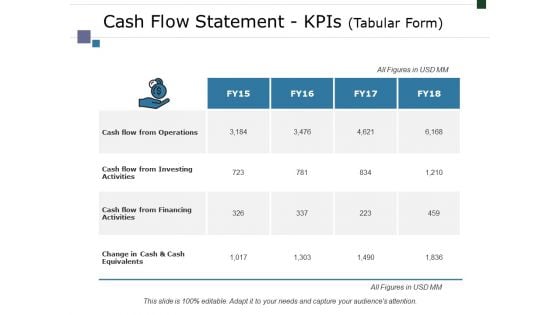
Cash Flow Statement Kpis Tabular Form Ppt PowerPoint Presentation Summary Graphics Tutorials
This is a cash flow statement kpis tabular form ppt powerpoint presentation summary graphics tutorials. This is a four stage process. The stages in this process are cash flow from operations, cash flow from investing activities, cash flow from financing activities, change in cash and cash equivalents, business.
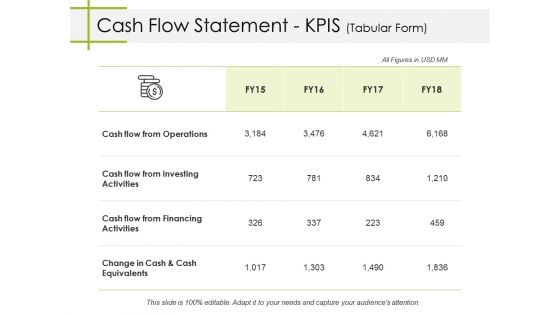
Cash Flow Statement Kpis Tabular Form Ppt PowerPoint Presentation Portfolio Vector
This is a cash flow statement kpis tabular form ppt powerpoint presentation portfolio vector. This is a four stage process. The stages in this process are business, cash flow from operations, cash flow from investing activities, cash flow from financing activities, change in cash and cash equivalents.

Cash Flow Statement Kpis Tabular Form Ppt PowerPoint Presentation Slides Skills
This is a cash flow statement kpis tabular form ppt powerpoint presentation slides skills. This is a four stage process. The stages in this process are business, cash flow from operations, cash flow from investing activities, cash flow from financing activities, change in cash and cash equivalents.


 Continue with Email

 Home
Home


