Forecast Vs Actual

Flag American Security PowerPoint Presentation Slides S
Microsoft PowerPoint Slides and Backgrounds with flag american with gun creative actual for designer Do a commendable job with our Flag American Security PowerPoint Presentation Slides S. Your audience will keep clapping for you.

Root Cause Business Analysis Diagram Background Picture
This is a root cause business analysis diagram background picture. This is a four stage process. The stages in this process are apparent problem, symptom of problem, possible root cause, actual root case.
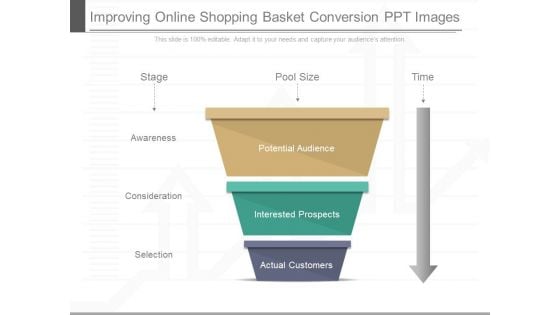
Improving Online Shopping Basket Conversion Ppt Images
This is a improving online shopping basket conversion ppt images. This is a three stage process. The stages in this process are stage, pool size, time, awareness, consideration, selection, potential audience, interested prospects, actual customers.
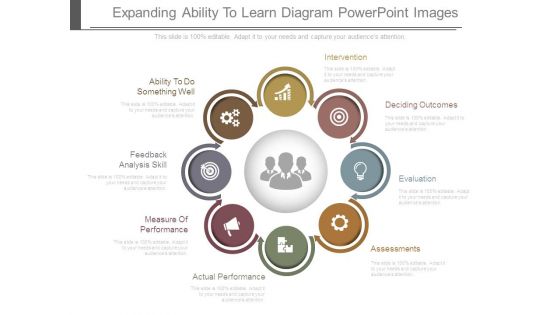
Expanding Ability To Learn Diagram Powerpoint Images
This is a expanding ability to learn diagram powerpoint images. This is a eight stage process. The stages in this process are intervention, deciding outcomes, evaluation, assessments, actual performance, measure of performance, feedback analysis skill, ability to do something well.
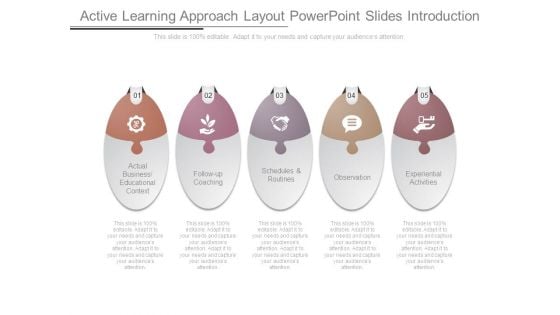
Active Learning Approach Layout Powerpoint Slides Introduction
This is a active learning approach layout powerpoint slides introduction. This is a five stage process. The stages in this process are actual business, educational context, follow up coaching, schedules and routines, observation, experiential activities.
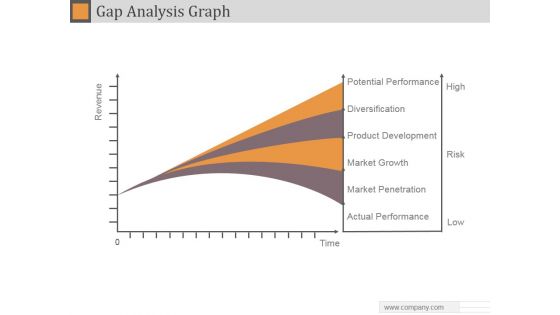
Gap Analysis Graph Ppt PowerPoint Presentation Example 2015
This is a gap analysis graph ppt powerpoint presentation example 2015. This is a four stage process. The stages in this process are potential performance, diversification, product development, market growth, market penetration, actual performance.
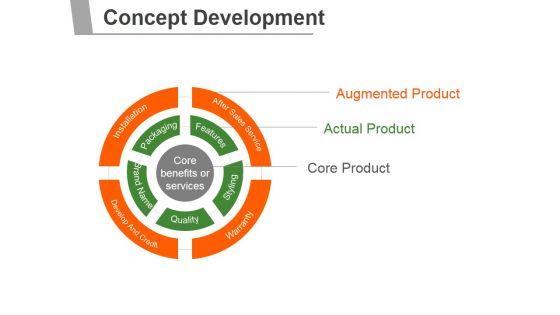
Concept Development Ppt PowerPoint Presentation Layouts
This is a concept development ppt powerpoint presentation layouts. This is a four stage process. The stages in this process are augmented product, actual product, core product, packaging, installation.
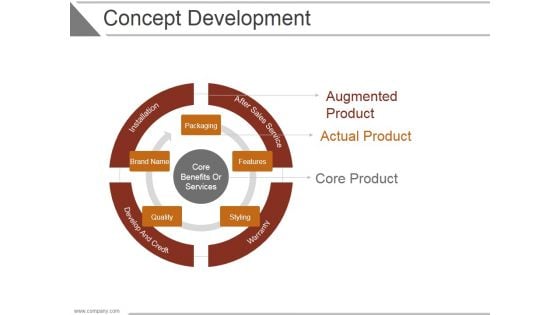
Concept Development Ppt PowerPoint Presentation Information
This is a concept development ppt powerpoint presentation information. This is a four stage process. The stages in this process are augmented product, actual product, core product, packaging, brand name, features, styling, quality.
Concept Development Ppt PowerPoint Presentation Icon Slideshow
This is a concept development ppt powerpoint presentation icon slideshow. This is a four stage process. The stages in this process are actual product, augmented product, core product, warranty.
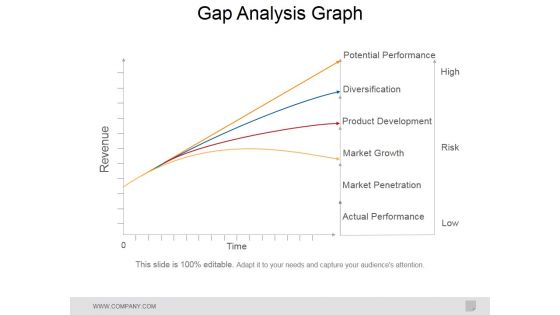
Gap Analysis Graph Ppt PowerPoint Presentation Portfolio Topics
This is a gap analysis graph ppt powerpoint presentation portfolio topics. This is a four stage process. The stages in this process are potential performance, diversification, product development, market growth, market penetration, actual performance.
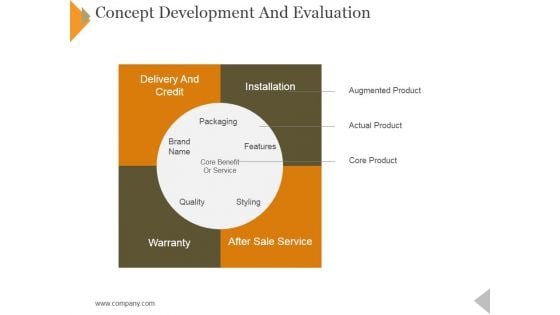
Concept Development And Evaluation Ppt PowerPoint Presentation Summary Infographics
This is a concept development and evaluation ppt powerpoint presentation summary infographics. This is a four stage process. The stages in this process are augmented product, actual product, core product, warranty, styling.
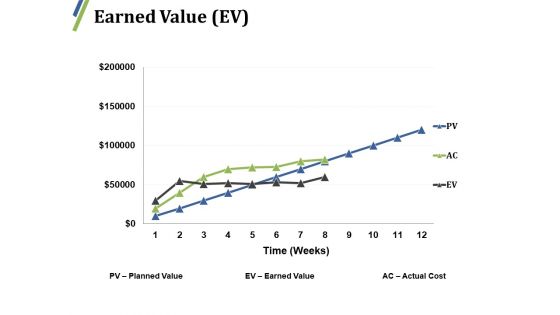
Earned Value Ppt PowerPoint Presentation Gallery Design Templates
This is a earned value ppt powerpoint presentation gallery design templates. This is a three stage process. The stages in this process are planned value, earned value, actual cost, growth, finance.
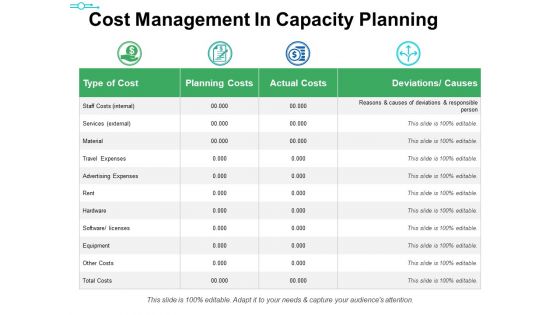
Cost Management In Capacity Planning Ppt PowerPoint Presentation Pictures Themes
This is a cost management in capacity planning ppt powerpoint presentation pictures themes. This is a four stage process. The stages in this process are type of cost, planning costs, actual costs, deviations, causes.
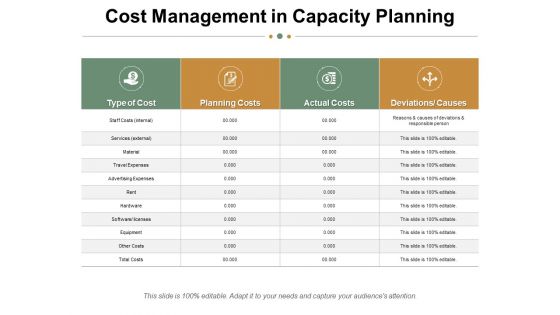
Cost Management In Capacity Planning Ppt PowerPoint Presentation Summary Professional
This is a cost management in capacity planning ppt powerpoint presentation summary professional. This is a four stage process. The stages in this process are table, compare, planning cost, travel expenses, actual cost, deviation cost.
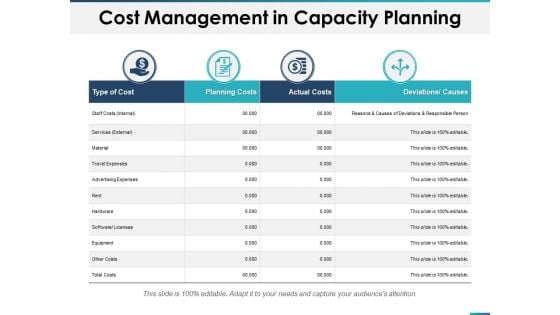
Cost Management In Capacity Planning Ppt PowerPoint Presentation File Slide
This is a cost management in capacity planning ppt powerpoint presentation file slide. This is a four stage process. The stages in this process are planning costs, actual costs, deviations, causes, material.
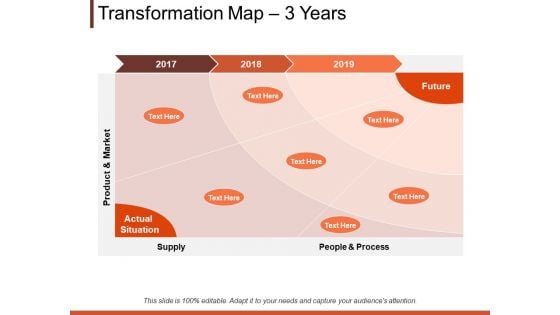
Transformation Map 3 Years Planning Ppt PowerPoint Presentation Outline Examples
This is a transformation map 3 years planning ppt powerpoint presentation outline examples. This is a three stage process. The stages in this process are supply, people, process, actual situation, future.
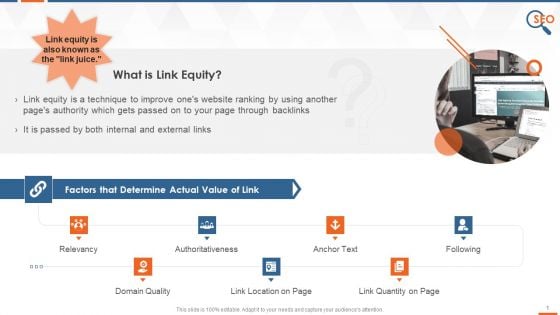
Building Link Equity And Contributing Factors Training Ppt
This slide provides information regarding the link juice and multiple factors that determine the links actual value, such as relevancy, authoritativeness, anchor text, following, domain quality, link location and quantity on page, and HTTPS status.
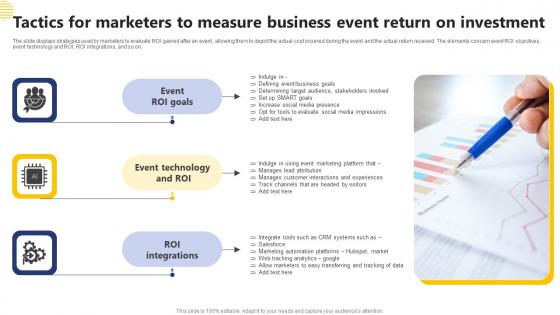
Tactics For Marketers To Measure Business Event Return On Investment Infographics Pdf
The slide displays strategies used by marketers to evaluate ROI gained after an event, allowing them to depict the actual cost incurred during the event and the actual return received. The elements concern event ROI objectives, event technology and ROI, ROI integrations, and so on. Showcasing this set of slides titled Tactics For Marketers To Measure Business Event Return On Investment Infographics Pdf The topics addressed in these templates are Event ROI Goals, Event Technology, ROI Integrations All the content presented in this PPT design is completely editable. Download it and make adjustments in color, background, font etc. as per your unique business setting. The slide displays strategies used by marketers to evaluate ROI gained after an event, allowing them to depict the actual cost incurred during the event and the actual return received. The elements concern event ROI objectives, event technology and ROI, ROI integrations, and so on.
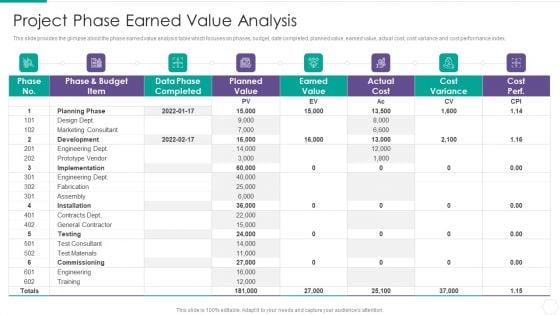
Quantitative Risk Assessment Project Phase Earned Value Analysis Pictures PDF
This slide provides the glimpse about the phase earned value analysis table which focuses on phases, budget, date completed, planned value, earned value, actual cost, cost variance and cost performance index. Deliver an awe inspiring pitch with this creative Quantitative Risk Assessment Project Phase Earned Value Analysis Pictures PDF bundle. Topics like Implementation, Development, Actual Cost, Earned Value can be discussed with this completely editable template. It is available for immediate download depending on the needs and requirements of the user.
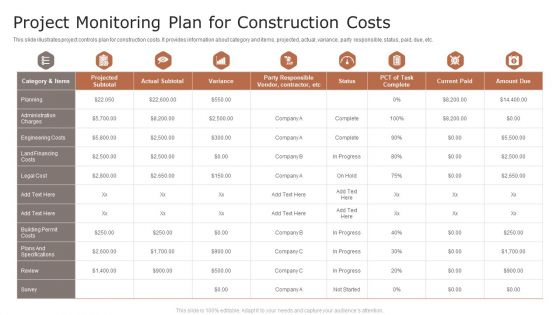
Project Monitoring Plan For Construction Costs Ppt Styles Elements PDF
This slide illustrates project controls plan for construction costs. It provides information about category and items, projected, actual, variance, party responsible, status, paid, due, etc. Pitch your topic with ease and precision using this Project Monitoring Plan For Construction Costs Ppt Styles Elements PDF. This layout presents information on Actual Subtotal, Variance, Current Paid. It is also available for immediate download and adjustment. So, changes can be made in the color, design, graphics or any other component to create a unique layout.
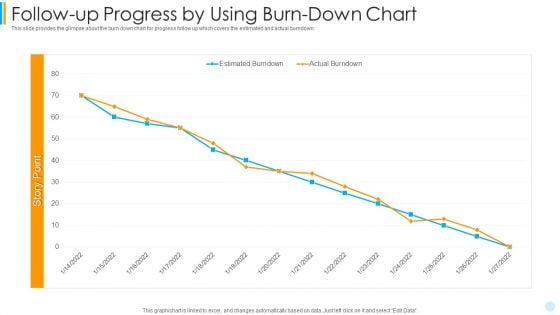
Scrum Development Model Follow Up Progress By Using Burn Down Chart Portrait PDF
this slide provides the glimpse about the burn down chart for progress follow up which covers the estimated and actual burndown. Deliver an awe inspiring pitch with this creative scrum development model follow up progress by using burn down chart portrait pdf bundle. Topics like estimated burndown, actual burndown can be discussed with this completely editable template. It is available for immediate download depending on the needs and requirements of the user.
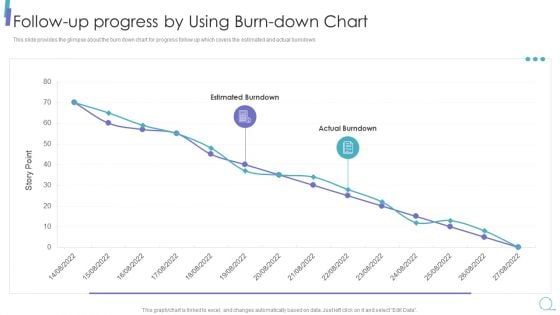
Scrum Process Framework Follow Up Progress By Using Burn Down Chart Download Pdf
This slide provides the glimpse about the burn down chart for progress follow up which covers the estimated and actual burndown. Deliver an awe inspiring pitch with this creative scrum process framework follow up progress by using burn down chart download pdf bundle. Topics like actual burndown, estimated burndown, story point can be discussed with this completely editable template. It is available for immediate download depending on the needs and requirements of the user.
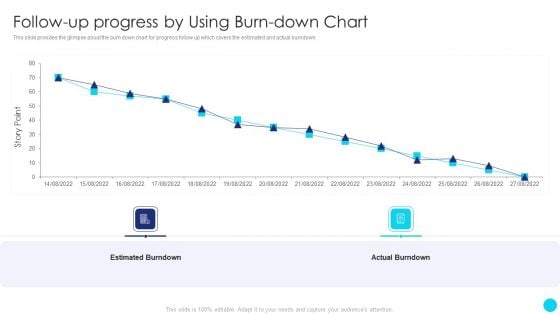
Scrum Software Development Life Cycle Follow Up Progress By Using Burn Down Chart Pictures PDF
This slide provides the glimpse about the burn down chart for progress follow up which covers the estimated and actual burndown. Deliver an awe inspiring pitch with this creative Scrum Software Development Life Cycle Follow Up Progress By Using Burn Down Chart Pictures PDF bundle. Topics like Estimated Burndown, Actual Burndown can be discussed with this completely editable template. It is available for immediate download depending on the needs and requirements of the user.
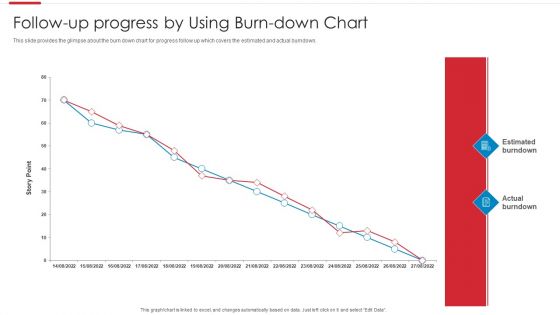
Agile Software Development Process Follow Up Progress By Using Burn Down Chart Slides PDF
This slide provides the glimpse about the burn down chart for progress follow up which covers the estimated and actual burndown. Deliver an awe inspiring pitch with this creative Agile Software Development Process Follow Up Progress By Using Burn Down Chart Slides PDF bundle. Topics like Estimated Burndown, Actual Burndown can be discussed with this completely editable template. It is available for immediate download depending on the needs and requirements of the user.
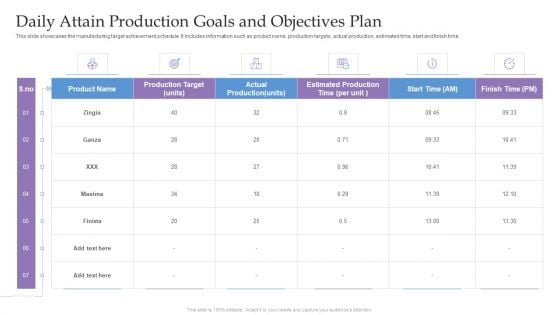
Daily Attain Production Goals And Objectives Plan Ppt Professional Guide PDF
This slide showcases the manufacturing target achievement schedule. It includes information such as product name, production targets, actual production, estimated time, start and finish time. Showcasing this set of slides titled Daily Attain Production Goals And Objectives Plan Ppt Professional Guide PDF. The topics addressed in these templates are Production Target, Actual Production, Estimated Production Time. All the content presented in this PPT design is completely editable. Download it and make adjustments in color, background, font etc. as per your unique business setting.
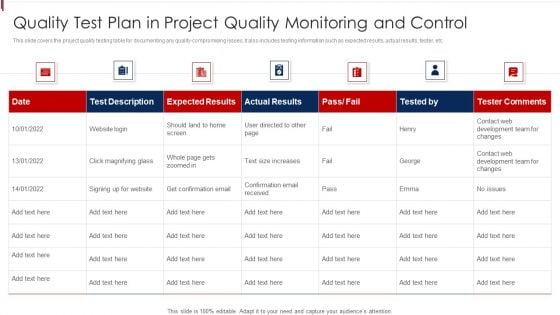
Quality Test Plan In Project Quality Monitoring And Control Sample PDF
This slide covers the project quality testing table for documenting any quality-compromising issues. It also includes testing information such as expected results, actual results, tester, etc. Showcasing this set of slides titled Quality Test Plan In Project Quality Monitoring And Control Sample PDF. The topics addressed in these templates are Actual Results, Tester Comments, Test Description. All the content presented in this PPT design is completely editable. Download it and make adjustments in color, background, font etc. as per your unique business setting.
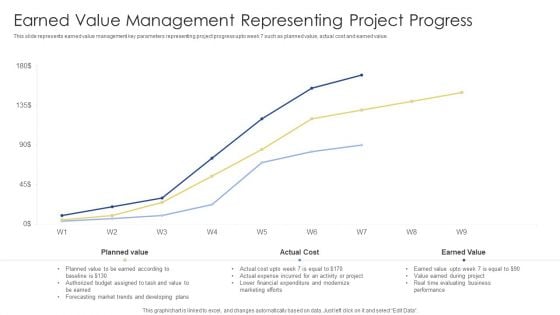
Earned Value Management Representing Project Progress Ppt Layouts Slide Portrait PDF
This slide represents earned value management key parameters representing project progress upto week 7 such as planned value, actual cost and earned value. Pitch your topic with ease and precision using this Earned Value Management Representing Project Progress Ppt Layouts Slide Portrait PDF. This layout presents information on Planned Value, Actual Cost, Earned Value. It is also available for immediate download and adjustment. So, changes can be made in the color, design, graphics or any other component to create a unique layout.
Goal Of Pi Project Planning Event With Activities List Ppt Icon Slideshow PDF
This slide covers goal of pi planning event with activities list which includes business and actual value with program increment goals. Showcasing this set of slides titled Goal Of Pi Project Planning Event With Activities List Ppt Icon Slideshow PDF. The topics addressed in these templates are Program Increment Goals, Business Value, Actual Value. All the content presented in this PPT design is completely editable. Download it and make adjustments in color, background, font etc. as per your unique business setting.

Sales Roadmap Volume Price Mix Analysis Summary PDF
This slide defines the volume price mix analysis using sales bridge . It includes information related to the budget specified and the actual achievement.Showcasing this set of slides titled Sales Roadmap Volume Price Mix Analysis Summary PDF. The topics addressed in these templates are Actual Turnover, Compared Budget, Generating Awareness. All the content presented in this PPT design is completely editable. Download it and make adjustments in color, background, font etc. as per your unique business setting.
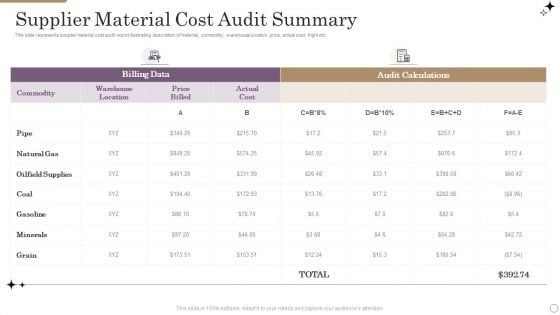
Supplier Material Cost Audit Summary Pictures PDF
This slide represents supplier material cost audit report illustrating description of material, commodity, warehouse location, price, actual cost, fright etc. Showcasing this set of slides titled Supplier Material Cost Audit Summary Pictures PDF. The topics addressed in these templates are Warehouse Location, Price Billed, Actual Cost. All the content presented in this PPT design is completely editable. Download it and make adjustments in color, background, font etc. as per your unique business setting.
Distorting Proxy Server And Its Architecture Reverse Proxy For Load Balancing Icons PDF
The following slide depicts the distorting proxy server and how it hides its actual identity while representing itself to the website as a proxy.Deliver an awe inspiring pitch with this creative Distorting Proxy Server And Its Architecture Reverse Proxy For Load Balancing Icons PDF bundle. Topics like Disguises Its Actual, Identity While, Presenting Itself can be discussed with this completely editable template. It is available for immediate download depending on the needs and requirements of the user.
Earned Value Management Variance Analysis Ppt PowerPoint Presentation Gallery Icons PDF
This slide represents earned value management variance analysis illustrating actual cost, planned cost, earned value, delay in units time, scheduled variance and cost variance. Showcasing this set of slides titled Earned Value Management Variance Analysis Ppt PowerPoint Presentation Gallery Icons PDF. The topics addressed in these templates are Planned Value, Actual Cost, Earned Value. All the content presented in this PPT design is completely editable. Download it and make adjustments in color, background, font etc. as per your unique business setting.
Market Penetration Dashboard With Sales Metrics Ppt Icon Examples PDF
This slide shows market penetration dashboard for sales team. It provides information about regions, emerging markets, planned sales, actual sales, revenue, gender wise sales, etc. Pitch your topic with ease and precision using this Market Penetration Dashboard With Sales Metrics Ppt Icon Examples PDF. This layout presents information on Emerging Markets, Sales Gender, Actual Sales. It is also available for immediate download and adjustment. So, changes can be made in the color, design, graphics or any other component to create a unique layout.
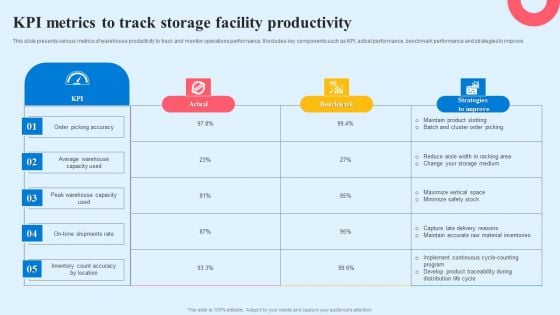
KPI Metrics To Track Storage Facility Productivity Designs PDF
This slide presents various metrics of warehouse productivity to track and monitor operations performance. It includes key components such as KPI, actual performance, benchmark performance and strategies to improve. Showcasing this set of slides titled KPI Metrics To Track Storage Facility Productivity Designs PDF. The topics addressed in these templates are Actual, Benchmark, Strategies To Improve. All the content presented in this PPT design is completely editable. Download it and make adjustments in color, background, font etc. as per your unique business setting.
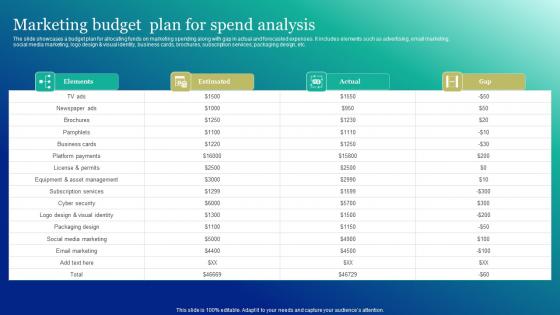
Marketing Budget Plan For Spend Analysis Marketing And Promotion Automation Download Pdf
The slide showcases a budget plan for allocating funds on marketing spending along with gap in actual and forecasted expenses. It includes elements such as advertising, email marketing, social media marketing, logo design and visual identity, business cards, brochures, subscription services, packaging design, etc.The best PPT templates are a great way to save time, energy, and resources. Slidegeeks have 100Precent editable powerpoint slides making them incredibly versatile. With these quality presentation templates, you can create a captivating and memorable presentation by combining visually appealing slides and effectively communicating your message. Download Marketing Budget Plan For Spend Analysis Marketing And Promotion Automation Download Pdf from Slidegeeks and deliver a wonderful presentation. The slide showcases a budget plan for allocating funds on marketing spending along with gap in actual and forecasted expenses. It includes elements such as advertising, email marketing, social media marketing, logo design and visual identity, business cards, brochures, subscription services, packaging design, etc.
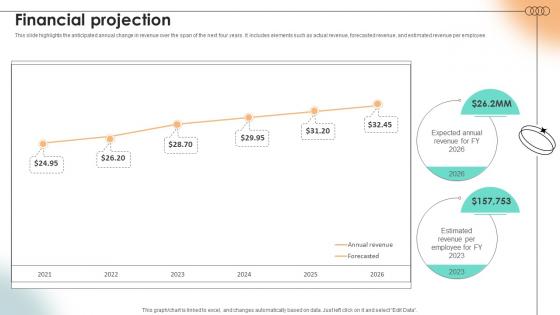
Financial Projection Content Marketing Platform Investor Funding Elevator Pitch Deck
This slide highlights the anticipated annual change in revenue over the span of the next four years. It includes elements such as actual revenue, forecasted revenue, and estimated revenue per employee. Do you have an important presentation coming up Are you looking for something that will make your presentation stand out from the rest Look no further than Financial Projection Content Marketing Platform Investor Funding Elevator Pitch Deck. With our professional designs, you can trust that your presentation will pop and make delivering it a smooth process. And with Slidegeeks, you can trust that your presentation will be unique and memorable. So why wait Grab Financial Projection Content Marketing Platform Investor Funding Elevator Pitch Deck today and make your presentation stand out from the rest This slide highlights the anticipated annual change in revenue over the span of the next four years. It includes elements such as actual revenue, forecasted revenue, and estimated revenue per employee.
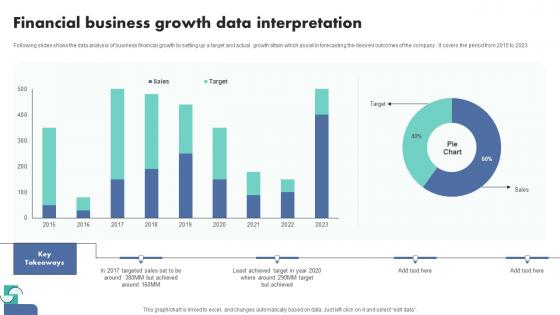
Financial Business Growth Data Interpretation Themes Pdf
Following slides shows the data analysis of business financial growth by setting up a target and actual growth attain which assist in forecasting the desired outcomes of the company . It covers the period from 2015 to 2023.Pitch your topic with ease and precision using this Financial Business Growth Data Interpretation Themes Pdf This layout presents information on Financial Business, Growth Data Interpretation It is also available for immediate download and adjustment. So, changes can be made in the color, design, graphics or any other component to create a unique layout. Following slides shows the data analysis of business financial growth by setting up a target and actual growth attain which assist in forecasting the desired outcomes of the company . It covers the period from 2015 to 2023.
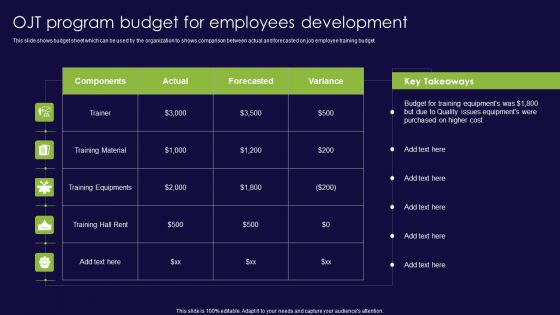
OJT Program Budget For Employees Development Ppt Ideas Mockup PDF
This slide shows budget sheet which can be used by the organization to shows comparison between actual and forecasted on job employee training budget. Pitch your topic with ease and precision using this OJT Program Budget For Employees Development Ppt Ideas Mockup PDF. This layout presents information on Training Material, Training Equipments, Training Hall Rent. It is also available for immediate download and adjustment. So, changes can be made in the color, design, graphics or any other component to create a unique layout.
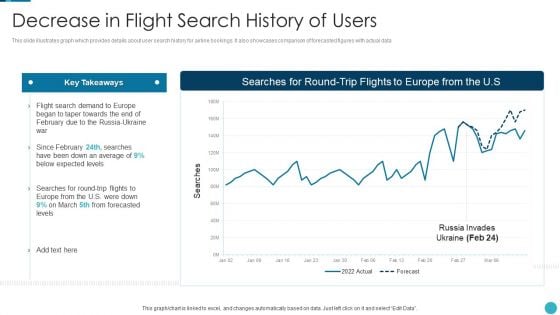
Russia Ukraine War Influence On Airline Sector Decrease In Flight Search History Of Users Sample PDF
This slide illustrates graph which provides details about user search history for airline bookings. It also showcases comparison of forecasted figures with actual data Deliver an awe inspiring pitch with this creative russia ukraine war influence on airline sector decrease in flight search history of users sample pdf bundle. Topics like decrease in flight search history of users can be discussed with this completely editable template. It is available for immediate download depending on the needs and requirements of the user.
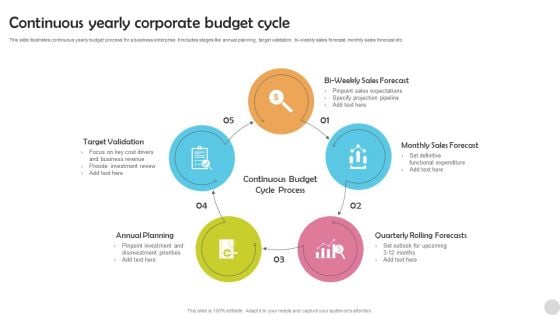
Continuous Yearly Corporate Budget Cycle Graphics PDF
This slide illustrates continuous yearly budget process for a business enterprise. It includes stages like annual planning, target validation, bi-weekly sales forecast, monthly sales forecast etc. Presenting Continuous Yearly Corporate Budget Cycle Graphics PDF to dispense important information. This template comprises five stages. It also presents valuable insights into the topics including Target Validation, Annual Planning, Monthly Sales Forecast. This is a completely customizable PowerPoint theme that can be put to use immediately. So, download it and address the topic impactfully.
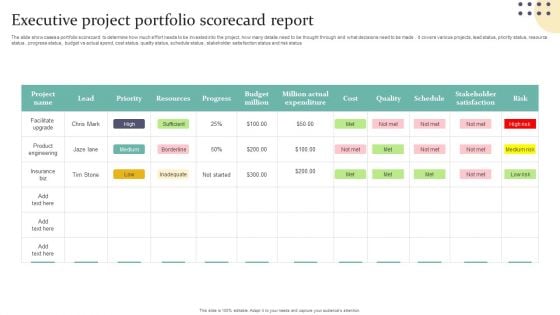
Executive Project Portfolio Scorecard Report Topics PDF
The slide showcases a portfolio scorecard to determine how much effort needs to be invested into the project, how many details need to be thought through and what decisions need to be made . it covers various projects, lead status, priority status, resource status , progress status, budget vs actual spend, cost status, quality status, schedule status , stakeholder satisfaction status and risk status. Showcasing this set of slides titled Executive Project Portfolio Scorecard Report Topics PDF. The topics addressed in these templates are Priority, Budget Million, Cost. All the content presented in this PPT design is completely editable. Download it and make adjustments in color, background, font etc. as per your unique business setting.
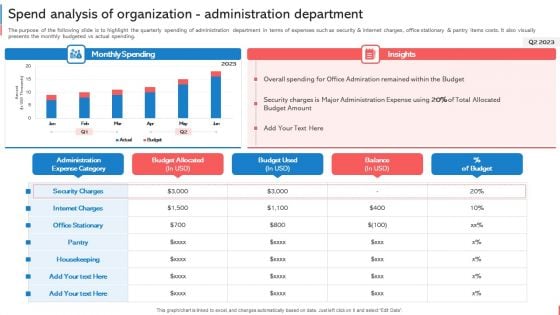
Company Budget Analysis Spend Analysis Of Organization Administration Department Download PDF
The purpose of the following slide is to highlight the quarterly spending of administration department in terms of expenses such as security and internet charges, office stationary and pantry items costs. It also visually presents the monthly budgeted vs actual spending. This Company Budget Analysis Spend Analysis Of Organization Administration Department Download PDF is perfect for any presentation, be it in front of clients or colleagues. It is a versatile and stylish solution for organizing your meetings. The Company Budget Analysis Spend Analysis Of Organization Administration Department Download PDF features a modern design for your presentation meetings. The adjustable and customizable slides provide unlimited possibilities for acing up your presentation. Slidegeeks has done all the homework before launching the product for you. So, dont wait, grab the presentation templates today.
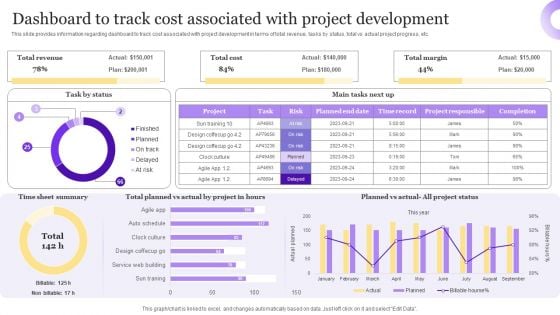
Best Techniques For Agile Project Cost Assessment Dashboard To Track Cost Associated Formats PDF
This slide provides information regarding dashboard to track cost associated with project development in terms of total revenue, tasks by status, total vs actual project progress, etc. Do you have an important presentation coming up Are you looking for something that will make your presentation stand out from the rest Look no further than Best Techniques For Agile Project Cost Assessment Dashboard To Track Cost Associated Formats PDF. With our professional designs, you can trust that your presentation will pop and make delivering it a smooth process. And with Slidegeeks, you can trust that your presentation will be unique and memorable. So why wait Grab Best Techniques For Agile Project Cost Assessment Dashboard To Track Cost Associated Formats PDF today and make your presentation stand out from the rest
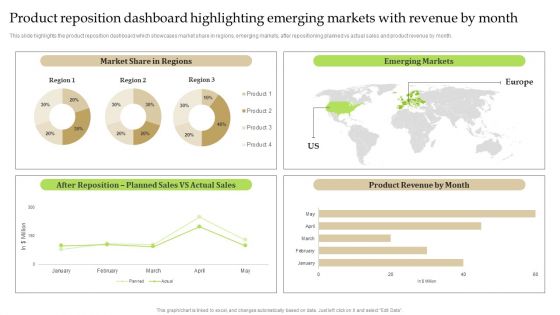
Product Reposition Dashboard Highlighting Emerging Markets With Revenue By Month Brochure PDF
This slide highlights the product reposition dashboard which showcases market share in regions, emerging markets, after repositioning planned vs actual sales and product revenue by month. Are you searching for a Product Reposition Dashboard Highlighting Emerging Markets With Revenue By Month Brochure PDF that is uncluttered, straightforward, and original Its easy to edit, and you can change the colors to suit your personal or business branding. For a presentation that expresses how much effort you have put in, this template is ideal. With all of its features, including tables, diagrams, statistics, and lists, its perfect for a business plan presentation. Make your ideas more appealing with these professional slides. Download Product Reposition Dashboard Highlighting Emerging Markets With Revenue By Month Brochure PDF from Slidegeeks today.
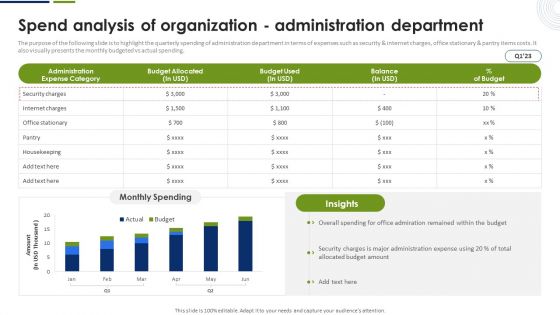
Spend Analysis Of Organization Administration Department Graphics PDF
The purpose of the following slide is to highlight the quarterly spending of administration department in terms of expenses such as security and internet charges, office stationary and pantry items costs. It also visually presents the monthly budgeted vs actual spending. Explore a selection of the finest Spend Analysis Of Organization Administration Department Graphics PDF here. With a plethora of professionally designed and pre made slide templates, you can quickly and easily find the right one for your upcoming presentation. You can use our Spend Analysis Of Organization Administration Department Graphics PDF to effectively convey your message to a wider audience. Slidegeeks has done a lot of research before preparing these presentation templates. The content can be personalized and the slides are highly editable. Grab templates today from Slidegeeks.
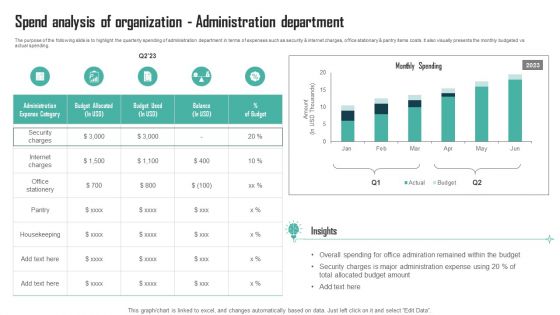
Expenses Management Plan Spend Analysis Of Organization Administration Department Professional PDF
The purpose of the following slide is to highlight the quarterly spending of administration department in terms of expenses such as security and internet charges, office stationary and pantry items costs. It also visually presents the monthly budgeted vs actual spending. Coming up with a presentation necessitates that the majority of the effort goes into the content and the message you intend to convey. The visuals of a PowerPoint presentation can only be effective if it supplements and supports the story that is being told. Keeping this in mind our experts created Expenses Management Plan Spend Analysis Of Organization Administration Department Professional PDF to reduce the time that goes into designing the presentation. This way, you can concentrate on the message while our designers take care of providing you with the right template for the situation.
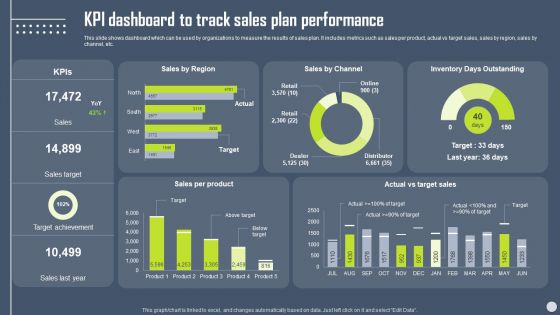
Boosting Yearly Business Revenue KPI Dashboard To Track Sales Plan Performance Topics PDF
This slide shows dashboard which can be used by organizations to measure the results of sales plan. It includes metrics such as sales per product, actual vs target sales, sales by region, sales by channel, etc. Boost your pitch with our creative Boosting Yearly Business Revenue KPI Dashboard To Track Sales Plan Performance Topics PDF. Deliver an awe-inspiring pitch that will mesmerize everyone. Using these presentation templates you will surely catch everyones attention. You can browse the ppts collection on our website. We have researchers who are experts at creating the right content for the templates. So you dont have to invest time in any additional work. Just grab the template now and use them.
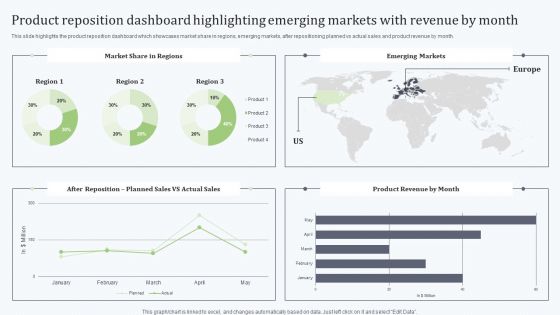
Deploying Revitalization Strategy Enhance Product And Service Sales Product Reposition Dashboard Highlighting Brochure PDF
This slide highlights the product reposition dashboard which showcases market share in regions, emerging markets, after repositioning planned vs actual sales and product revenue by month. Do you have an important presentation coming up Are you looking for something that will make your presentation stand out from the rest Look no further than Deploying Revitalization Strategy Enhance Product And Service Sales Product Reposition Dashboard Highlighting Brochure PDF. With our professional designs, you can trust that your presentation will pop and make delivering it a smooth process. And with Slidegeeks, you can trust that your presentation will be unique and memorable. So why wait Grab Deploying Revitalization Strategy Enhance Product And Service Sales Product Reposition Dashboard Highlighting Brochure PDF today and make your presentation stand out from the rest.
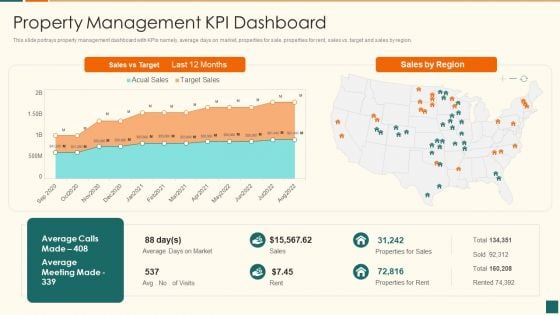
Developing Marketing Campaign For Real Estate Project Property Management Kpi Dashboard Formats PDF
This slide portrays property management dashboard with KPIs namely, average days on market, properties for sale, properties for rent, sales vs. target and sales by region. Deliver and pitch your topic in the best possible manner with this developing marketing campaign for real estate project property management kpi dashboard formats pdf. Use them to share invaluable insights on sales vs target, sales by region and impress your audience. This template can be altered and modified as per your expectations. So, grab it now.
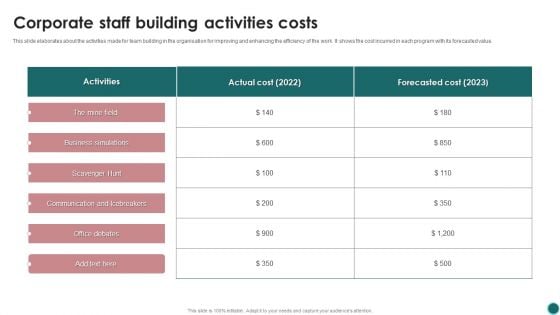
Corporate Staff Building Activities Costs Ppt PowerPoint Presentation File Designs Download PDF
This slide elaborates about the activities made for team building in the organisation for improving and enhancing the efficiency of the work. It shows the cost incurred in each program with its forecasted value. Showcasing this set of slides titled Corporate Staff Building Activities Costs Ppt PowerPoint Presentation File Designs Download PDF. The topics addressed in these templates are Actual Cost 2022, Forecasted Cost 2023, Business Simulations. All the content presented in this PPT design is completely editable. Download it and make adjustments in color, background, font etc. as per your unique business setting.
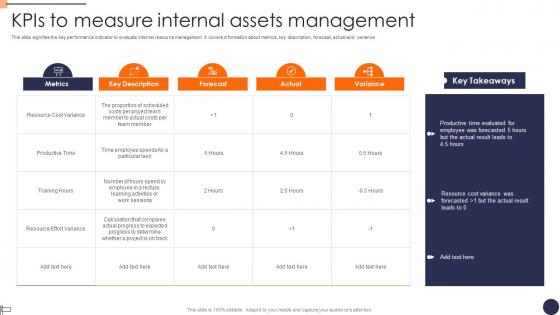
Kpis To Measure Internal Assets Management Diagrams Pdf
This slide signifies the key performance indicator to evaluate internal resource management. It covers information about metrics, key description, forecast, actual and variance. Pitch your topic with ease and precision using this Kpis To Measure Internal Assets Management Diagrams Pdf. This layout presents information on About Metrics, Key Description, Forecast. It is also available for immediate download and adjustment. So, changes can be made in the color, design, graphics or any other component to create a unique layout. This slide signifies the key performance indicator to evaluate internal resource management. It covers information about metrics, key description, forecast, actual and variance.
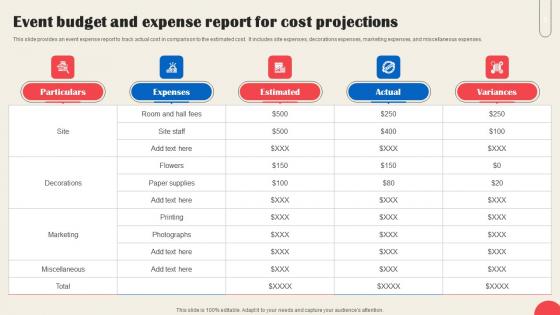
Event Budget And Expense Report For Cost Projections Professional Pdf
This slide provides an event expense report to track actual cost in comparison to the estimated cost. It includes site expenses, decorations expenses, marketing expenses, and miscellaneous expenses. Showcasing this set of slides titled Event Budget And Expense Report For Cost Projections Professional Pdf The topics addressed in these templates are Particulars, Expenses, Estimated, Variances All the content presented in this PPT design is completely editable. Download it and make adjustments in color, background, font etc. as per your unique business setting. This slide provides an event expense report to track actual cost in comparison to the estimated cost. It includes site expenses, decorations expenses, marketing expenses, and miscellaneous expenses.
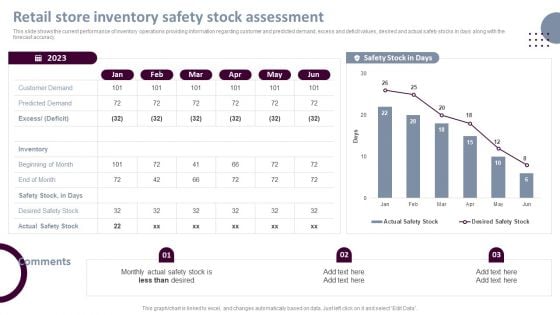
Retail Store Operations Retail Store Inventory Safety Stock Assessment Background PDF
This slide shows the current performance of inventory operations providing information regarding customer and predicted demand, excess and deficit values, desired and actual safety stocks in days along with the forecast accuracy. If you are looking for a format to display your unique thoughts, then the professionally designed Retail Store Operations Retail Store Inventory Safety Stock Assessment Background PDF is the one for you. You can use it as a Google Slides template or a PowerPoint template. Incorporate impressive visuals, symbols, images, and other charts. Modify or reorganize the text boxes as you desire. Experiment with shade schemes and font pairings. Alter, share or cooperate with other people on your work. Download Retail Store Operations Retail Store Inventory Safety Stock Assessment Background PDF and find out how to give a successful presentation. Present a perfect display to your team and make your presentation unforgettable.

Budget For Text Analytics Integration In Business PPT Powerpoint SS
This slide outlines the budget allocation for integrating text analytics in an organization, covering expense categories, estimated and actual budget. If your project calls for a presentation, then Slidegeeks is your go-to partner because we have professionally designed, easy-to-edit templates that are perfect for any presentation. After downloading, you can easily edit Budget For Text Analytics Integration In Business PPT Powerpoint SS and make the changes accordingly. You can rearrange slides or fill them with different images. Check out all the handy templates This slide outlines the budget allocation for integrating text analytics in an organization, covering expense categories, estimated and actual budget.
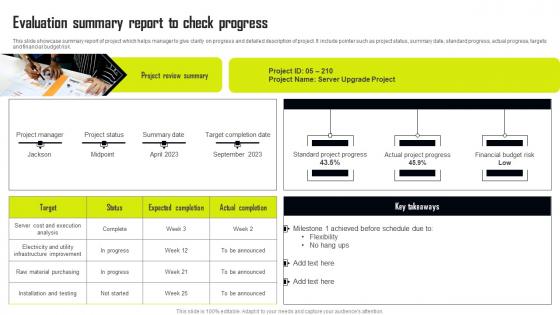
Evaluation Summary Report To Check Progress Download Pdf
This slide showcase summary report of project which helps manager to give clarity on progress and detailed description of project. It include pointer such as project status, summary date, standard progress, actual progress, targets and financial budget risk. Pitch your topic with ease and precision using this Evaluation Summary Report To Check Progress Download Pdf This layout presents information on Project Review Summary, Expected Completion, Actual Completion It is also available for immediate download and adjustment. So, changes can be made in the color, design, graphics or any other component to create a unique layout. This slide showcase summary report of project which helps manager to give clarity on progress and detailed description of project. It include pointer such as project status, summary date, standard progress, actual progress, targets and financial budget risk.
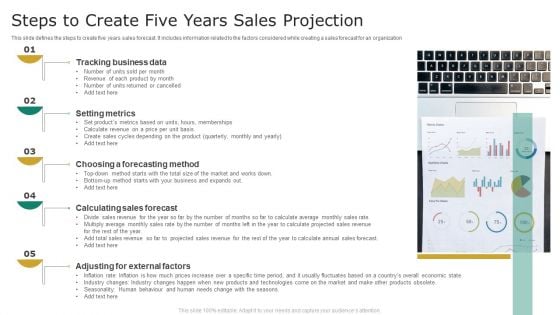
Steps To Create Five Years Sales Projection Ideas PDF
This slide defines the steps to create five years sales forecast. It includes information related to the factors considered while creating a sales forecast for an organization. Persuade your audience using this Steps To Create Five Years Sales Projection Ideas PDF. This PPT design covers five stages, thus making it a great tool to use. It also caters to a variety of topics including Setting Metrics, Tracking Business Data, Calculating Sales Forecast. Download this PPT design now to present a convincing pitch that not only emphasizes the topic but also showcases your presentation skills.

Power Management System And Technology KPI Metrics Production Ppt PowerPoint Presentation Styles Maker PDF
Presenting this set of slides with name power management system and technology kpi metrics production ppt powerpoint presentation styles maker pdf. The topics discussed in these slides are actual vs, expected energy production, average performance ratio, biomass, coal, hydro energy, nuclear, petroleum, solar, wind. This is a completely editable PowerPoint presentation and is available for immediate download. Download now and impress your audience.
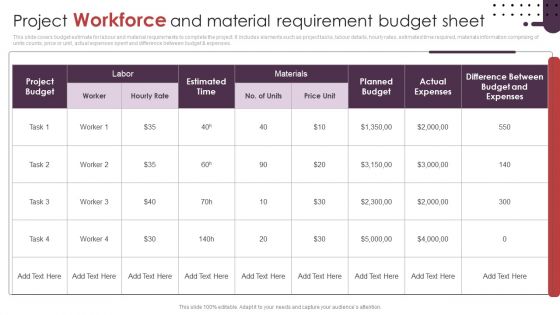
Project Workforce And Material Requirement Budget Sheet Ppt Show Display PDF
This slide covers budget estimate for labour and material requirements to complete the project. It includes elements such as project tasks, labour details, hourly rates, estimated time required, materials information comprising of units counts, price or unit, actual expenses spent and difference between budget and expenses. Showcasing this set of slides titled Project Workforce And Material Requirement Budget Sheet Ppt Show Display PDF. The topics addressed in these templates are Estimated Time, Planned Budget, Actual Expenses. All the content presented in this PPT design is completely editable. Download it and make adjustments in color, background, font etc. as per your unique business setting.
Client Self Service Key Performance Indicators Icons Pdf
The following slide highlights key performance indicators of customer self service to offer enterprises actual and desired cost of support, measure efficiency etc. It includes key performance indicators such as net promoter score, customer effort score, self-service re-contact rate, conversion ratio and case deflection rate. Pitch your topic with ease and precision using this Client Self Service Key Performance Indicators Icons Pdf. This layout presents information on Description, Target, Actual. It is also available for immediate download and adjustment. So, changes can be made in the color, design, graphics or any other component to create a unique layout. The following slide highlights key performance indicators of customer self service to offer enterprises actual and desired cost of support, measure efficiency etc. It includes key performance indicators such as net promoter score, customer effort score, self-service re-contact rate, conversion ratio and case deflection rate.
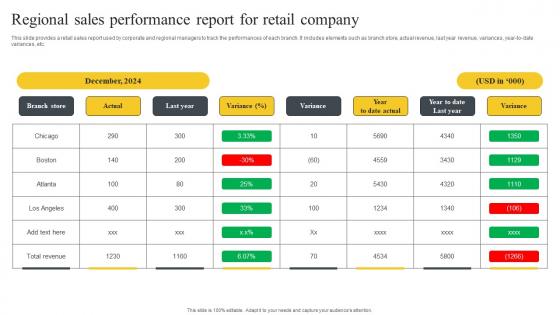
Regional Sales Performance Report For Retail Company Designs Pdf
This slide provides a retail sales report used by corporate and regional managers to track the performances of each branch. It includes elements such as branch store, actual revenue, last year revenue, variances, year-to-date variances, etc. Showcasing this set of slides titled Regional Sales Performance Report For Retail Company Designs Pdf. The topics addressed in these templates are Branch Store, Actual, Last Year. All the content presented in this PPT design is completely editable. Download it and make adjustments in color, background, font etc. as per your unique business setting. This slide provides a retail sales report used by corporate and regional managers to track the performances of each branch. It includes elements such as branch store, actual revenue, last year revenue, variances, year-to-date variances, etc.


 Continue with Email

 Home
Home


