Forecast
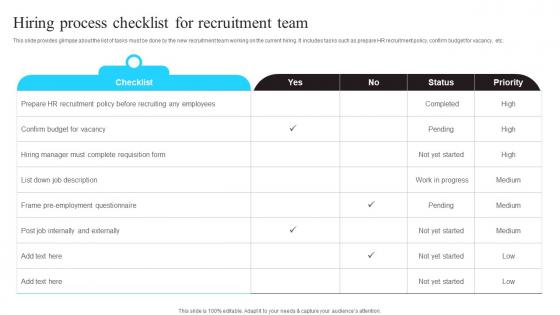
Hiring Process Checklist For Recruitment Team Enhancing Workforce Productivity Introduction Pdf
This slide provides glimpse about the list of tasks must be done by the new recruitment team working on the current hiring. It includes tasks such as prepare HR recruitment policy,confirm budget for vacancy,etc.Slidegeeks is here to make your presentations a breeze with Hiring Process Checklist For Recruitment Team Enhancing Workforce Productivity Introduction Pdf With our easy-to-use and customizable templates,you can focus on delivering your ideas rather than worrying about formatting. With a variety of designs to choose from,you are sure to find one that suits your needs. And with animations and unique photos,illustrations,and fonts,you can make your presentation pop. So whether you are giving a sales pitch or presenting to the board,make sure to check out Slidegeeks first. This slide provides glimpse about the list of tasks must be done by the new recruitment team working on the current hiring. It includes tasks such as prepare HR recruitment policy, confirm budget for vacancy, etc.
Statistical Modeling Project Ppt Powerpoint Presentation Complete Deck With Slides
This Statistical Modeling Project Ppt Powerpoint Presentation Complete Deck With Slides acts as backup support for your ideas, vision, thoughts, etc. Use it to present a thorough understanding of the topic. This PPT slideshow can be utilized for both in-house and outside presentations depending upon your needs and business demands. Entailing eighteen slides with a consistent design and theme, this template will make a solid use case. As it is intuitively designed, it suits every business vertical and industry. All you have to do is make a few tweaks in the content or any other component to design unique presentations. The biggest advantage of this complete deck is that it can be personalized multiple times once downloaded. The color, design, shapes, and other elements are free to modify to add personal touches. You can also insert your logo design in this PPT layout. Therefore a well-thought and crafted presentation can be delivered with ease and precision by downloading this Statistical Modeling Project Ppt Powerpoint Presentation Complete Deck With Slides PPT slideshow. Our Statistical Modeling Project Ppt Powerpoint Presentation Complete Deck With Slides are topically designed to provide an attractive backdrop to any subject. Use them to look like a presentation pro.
Survey Results Depicting Problems Building Utility Billing And Invoicing Management System Icons Pdf
Following slide shows survey results to understand challenges in company billing system. It include pointers such as management issue, data manipulation, complexity, reporting concern etc. This Survey Results Depicting Problems Building Utility Billing And Invoicing Management System Icons Pdf from Slidegeeks makes it easy to present information on your topic with precision. It provides customization options, so you can make changes to the colors, design, graphics, or any other component to create a unique layout. It is also available for immediate download, so you can begin using it right away. Slidegeeks has done good research to ensure that you have everything you need to make your presentation stand out. Make a name out there for a brilliant performance. Following slide shows survey results to understand challenges in company billing system. It include pointers such as management issue, data manipulation, complexity, reporting concern etc.
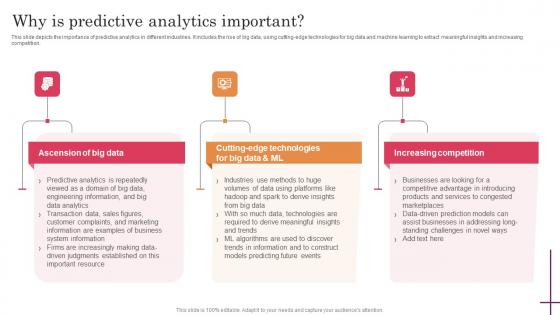
Why Is Predictive Analytics Important Predictive Analytics For Improved Guidelines Pdf
This slide depicts the importance of predictive analytics in different industries. It includes the rise of big data, using cutting-edge technologies for big data and machine learning to extract meaningful insights and increasing competition. If your project calls for a presentation, then Slidegeeks is your go-to partner because we have professionally designed, easy-to-edit templates that are perfect for any presentation. After downloading, you can easily edit Why Is Predictive Analytics Important Predictive Analytics For Improved Guidelines Pdf and make the changes accordingly. You can rearrange slides or fill them with different images. Check out all the handy templates This slide depicts the importance of predictive analytics in different industries. It includes the rise of big data, using cutting-edge technologies for big data and machine learning to extract meaningful insights and increasing competition.

Key Factors Affecting Budget For Acquiring New Customers Estimation Information Pdf
This slide showcases various factors which influence determination of customer acquisition cost which helps in effective estimation of cost per lead customer. It provides information such as advertising costs, employee expenses, technical costs and production costs. Pitch your topic with ease and precision using this Key Factors Affecting Budget For Acquiring New Customers Estimation Information Pdf. This layout presents information on Advertising Costs, Employee Expenses, Technical Costs. It is also available for immediate download and adjustment. So, changes can be made in the color, design, graphics or any other component to create a unique layout. This slide showcases various factors which influence determination of customer acquisition cost which helps in effective estimation of cost per lead customer. It provides information such as advertising costs, employee expenses, technical costs and production costs.
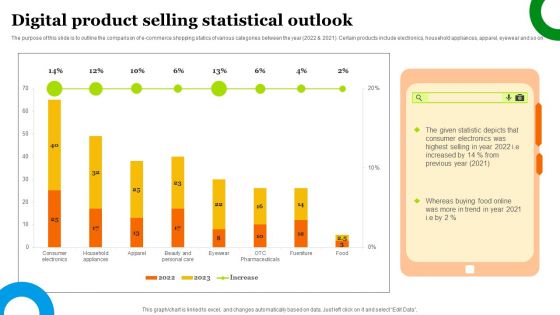
Digital Product Selling Statistical Outlook Guidelines PDF
The purpose of this slide is to outline the comparison of e-commerce shopping statics of various categories between the year 2022 and 2021. Certain products include electronics, household appliances, apparel, eyewear and so on. Pitch your topic with ease and precision using this Digital Product Selling Statistical Outlook Guidelines PDF. This layout presents information on Digital Product, Selling Statistical Outlook. It is also available for immediate download and adjustment. So, changes can be made in the color, design, graphics or any other component to create a unique layout.
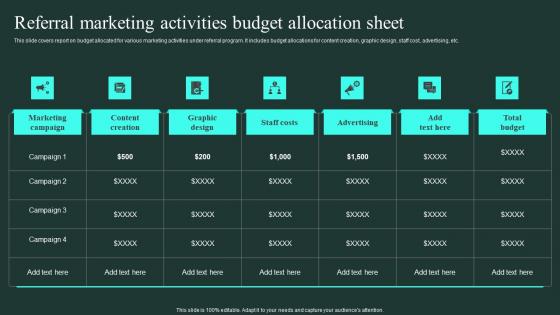
Referral Marketing Activities Budget Allocation Sheet Word Of Mouth Marketing Brochure Pdf
This slide covers report on budget allocated for various marketing activities under referral program. It includes budget allocations for content creation, graphic design, staff cost, advertising, etc.Are you searching for a Referral Marketing Activities Budget Allocation Sheet Word Of Mouth Marketing Brochure Pdf that is uncluttered, straightforward, and original Its easy to edit, and you can change the colors to suit your personal or business branding. For a presentation that expresses how much effort you have put in, this template is ideal. With all of its features, including tables, diagrams, statistics, and lists, its perfect for a business plan presentation. Make your ideas more appealing with these professional slides. Download Referral Marketing Activities Budget Allocation Sheet Word Of Mouth Marketing Brochure Pdf from Slidegeeks today. This slide covers report on budget allocated for various marketing activities under referral program. It includes budget allocations for content creation, graphic design, staff cost, advertising, etc.
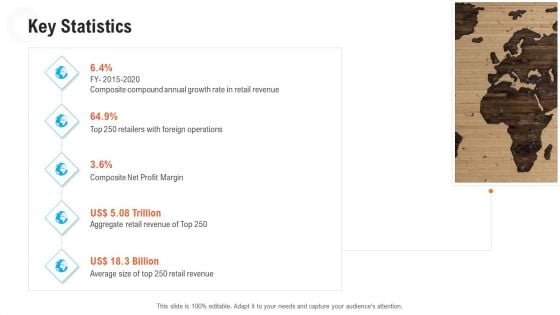
Retail Industry Outlook Key Statistics Template PDF
Deliver an awe-inspiring pitch with this creative retail industry outlook key statistics template pdf. bundle. Topics like composite net profit margin, aggregate retail revenue can be discussed with this completely editable template. It is available for immediate download depending on the needs and requirements of the user.
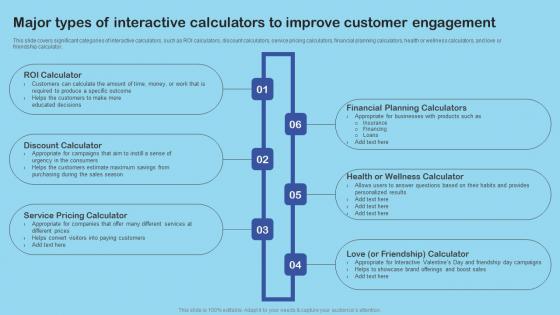
Major Types Of Interactive Calculators Enhance Client Engagement With Interactive Advertising Diagrams Pdf
This slide covers significant categories of interactive calculators, such as ROI calculators, discount calculators, service pricing calculators, financial planning calculators, health or wellness calculators, and love or friendship calculator. Slidegeeks has constructed Major Types Of Interactive Calculators Enhance Client Engagement With Interactive Advertising Diagrams Pdf after conducting extensive research and examination. These presentation templates are constantly being generated and modified based on user preferences and critiques from editors. Here, you will find the most attractive templates for a range of purposes while taking into account ratings and remarks from users regarding the content. This is an excellent jumping off point to explore our content and will give new users an insight into our top notch PowerPoint Templates. This slide covers significant categories of interactive calculators, such as ROI calculators, discount calculators, service pricing calculators, financial planning calculators, health or wellness calculators, and love or friendship calculator.
Date Difference Calculator In Powerpoint And Google Slides Cpb
Presenting our innovatively-designed set of slides titled Date Difference Calculator In Powerpoint And Google Slides Cpb. This completely editable PowerPoint graphic exhibits Date Difference Calculator that will help you convey the message impactfully. It can be accessed with Google Slides and is available in both standard screen and widescreen aspect ratios. Apart from this, you can download this well-structured PowerPoint template design in different formats like PDF, JPG, and PNG. So, click the download button now to gain full access to this PPT design. Our Date Difference Calculator In Powerpoint And Google Slides Cpb are topically designed to provide an attractive backdrop to any subject. Use them to look like a presentation pro.
AI Model To Calculate Probability Of Debt Payment Rules Pdf
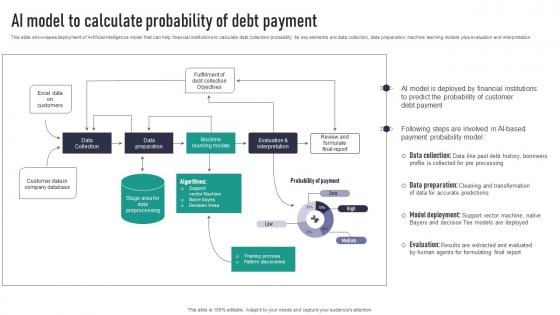
This slide showcases deployment of Artificial intelligence model that can help financial institutions to calculate debt collection probability. Its key elements are data collection, data preparation, machine learning models plus evaluation and interpretation. Crafting an eye-catching presentation has never been more straightforward. Let your presentation shine with this tasteful yet straightforward AI Model To Calculate Probability Of Debt Payment Rules Pdf template. It offers a minimalistic and classy look that is great for making a statement. The colors have been employed intelligently to add a bit of playfulness while still remaining professional. Construct the ideal AI Model To Calculate Probability Of Debt Payment Rules Pdf that effortlessly grabs the attention of your audience Begin now and be certain to wow your customers This slide showcases deployment of Artificial intelligence model that can help financial institutions to calculate debt collection probability. Its key elements are data collection, data preparation, machine learning models plus evaluation and interpretation.
Predictive Analytics In Predictive Maintenance Predictive Analytics For Improved Professional Pdf
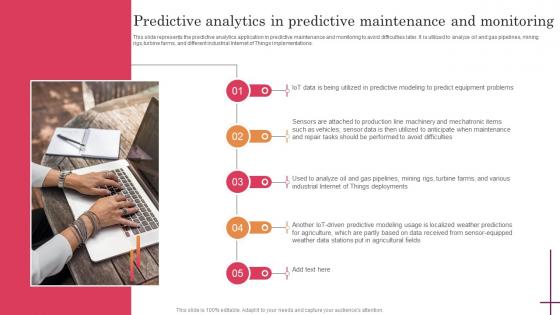
This slide represents the predictive analytics application in predictive maintenance and monitoring to avoid difficulties later. It is utilized to analyze oil and gas pipelines, mining rigs,turbine farms, and different industrial Internet of Things implementations. Slidegeeks has constructed Predictive Analytics In Predictive Maintenance Predictive Analytics For Improved Professional Pdf after conducting extensive research and examination. These presentation templates are constantly being generated and modified based on user preferences and critiques from editors. Here, you will find the most attractive templates for a range of purposes while taking into account ratings and remarks from users regarding the content. This is an excellent jumping-off point to explore our content and will give new users an insight into our top-notch PowerPoint Templates. This slide represents the predictive analytics application in predictive maintenance and monitoring to avoid difficulties later. It is utilized to analyze oil and gas pipelines, mining rigs,turbine farms, and different industrial Internet of Things implementations.
Predictive Analytics For Empowering Predictive Analytics In Predictive Maintenance Microsoft Pdf
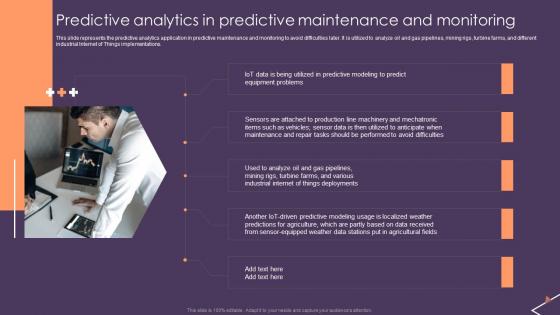
This slide represents the predictive analytics application in predictive maintenance and monitoring to avoid difficulties later. It is utilized to analyze oil and gas pipelines, mining rigs, turbine farms, and different industrial Internet of Things implementations. The Predictive Analytics For Empowering Predictive Analytics In Predictive Maintenance Microsoft Pdf is a compilation of the most recent design trends as a series of slides. It is suitable for any subject or industry presentation, containing attractive visuals and photo spots for businesses to clearly express their messages. This template contains a variety of slides for the user to input data, such as structures to contrast two elements, bullet points, and slides for written information. Slidegeeks is prepared to create an impression. This slide represents the predictive analytics application in predictive maintenance and monitoring to avoid difficulties later. It is utilized to analyze oil and gas pipelines, mining rigs, turbine farms, and different industrial Internet of Things implementations.
Tasks For Business Project Plans Ppt Software PowerPoint Templates
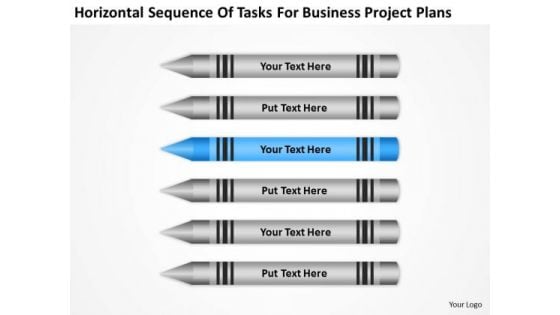
We present our tasks for business project plans ppt software PowerPoint templates.Use our Process and Flows PowerPoint Templates because You can Be the star of the show with our PowerPoint Templates and Slides. Rock the stage with your ideas. Download our Education PowerPoint Templates because Our PowerPoint Templates and Slides will let you Illuminate the road ahead to Pinpoint the important landmarks along the way. Download and present our Arrows PowerPoint Templates because You can Hit the nail on the head with our PowerPoint Templates and Slides. Embed your ideas in the minds of your audience. Use our Shapes PowerPoint Templates because Our PowerPoint Templates and Slides are the chords of your song. String them along and provide the lilt to your views. Use our Business PowerPoint Templates because Our PowerPoint Templates and Slides come in all colours, shades and hues. They help highlight every nuance of your views.Use these PowerPoint slides for presentations relating to Mark, corporate, business, plan, concept, bright, symbol, diagram, crayon, stack, graphic, finance, stock,analysis, drawing, paint, calculation, accounting, creative, economic, creativity, chart, forecast, design, color, objects, stationary, pencil, education,profit, information, investment, figures, ten, business, business process. The prominent colors used in the PowerPoint template are Gray, Blue, Black. Have nothing to fear with our Tasks For Business Project Plans Ppt Software PowerPoint Templates. Just download, type and present.
Tasks For Business Project Plans Ppt Writing Dummies PowerPoint Slides
We present our tasks for business project plans ppt writing dummies PowerPoint Slides.Present our Flow Charts PowerPoint Templates because Your ideas provide food for thought. Our PowerPoint Templates and Slides will help you create a dish to tickle the most discerning palate. Download and present our Process and Flows PowerPoint Templates because Our PowerPoint Templates and Slides provide you with a vast range of viable options. Select the appropriate ones and just fill in your text. Download and present our Education PowerPoint Templates because You can Be the puppeteer with our PowerPoint Templates and Slides as your strings. Lead your team through the steps of your script. Use our Arrows PowerPoint Templates because Our PowerPoint Templates and Slides will provide you the cutting edge. Slice through the doubts in the minds of your listeners. Use our Shapes PowerPoint Templates because Our PowerPoint Templates and Slides will let you Hit the target. Go the full distance with ease and elan.Use these PowerPoint slides for presentations relating to Mark, corporate, business, plan, concept, bright, symbol, diagram, crayon, stack, graphic, finance, stock,analysis, drawing, paint, calculation, accounting, creative, economic, creativity, chart, forecast, design, color, objects, stationary, pencil, education,profit, information, investment, figures, ten, business, business process. The prominent colors used in the PowerPoint template are Green, Gray, Black. Attract the creme-de-la-creme with our Tasks For Business Project Plans Ppt Writing Dummies PowerPoint Slides. Give the elite an exclusive experience.
4 Stages Circular Stacked Business Process Flow Create Plan PowerPoint Slides
We present our 4 stages circular stacked business process flow create plan PowerPoint Slides.Present our Arrows PowerPoint Templates because They will Put the wind in your sails. Skim smoothly over the choppy waters of the market. Download and present our Flow Charts PowerPoint Templates because Our PowerPoint Templates and Slides will fulfill your every need. Use them and effectively satisfy the desires of your audience. Download our Business PowerPoint Templates because You are an avid believer in ethical practices. Highlight the benefits that accrue with our PowerPoint Templates and Slides. Download and present our Marketing PowerPoint Templates because Our PowerPoint Templates and Slides are conceived by a dedicated team. Use them and give form to your wondrous ideas. Download our Process and Flows PowerPoint Templates because It will mark the footprints of your journey. Illustrate how they will lead you to your desired destination.Use these PowerPoint slides for presentations relating to Arrow, graph, chart, vector, color, leadership, leader, isolated, lock, forward, achievement, red, business, plan, concept, internet, circle, development,abstract, illustration, send, sparse, forecast, direction, group, growth, moving, competition, outlook, arrow, able, education,career, profit, increase, path, investment, higher, searching, aim, gradient, financial, onwards, prediction, communication, arrow sign. The prominent colors used in the PowerPoint template are Green, Black, White. Increase viewership with our 4 Stages Circular Stacked Business Process Flow Create Plan PowerPoint Slides. Make sure your presentation gets the attention it deserves.
Calculate Respiratory Rate In Powerpoint And Google Slides Cpb
Introducing our well-designed Calculate Respiratory Rate In Powerpoint And Google Slides Cpb. This PowerPoint design presents information on topics like Calculate Respiratory Rate. As it is predesigned it helps boost your confidence level. It also makes you a better presenter because of its high-quality content and graphics. This PPT layout can be downloaded and used in different formats like PDF, PNG, and JPG. Not only this, it is available in both Standard Screen and Widescreen aspect ratios for your convenience. Therefore, click on the download button now to persuade and impress your audience. Our Calculate Respiratory Rate In Powerpoint And Google Slides Cpb are topically designed to provide an attractive backdrop to any subject. Use them to look like a presentation pro.
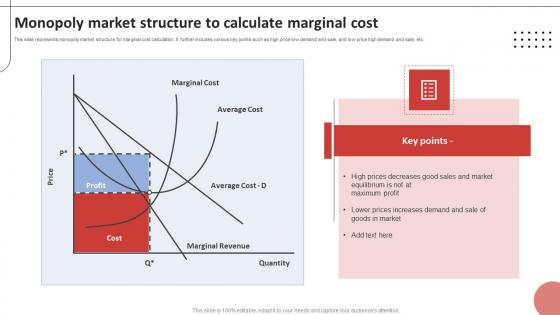
Monopoly Market Structure To Calculate Marginal Cost Information Pdf
This slide represents monopoly market structure for marginal cost calculation. It further includes various key points such as high price low demand and sale, and low price high demand and sale, etc.Pitch your topic with ease and precision using this Monopoly Market Structure To Calculate Marginal Cost Information Pdf This layout presents information on Goods Market, Increases Demand, High Decreases It is also available for immediate download and adjustment. So, changes can be made in the color, design, graphics or any other component to create a unique layout. This slide represents monopoly market structure for marginal cost calculation. It further includes various key points such as high price low demand and sale, and low price high demand and sale, etc.
Steroid Conversion Calculator In Powerpoint And Google Slides Cpb
Introducing our well designed Steroid Conversion Calculator In Powerpoint And Google Slides Cpb. This PowerPoint design presents information on topics like Steroid Conversion Calculator. As it is predesigned it helps boost your confidence level. It also makes you a better presenter because of its high quality content and graphics. This PPT layout can be downloaded and used in different formats like PDF, PNG, and JPG. Not only this, it is available in both Standard Screen and Widescreen aspect ratios for your convenience. Therefore, click on the download button now to persuade and impress your audience. Our Steroid Conversion Calculator In Powerpoint And Google Slides Cpb are topically designed to provide an attractive backdrop to any subject. Use them to look like a presentation pro.

Daily Water Intake Calculator In Powerpoint And Google Slides Cpb
Introducing our well designed Daily Water Intake Calculator In Powerpoint And Google Slides Cpb. This PowerPoint design presents information on topics like Daily Water Intake Calculator. As it is predesigned it helps boost your confidence level. It also makes you a better presenter because of its high quality content and graphics. This PPT layout can be downloaded and used in different formats like PDF, PNG, and JPG. Not only this, it is available in both Standard Screen and Widescreen aspect ratios for your convenience. Therefore, click on the download button now to persuade and impress your audience. Our Daily Water Intake Calculator In Powerpoint And Google Slides Cpb are topically designed to provide an attractive backdrop to any subject. Use them to look like a presentation pro.
Calories Calculator Weight Gain In Powerpoint And Google Slides Cpb
Presenting our innovatively designed set of slides titled Calories Calculator Weight Gain In Powerpoint And Google Slides Cpb. This completely editable PowerPoint graphic exhibits Calories Calculator Weight Gain that will help you convey the message impactfully. It can be accessed with Google Slides and is available in both standard screen and widescreen aspect ratios. Apart from this, you can download this well structured PowerPoint template design in different formats like PDF, JPG, and PNG. So, click the download button now to gain full access to this PPT design. Our Calories Calculator Weight Gain In Powerpoint And Google Slides Cpb are topically designed to provide an attractive backdrop to any subject. Use them to look like a presentation pro.
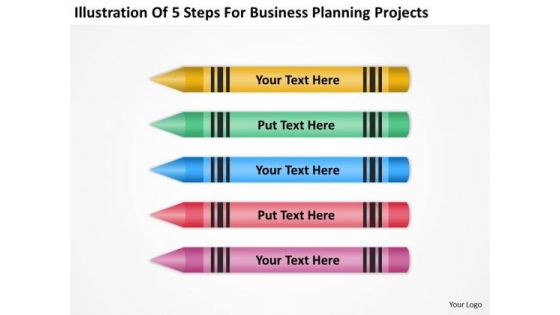
5 Steps For Business Planning Projects Ppt Sample Outline PowerPoint Slides
We present our 5 steps for business planning projects ppt sample outline PowerPoint Slides.Download our Business PowerPoint Templates because You can Be the star of the show with our PowerPoint Templates and Slides. Rock the stage with your ideas. Present our Flow Charts PowerPoint Templates because It will get your audience in sync. Download our Shapes PowerPoint Templates because You should Throw the gauntlet with our PowerPoint Templates and Slides. They are created to take up any challenge. Download our Marketing PowerPoint Templates because It will let you Set new benchmarks with our PowerPoint Templates and Slides. They will keep your prospects well above par. Use our Process and Flows PowerPoint Templates because You should Press the right buttons with our PowerPoint Templates and Slides. They will take your ideas down the perfect channel.Use these PowerPoint slides for presentations relating to Mark, corporate, business, plan, concept, bright, symbol, diagram, crayon, stack, graphic, finance, stock,analysis, drawing, paint, calculation, accounting, creative, economic, creativity, chart, forecast, design, color, objects, stationary, pencil, education,profit, information, background, investment, figures, rainbow, business, business process. The prominent colors used in the PowerPoint template are Yellow, Blue, Red. Run your eyes over our 5 Steps For Business Planning Projects Ppt Sample Outline PowerPoint Slides. They will appeal at the first examination.
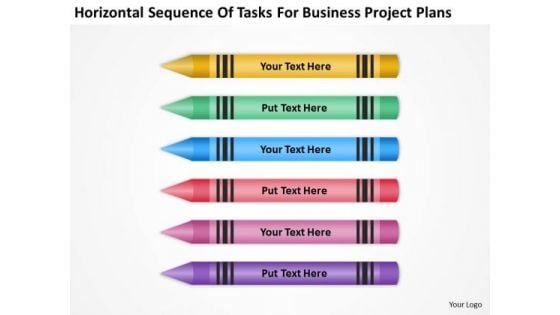
Sequence Of Tasks For Business Project Plans Ppt Small Planning PowerPoint Slides
We present our sequence of tasks for business project plans ppt small planning PowerPoint Slides.Download and present our Business PowerPoint Templates because Our PowerPoint Templates and Slides will let you Clearly mark the path for others to follow. Download our Flow Charts PowerPoint Templates because Our PowerPoint Templates and Slides come in all colours, shades and hues. They help highlight every nuance of your views. Use our Shapes PowerPoint Templates because you can Set pulses racing with our PowerPoint Templates and Slides. They will raise the expectations of your team. Download our Marketing PowerPoint Templates because Our PowerPoint Templates and Slides are topically designed to provide an attractive backdrop to any subject. Use our Process and Flows PowerPoint Templates because Our PowerPoint Templates and Slides are effectively colour coded to prioritise your plans They automatically highlight the sequence of events you desire.Use these PowerPoint slides for presentations relating to Mark, corporate, business, plan, concept, bright, symbol, diagram, crayon, stack, graphic, finance, stock,analysis, drawing, paint, calculation, accounting, creative, economic, creativity, chart, forecast, design, color, objects, stationary, pencil, education,profit, information, background, investment, figures, rainbow, business, business process. The prominent colors used in the PowerPoint template are Yellow, Blue, Red. Animate your thoughts with our Sequence Of Tasks For Business Project Plans Ppt Small Planning PowerPoint Slides. Breathe energy into your words.
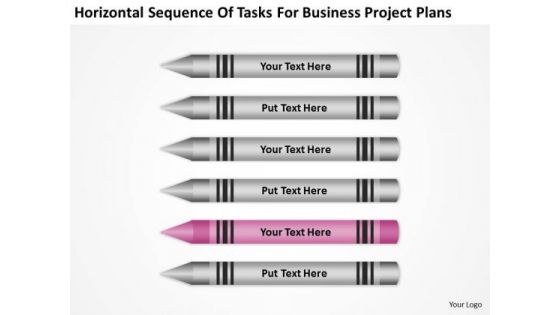
Tasks For Business Project Plans Ppt How To Create PowerPoint Templates
We present our tasks for business project plans ppt how to create PowerPoint templates.Use our Education PowerPoint Templates because Our PowerPoint Templates and Slides will give good value for money. They also have respect for the value of your time. Download our Arrows PowerPoint Templates because They will Put the wind in your sails. Skim smoothly over the choppy waters of the market. Present our Process and Flows PowerPoint Templates because Our PowerPoint Templates and Slides are the chords of your song. String them along and provide the lilt to your views. Present our Business PowerPoint Templates because It is Aesthetically crafted by artistic young minds. Our PowerPoint Templates and Slides are designed to display your dexterity. Present our Shapes PowerPoint Templates because Our PowerPoint Templates and Slides will provide you the cutting edge. Slice through the doubts in the minds of your listeners.Use these PowerPoint slides for presentations relating to Mark, corporate, business, plan, concept, bright, symbol, diagram, crayon, stack, graphic, finance, stock,analysis, drawing, paint, calculation, accounting, creative, economic, creativity, chart, forecast, design, color, objects, stationary, pencil, education,profit, information, investment, figures, ten, business, business process. The prominent colors used in the PowerPoint template are Pink, Gray, Black. Exult in the happiness of your performance. Convey your emotions through our Tasks For Business Project Plans Ppt How To Create PowerPoint Templates.

Process To Calculate Inflation Rate Using GDP Comprehensive Guide On Inflation Control CM SS V
This slide shows step by step process which can be used to calculate inflation rate by using GDP deflator. It includes stages such as select year, calculate nominal and real GPD, calculate GDP deflator and interpret results. Want to ace your presentation in front of a live audience Our Process To Calculate Inflation Rate Using GDP Comprehensive Guide On Inflation Control CM SS V can help you do that by engaging all the users towards you. Slidegeeks experts have put their efforts and expertise into creating these impeccable powerpoint presentations so that you can communicate your ideas clearly. Moreover, all the templates are customizable, and easy-to-edit and downloadable. Use these for both personal and commercial use. This slide shows step by step process which can be used to calculate inflation rate by using GDP deflator. It includes stages such as select year, calculate nominal and real GPD, calculate GDP deflator and interpret results.
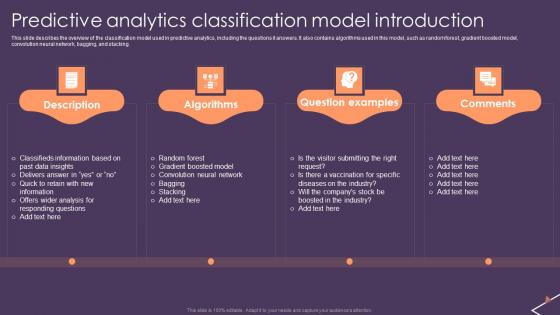
Predictive Analytics For Empowering Predictive Analytics Classification Model Information Pdf
This slide describes the overview of the classification model used in predictive analytics, including the questions it answers. It also contains algorithms used in this model, such as random forest, gradient boosted model, convolution neural network, bagging, and stacking. If you are looking for a format to display your unique thoughts, then the professionally designed Predictive Analytics For Empowering Predictive Analytics Classification Model Information Pdf is the one for you. You can use it as a Google Slides template or a PowerPoint template. Incorporate impressive visuals, symbols, images, and other charts. Modify or reorganize the text boxes as you desire. Experiment with shade schemes and font pairings. Alter, share or cooperate with other people on your work. Download Predictive Analytics For Empowering Predictive Analytics Classification Model Information Pdf and find out how to give a successful presentation. Present a perfect display to your team and make your presentation unforgettable. This slide describes the overview of the classification model used in predictive analytics, including the questions it answers. It also contains algorithms used in this model, such as random forest, gradient boosted model, convolution neural network, bagging, and stacking.
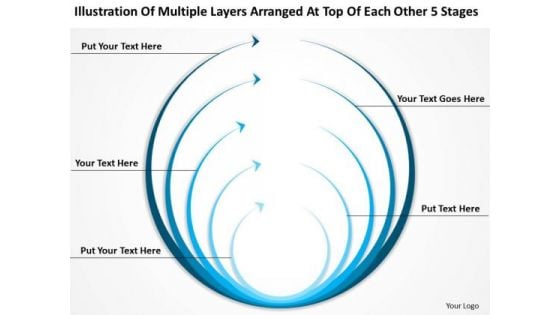
Multiple Layers Arranged At Top Each Other 5 Stages Business Plan Draft PowerPoint Templates
We present our multiple layers arranged at top each other 5 stages business plan draft PowerPoint templates.Download and present our Arrows PowerPoint Templates because Our PowerPoint Templates and Slides will weave a web of your great ideas. They are gauranteed to attract even the most critical of your colleagues. Present our Flow Charts PowerPoint Templates because Our PowerPoint Templates and Slides are Clear and concise. Use them and dispel any doubts your team may have. Download and present our Business PowerPoint Templates because Our PowerPoint Templates and Slides will give good value for money. They also have respect for the value of your time. Download our Marketing PowerPoint Templates because Our PowerPoint Templates and Slides will let your ideas bloom. Create a bed of roses for your audience. Use our Process and Flows PowerPoint Templates because you should Whip up a frenzy with our PowerPoint Templates and Slides. They will fuel the excitement of your team.Use these PowerPoint slides for presentations relating to Arrow, graph, chart, vector, color, leadership, leader, isolated, lock, forward, achievement, red, business, plan, concept, internet, circle, development,abstract, illustration, send, sparse, forecast, direction, group, growth, moving, competition, outlook, arrow, able, education,career, profit, increase, path, investment, higher, searching, aim, gradient, financial, onwards, prediction, communication, arrow sign. The prominent colors used in the PowerPoint template are Blue light, Blue, White. Lecture teams with our Multiple Layers Arranged At Top Each Other 5 Stages Business Plan Draft PowerPoint Templates. Download without worries with our money back guaranteee.
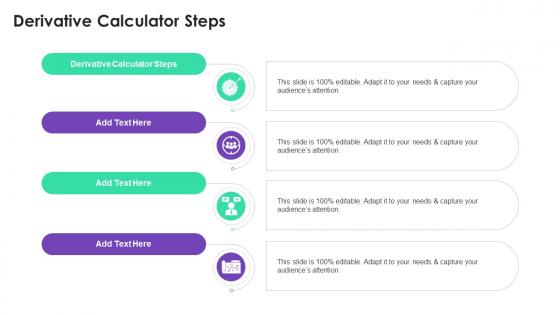
Derivative Calculator Steps In Powerpoint And Google Slides Cpb
Presenting our innovatively-designed set of slides titled Derivative Calculator Steps In Powerpoint And Google Slides Cpb. This completely editable PowerPoint graphic exhibits Dance Benefits Increased Creativity that will help you convey the message impactfully. It can be accessed with Google Slides and is available in both standard screen and widescreen aspect ratios. Apart from this, you can download this well-structured PowerPoint template design in different formats like PDF, JPG, and PNG. So, click the download button now to gain full access to this PPT design. Our Derivative Calculator Steps In Powerpoint And Google Slides Cpb are topically designed to provide an attractive backdrop to any subject. Use them to look like a presentation pro.
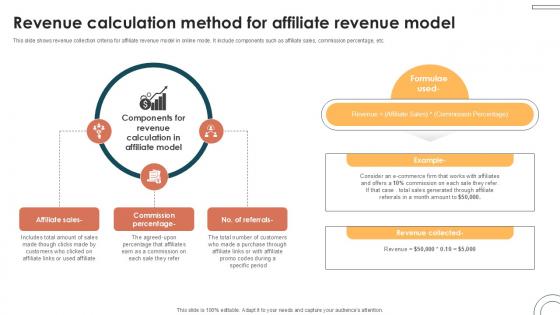
Revenue Calculation Method For Internet Based Trade Structure Ppt Presentation
This slide shows revenue collection criteria for affiliate revenue model in online mode. It include components such as affiliate sales, commission percentage, etc. Crafting an eye-catching presentation has never been more straightforward. Let your presentation shine with this tasteful yet straightforward Revenue Calculation Method For Internet Based Trade Structure Ppt Presentation template. It offers a minimalistic and classy look that is great for making a statement. The colors have been employed intelligently to add a bit of playfulness while still remaining professional. Construct the ideal Revenue Calculation Method For Internet Based Trade Structure Ppt Presentation that effortlessly grabs the attention of your audience Begin now and be certain to wow your customers This slide shows revenue collection criteria for affiliate revenue model in online mode. It include components such as affiliate sales, commission percentage, etc.
Construction Project Budget Estimation Icon Sample PDF
Presenting Construction Project Budget Estimation Icon Sample PDF to dispense important information. This template comprises three stages. It also presents valuable insights into the topics including Construction Project, Budget Estimation Icon. This is a completely customizable PowerPoint theme that can be put to use immediately. So, download it and address the topic impactfully.
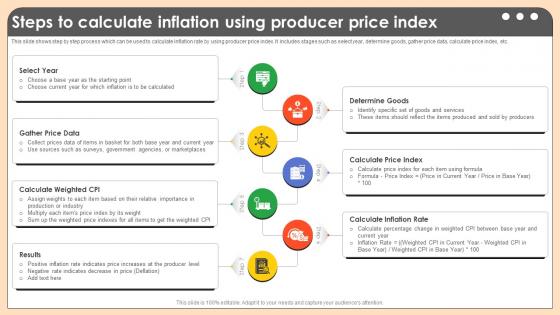
Steps To Calculate Inflation Using Producer Comprehensive Guide On Inflation Control CM SS V
This slide shows step by step process which can be used to calculate inflation rate by using producer price index. It includes stages such as select year, determine goods, gather price data, calculate price index, etc. Present like a pro with Steps To Calculate Inflation Using Producer Comprehensive Guide On Inflation Control CM SS V. Create beautiful presentations together with your team, using our easy-to-use presentation slides. Share your ideas in real-time and make changes on the fly by downloading our templates. So whether you are in the office, on the go, or in a remote location, you can stay in sync with your team and present your ideas with confidence. With Slidegeeks presentation got a whole lot easier. Grab these presentations today. This slide shows step by step process which can be used to calculate inflation rate by using producer price index. It includes stages such as select year, determine goods, gather price data, calculate price index, etc.
Project Management Circle Chart With Spherical Stages PowerPoint Slides Download
Project Management Circle Chart with Spherical Stages PowerPoint Slides Download-These high quality powerpoint pre-designed slides and powerpoint templates have been carefully created by our professional team to help you impress your audience. All slides have been created and are 100% editable in powerpoint. Each and every property of any graphic - color, size, orientation, shading, outline etc. can be modified to help you build an effective powerpoint presentation. Any text can be entered at any point in the powerpoint template or slide. Simply DOWNLOAD, TYPE and PRESENT!-These PowerPoint presentation slides can be used to represent concepts relating to--abstract, achievement, aim, arrow, background, business, chart, communication, company, competition, concept, design, development, diagram, direction, finance, financial, forecast, forward, goal, graph, graphic, growth, icon, illustration, increase, investment, leader, leadership, marketing, motion, moving, orange, path, price, process, profit, progress, shape, sign, success, symbol, target, team, teamwork, up, upwards-Project Management Circle Chart with Spherical Stages PowerPoint Slides Download Keep up the fight with our Project Management Circle Chart With Spherical Stages PowerPoint Slides Download. Be assured of eventual achievement.
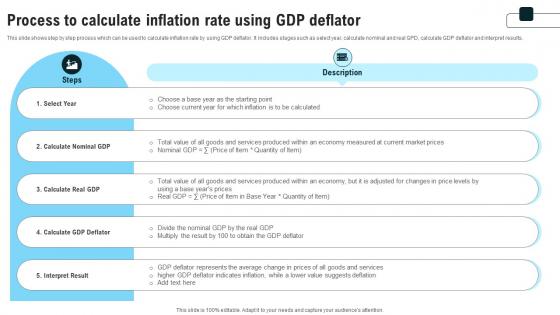
Process To Calculate Inflation Rate Using GDP Deflator Strategies For Inflation A Tactical Guide Fin SS V
This slide shows step by step process which can be used to calculate inflation rate by using GDP deflator. It includes stages such as select year, calculate nominal and real GPD, calculate GDP deflator and interpret results. There are so many reasons you need a Process To Calculate Inflation Rate Using GDP Deflator Strategies For Inflation A Tactical Guide Fin SS V. The first reason is you can not spend time making everything from scratch, Thus, Slidegeeks has made presentation templates for you too. You can easily download these templates from our website easily. This slide shows step by step process which can be used to calculate inflation rate by using GDP deflator. It includes stages such as select year, calculate nominal and real GPD, calculate GDP deflator and interpret results.
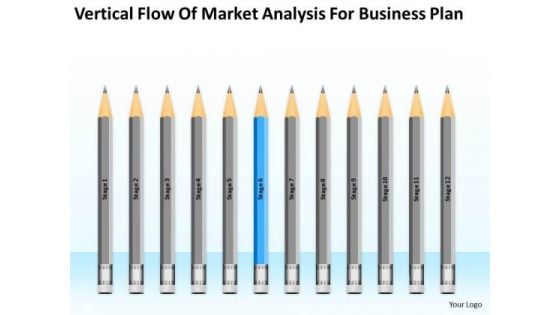
Vertical Flow Of Market Analysis For Business Plan Ppt 6 Write PowerPoint Slides
We present our vertical flow of market analysis for business plan ppt 6 write PowerPoint Slides.Use our Flow Charts PowerPoint Templates because It can Conjure up grand ideas with our magical PowerPoint Templates and Slides. Leave everyone awestruck by the end of your presentation. Download and present our Business PowerPoint Templates because Our PowerPoint Templates and Slides has conjured up a web of all you need with the help of our great team. Use them to string together your glistening ideas. Use our Shapes PowerPoint Templates because It can Conjure up grand ideas with our magical PowerPoint Templates and Slides. Leave everyone awestruck by the end of your presentation. Present our Education PowerPoint Templates because Our PowerPoint Templates and Slides are aesthetically designed to attract attention. We gaurantee that they will grab all the eyeballs you need. Download our Process and Flows PowerPoint Templates because Our PowerPoint Templates and Slides offer you the needful to organise your thoughts. Use them to list out your views in a logical sequence.Use these PowerPoint slides for presentations relating to Mark, corporate, business, plan, concept, bright, symbol, diagram, crayon, stack, graphic, finance, stock,analysis, drawing, paint, calculation, accounting, creative, economic, creativity, chart, forecast, design, color, objects, stationary, pencil, education,profit, information, background, investment, figures, ten, business, business process. The prominent colors used in the PowerPoint template are Blue, White, Gray. Get your approach right with our Vertical Flow Of Market Analysis For Business Plan Ppt 6 Write PowerPoint Slides. They will make a definite difference.
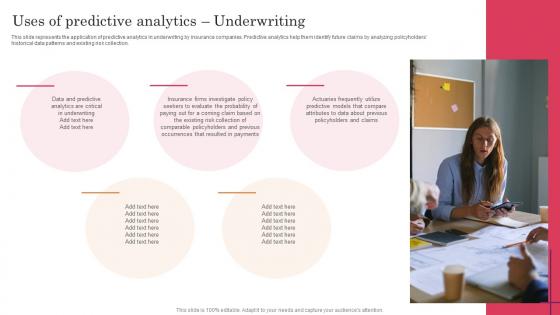
Uses Of Predictive Analytics Underwriting Predictive Analytics For Improved Slides Pdf
This slide represents the application of predictive analytics in underwriting by insurance companies. Predictive analytics help them identify future claims by analyzing policyholders historical data patterns and existing risk collection. Find highly impressive Uses Of Predictive Analytics Underwriting Predictive Analytics For Improved Slides Pdf on Slidegeeks to deliver a meaningful presentation. You can save an ample amount of time using these presentation templates. No need to worry to prepare everything from scratch because Slidegeeks experts have already done a huge research and work for you. You need to download Uses Of Predictive Analytics Underwriting Predictive Analytics For Improved Slides Pdf for your upcoming presentation. All the presentation templates are 100 percent editable and you can change the color and personalize the content accordingly. Download now. This slide represents the application of predictive analytics in underwriting by insurance companies. Predictive analytics help them identify future claims by analyzing policyholders historical data patterns and existing risk collection.

Example To Calculate Inflation Rate By Consumer Strategies For Inflation A Tactical Guide Fin SS V
This slide shows example which can be used by individuals or businesses to get practical insights for using consumer price index to calculate inflation rate in an economy. Find highly impressive Example To Calculate Inflation Rate By Consumer Strategies For Inflation A Tactical Guide Fin SS V on Slidegeeks to deliver a meaningful presentation. You can save an ample amount of time using these presentation templates. No need to worry to prepare everything from scratch because Slidegeeks experts have already done a huge research and work for you. You need to download Example To Calculate Inflation Rate By Consumer Strategies For Inflation A Tactical Guide Fin SS V for your upcoming presentation. All the presentation templates are 100 percent editable and you can change the color and personalize the content accordingly. Download now This slide shows example which can be used by individuals or businesses to get practical insights for using consumer price index to calculate inflation rate in an economy.

Example To Calculate Inflation Rate By Comprehensive Guide On Inflation Control CM SS V
This slide shows example which can be used by individuals or businesses to get practical insights for using consumer price index to calculate inflation rate in an economy. Find highly impressive Example To Calculate Inflation Rate By Comprehensive Guide On Inflation Control CM SS V on Slidegeeks to deliver a meaningful presentation. You can save an ample amount of time using these presentation templates. No need to worry to prepare everything from scratch because Slidegeeks experts have already done a huge research and work for you. You need to download Example To Calculate Inflation Rate By Comprehensive Guide On Inflation Control CM SS V for your upcoming presentation. All the presentation templates are 100 percent editable and you can change the color and personalize the content accordingly. Download now This slide shows example which can be used by individuals or businesses to get practical insights for using consumer price index to calculate inflation rate in an economy.
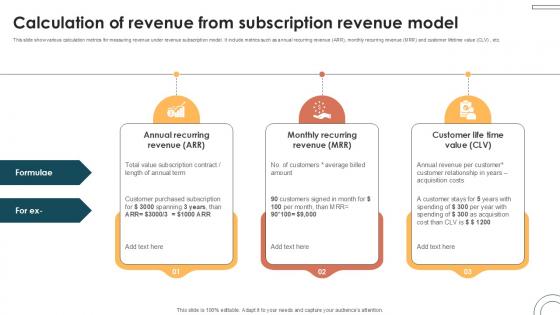
Calculation Of Revenue From Subscription Internet Based Trade Structure Ppt Example
This slide show various calculation metrics for measuring revenue under revenue subscription model. It include metrics such as annual recurring revenue ARR, monthly recurring revenue MRR and customer lifetime value CLV , etc. Get a simple yet stunning designed Calculation Of Revenue From Subscription Internet Based Trade Structure Ppt Example. It is the best one to establish the tone in your meetings. It is an excellent way to make your presentations highly effective. So, download this PPT today from Slidegeeks and see the positive impacts. Our easy-to-edit Calculation Of Revenue From Subscription Internet Based Trade Structure Ppt Example can be your go-to option for all upcoming conferences and meetings. So, what are you waiting for Grab this template today. This slide show various calculation metrics for measuring revenue under revenue subscription model. It include metrics such as annual recurring revenue ARR, monthly recurring revenue MRR and customer lifetime value CLV , etc.
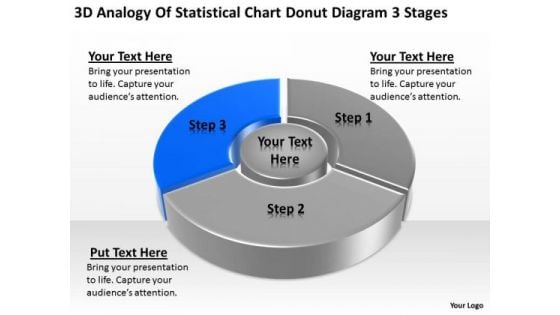
Statistical Chart Donut Diagram 3 Stages Ppt Samples Business Plan PowerPoint Slides
We present our statistical chart donut diagram 3 stages ppt samples business plan PowerPoint Slides.Download our Finance PowerPoint Templates because you should Experience excellence with our PowerPoint Templates and Slides. They will take your breath away. Present our Marketing PowerPoint Templates because our bewitching PowerPoint Templates and Slides will delight your audience with the magic of your words. Use our Sales PowerPoint Templates because You have gained great respect for your brilliant ideas. Use our PowerPoint Templates and Slides to strengthen and enhance your reputation. Download our Business PowerPoint Templates because You have a driving passion to excel in your field. Our PowerPoint Templates and Slides will prove ideal vehicles for your ideas. Download our Success PowerPoint Templates because You should Kick up a storm with our PowerPoint Templates and Slides. The heads of your listeners will swirl with your ideas.Use these PowerPoint slides for presentations relating to Chart, Business, Data, Donut, Market, Sales, Document, Economy, Display, Bar, Corporate, Income, Concept, Success, Presentation, Symbol, Diagram, Percentage, Graphic, Finance, Stock, Clean, Analysis, Report, Marketing, Accounting, Management, Graph, Colors, Forecast, Design, Growth, Competition, Progress, Profit, Information, Background, Trade, Investment, Statistic, Financial. The prominent colors used in the PowerPoint template are Blue, Gray, Black. Make the event with our Statistical Chart Donut Diagram 3 Stages Ppt Samples Business Plan PowerPoint Slides. Your thoughts will be really happening.

Six Stage Process To Calculate Inflation Rate Comprehensive Guide On Inflation Control CM SS V
This slide shows step by step process which can be used to calculate inflation rate by using ECI. It includes stages such as select year, collect data, calculate ECI for wages and benefits and interpret results. Do you have to make sure that everyone on your team knows about any specific topic I yes, then you should give Six Stage Process To Calculate Inflation Rate Comprehensive Guide On Inflation Control CM SS V a try. Our experts have put a lot of knowledge and effort into creating this impeccable Six Stage Process To Calculate Inflation Rate Comprehensive Guide On Inflation Control CM SS V. You can use this template for your upcoming presentations, as the slides are perfect to represent even the tiniest detail. You can download these templates from the Slidegeeks website and these are easy to edit. So grab these today This slide shows step by step process which can be used to calculate inflation rate by using ECI. It includes stages such as select year, collect data, calculate ECI for wages and benefits and interpret results.
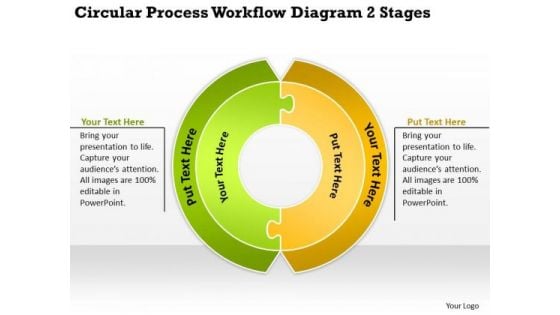
Process Workflow Diagram 2 Stages Sample Business Plan Template PowerPoint Templates
We present our process workflow diagram 2 stages sample business plan template PowerPoint templates.Download and present our Process and Flows PowerPoint Templates because You can Connect the dots. Fan expectations as the whole picture emerges. Download our Business PowerPoint Templates because our PowerPoint Templates and Slides are the string of your bow. Fire of your ideas and conquer the podium. Download and present our Marketing PowerPoint Templates because Our PowerPoint Templates and Slides will Embellish your thoughts. They will help you illustrate the brilliance of your ideas. Download and present our Success PowerPoint Templates because Our PowerPoint Templates and Slides are conceived by a dedicated team. Use them and give form to your wondrous ideas. Download our Shapes PowerPoint Templates because Your ideas provide food for thought. Our PowerPoint Templates and Slides will help you create a dish to tickle the most discerning palate.Use these PowerPoint slides for presentations relating to Accountant, accounting, analyst, annual, bank, bar, benefit, bonus, building, business, calculation, chart, company, concept, corporate, diagram, two,factor, figures, finance, financial, firm, forecast, future, gain, goal, gold, graph, grow, growth, holder, market, measure, money, numbers, office, presentation, profile,profit, progress, report, statistic, stock, succeed, success, symbol, up. The prominent colors used in the PowerPoint template are Green lime, White, Yellow. There is nothing fake about your commitment. Demonstrate authenticity with our Process Workflow Diagram 2 Stages Sample Business Plan Template PowerPoint Templates.
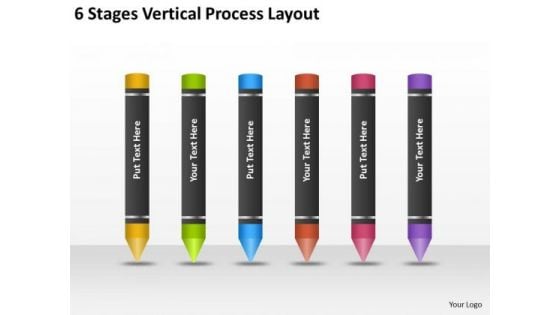
6 Stages Vertical Process Layout Business Plan Template PowerPoint Templates
We present our 6 stages vertical process layout business plan template PowerPoint templates.Download and present our Business PowerPoint Templates because They will Put the wind in your sails. Skim smoothly over the choppy waters of the market. Use our Flow Charts PowerPoint Templates because Our PowerPoint Templates and Slides will weave a web of your great ideas. They are gauranteed to attract even the most critical of your colleagues. Present our Shapes PowerPoint Templates because You can Create a matrix with our PowerPoint Templates and Slides. Feel the strength of your ideas click into place. Use our Marketing PowerPoint Templates because Our PowerPoint Templates and Slides offer you the needful to organise your thoughts. Use them to list out your views in a logical sequence. Download our Process and Flows PowerPoint Templates because Our PowerPoint Templates and Slides will let you Illuminate the road ahead to Pinpoint the important landmarks along the way.Use these PowerPoint slides for presentations relating to Mark, corporate, business, plan, concept, bright, symbol, diagram, crayon, stack, graphic, finance, stock,analysis, drawing, paint, calculation, accounting, creative, economic, creativity, chart, forecast, design, color, objects, stationary, pencil, education,profit, information, background, investment, figures, rainbow, business, business process. The prominent colors used in the PowerPoint template are Yellow, Green, Blue. Our 6 Stages Vertical Process Layout Business Plan Template PowerPoint Templates are truly fair minded. They take all arguments into account.
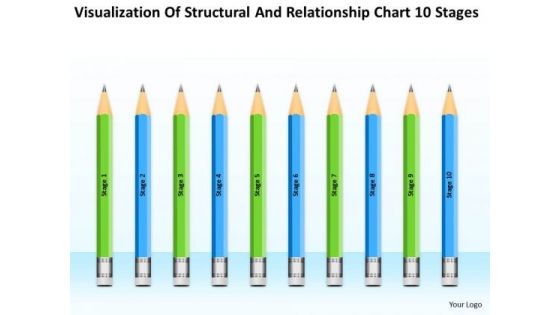
Structural And Relationship Chart 10 Stages Ppt One Page Business Plan PowerPoint Templates
We present our structural and relationship chart 10 stages ppt one page business plan PowerPoint templates.Download and present our Business PowerPoint Templates because Our PowerPoint Templates and Slides will fulfill your every need. Use them and effectively satisfy the desires of your audience. Download and present our Flow Charts PowerPoint Templates because Our PowerPoint Templates and Slides are conceived by a dedicated team. Use them and give form to your wondrous ideas. Download and present our Shapes PowerPoint Templates because It can Bubble and burst with your ideas. Use our Marketing PowerPoint Templates because You have a driving passion to excel in your field. Our PowerPoint Templates and Slides will prove ideal vehicles for your ideas. Download and present our Process and Flows PowerPoint Templates because Our PowerPoint Templates and Slides are created by a hardworking bunch of busybees. Always flitting around with solutions gauranteed to please.Use these PowerPoint slides for presentations relating to Market, isolated, rate, mark, corporate, row, business, plan, concept, bright, symbol, diagram, crayon, stack, graphic, finance, stock,analysis, drawing, paint, calculation, accounting, creative, economic, creativity, chart, forecast, design, color, objects, stationary, pencil, education,profit, information, background, investment, figures, rainbow, financial, artist, capital, business, business process. The prominent colors used in the PowerPoint template are Green, Blue, Black. Be productive with our Structural And Relationship Chart 10 Stages Ppt One Page Business Plan PowerPoint Templates. You will come out on top.
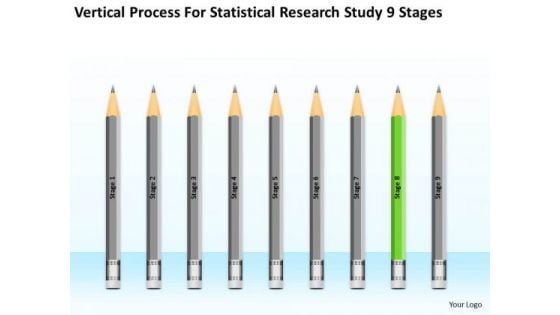
Vertical Process For Statisctical Research Study 9 Stages Ppt 8 Busniess Plan PowerPoint Slides
We present our vertical process for statisctical research study 9 stages ppt 8 busniess plan PowerPoint Slides.Download our Education PowerPoint Templates because Our PowerPoint Templates and Slides are effectively colour coded to prioritise your plans They automatically highlight the sequence of events you desire. Download and present our Business PowerPoint Templates because Watching this your Audience will Grab their eyeballs, they wont even blink. Present our Shapes PowerPoint Templates because Our PowerPoint Templates and Slides are designed to help you succeed. They have all the ingredients you need. Use our Process and Flows PowerPoint Templates because Our PowerPoint Templates and Slides are conceived by a dedicated team. Use them and give form to your wondrous ideas. Download our Flow Charts PowerPoint Templates because Our PowerPoint Templates and Slides help you pinpoint your timelines. Highlight the reasons for your deadlines with their use.Use these PowerPoint slides for presentations relating to Mark, corporate, business, plan, concept, bright, symbol, diagram, crayon, stack, graphic, finance, stock,analysis, drawing, paint, calculation, accounting, creative, economic, creativity, chart, forecast, design, color, objects, stationary, pencil, education,profit, information, background, investment, figures, ten, business, business process. The prominent colors used in the PowerPoint template are Green, Gray, Black. Entertain your audience with your thoughts. Capture their imagination with our Vertical Process For Statisctical Research Study 9 Stages Ppt 8 Busniess Plan PowerPoint Slides.
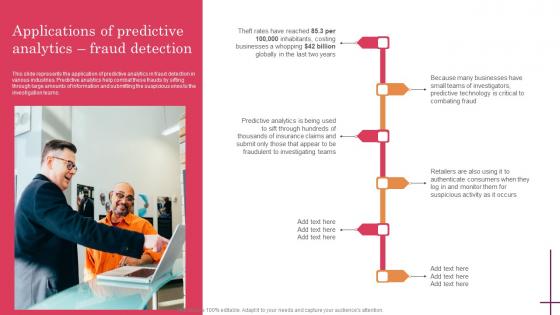
Applications Of Predictive Analytics Fraud Predictive Analytics For Improved Professional Pdf
This slide represents the application of predictive analytics in fraud detection in various industries. Predictive analytics help combat these frauds by sifting through large amounts of information and submitting the suspicious ones to the investigation teams. Boost your pitch with our creative Applications Of Predictive Analytics Fraud Predictive Analytics For Improved Professional Pdf. Deliver an awe-inspiring pitch that will mesmerize everyone. Using these presentation templates you will surely catch everyones attention. You can browse the ppts collection on our website. We have researchers who are experts at creating the right content for the templates. So you do not have to invest time in any additional work. Just grab the template now and use them. This slide represents the application of predictive analytics in fraud detection in various industries. Predictive analytics help combat these frauds by sifting through large amounts of information and submitting the suspicious ones to the investigation teams.
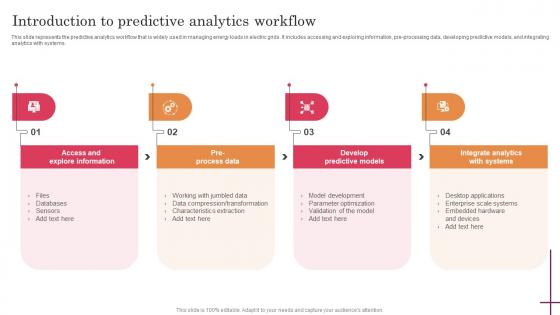
Introduction To Predictive Analytics Workflow Predictive Analytics For Improved Designs Pdf
This slide represents the predictive analytics workflow that is widely used in managing energy loads in electric grids. It includes accessing and exploring information, pre-processing data, developing predictive models, and integrating analytics with systems. Present like a pro with Introduction To Predictive Analytics Workflow Predictive Analytics For Improved Designs Pdf Create beautiful presentations together with your team, using our easy-to-use presentation slides. Share your ideas in real-time and make changes on the fly by downloading our templates. So whether you are in the office, on the go, or in a remote location, you can stay in sync with your team and present your ideas with confidence. With Slidegeeks presentation got a whole lot easier. Grab these presentations today. This slide represents the predictive analytics workflow that is widely used in managing energy loads in electric grids. It includes accessing and exploring information, pre-processing data, developing predictive models, and integrating analytics with systems.
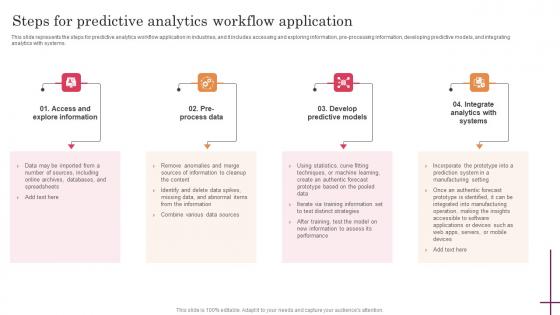
Steps For Predictive Analytics Workflow Application Predictive Analytics For Improved Ideas Pdf
This slide represents the steps for predictive analytics workflow application in industries, and it includes accessing and exploring information, pre-processing information, developing predictive models, and integrating analytics with systems. Slidegeeks is one of the best resources for PowerPoint templates. You can download easily and regulate Steps For Predictive Analytics Workflow Application Predictive Analytics For Improved Ideas Pdf for your personal presentations from our wonderful collection. A few clicks is all it takes to discover and get the most relevant and appropriate templates. Use our Templates to add a unique zing and appeal to your presentation and meetings. All the slides are easy to edit and you can use them even for advertisement purposes. This slide represents the steps for predictive analytics workflow application in industries, and it includes accessing and exploring information, pre-processing information, developing predictive models, and integrating analytics with systems.
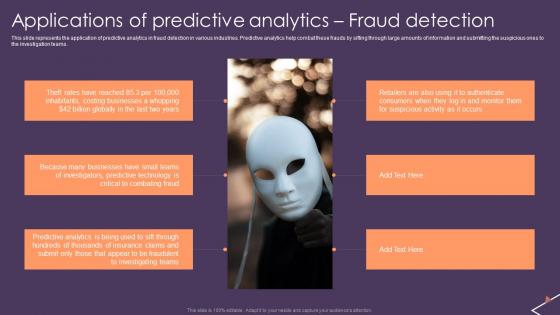
Predictive Analytics For Empowering Applications Of Predictive Analytics Fraud Detection Clipart Pdf
This slide represents the application of predictive analytics in fraud detection in various industries. Predictive analytics help combat these frauds by sifting through large amounts of information and submitting the suspicious ones to the investigation teams. Find a pre-designed and impeccable Predictive Analytics For Empowering Applications Of Predictive Analytics Fraud Detection Clipart Pdf The templates can ace your presentation without additional effort. You can download these easy-to-edit presentation templates to make your presentation stand out from others. So, what are you waiting for Download the template from Slidegeeks today and give a unique touch to your presentation. This slide represents the application of predictive analytics in fraud detection in various industries. Predictive analytics help combat these frauds by sifting through large amounts of information and submitting the suspicious ones to the investigation teams.
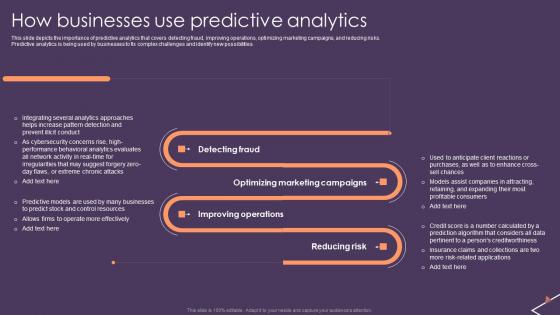
Predictive Analytics For Empowering How Businesses Use Predictive Analytics Demonstration Pdf
This slide depicts the importance of predictive analytics that covers detecting fraud, improving operations, optimizing marketing campaigns, and reducing risks. Predictive analytics is being used by businesses to fix complex challenges and identify new possibilities. There are so many reasons you need a Predictive Analytics For Empowering How Businesses Use Predictive Analytics Demonstration Pdf The first reason is you can not spend time making everything from scratch, Thus, Slidegeeks has made presentation templates for you too. You can easily download these templates from our website easily. This slide depicts the importance of predictive analytics that covers detecting fraud, improving operations, optimizing marketing campaigns, and reducing risks. Predictive analytics is being used by businesses to fix complex challenges and identify new possibilities.
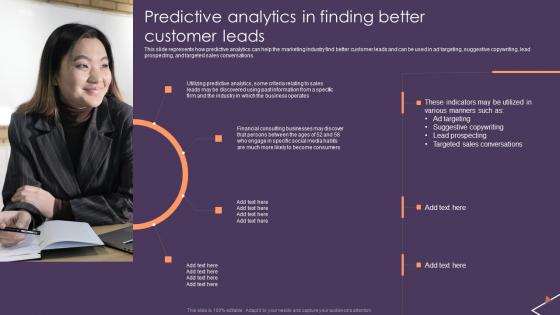
Predictive Analytics For Empowering Predictive Analytics In Finding Better Customer Summary Pdf
This slide represents how predictive analytics can help the marketing industry find better customer leads and can be used in ad targeting, suggestive copywriting, lead prospecting, and targeted sales conversations. This Predictive Analytics For Empowering Predictive Analytics In Finding Better Customer Summary Pdf is perfect for any presentation, be it in front of clients or colleagues. It is a versatile and stylish solution for organizing your meetings. The Predictive Analytics For Empowering Predictive Analytics In Finding Better Customer Summary Pdf features a modern design for your presentation meetings. The adjustable and customizable slides provide unlimited possibilities for acing up your presentation. Slidegeeks has done all the homework before launching the product for you. So, do not wait, grab the presentation templates today This slide represents how predictive analytics can help the marketing industry find better customer leads and can be used in ad targeting, suggestive copywriting, lead prospecting, and targeted sales conversations.
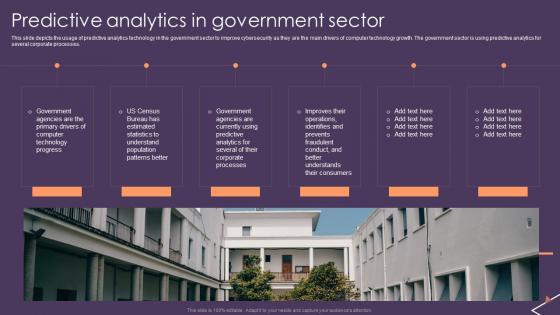
Predictive Analytics For Empowering Predictive Analytics In Government Sector Template Pdf
This slide depicts the usage of predictive analytics technology in the government sector to improve cybersecurity as they are the main drivers of computer technology growth. The government sector is using predictive analytics for several corporate processes. Welcome to our selection of the Predictive Analytics For Empowering Predictive Analytics In Government Sector Template Pdf These are designed to help you showcase your creativity and bring your sphere to life. Planning and Innovation are essential for any business that is just starting out. This collection contains the designs that you need for your everyday presentations. All of our PowerPoints are 100 percent editable, so you can customize them to suit your needs. This multi-purpose template can be used in various situations. Grab these presentation templates today. This slide depicts the usage of predictive analytics technology in the government sector to improve cybersecurity as they are the main drivers of computer technology growth. The government sector is using predictive analytics for several corporate processes.
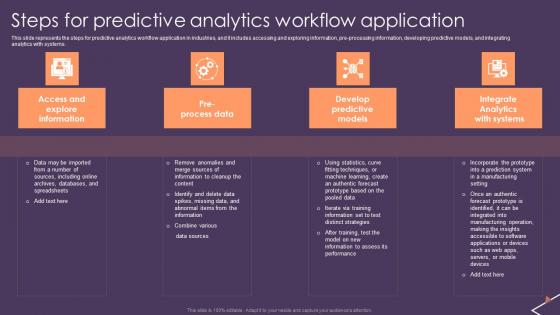
Predictive Analytics For Empowering Steps For Predictive Analytics Workflow Application Brochure Pdf
This slide represents the steps for predictive analytics workflow application in industries, and it includes accessing and exploring information, pre-processing information, developing predictive models, and integrating analytics with systems. Find a pre-designed and impeccable Predictive Analytics For Empowering Steps For Predictive Analytics Workflow Application Brochure Pdf The templates can ace your presentation without additional effort. You can download these easy-to-edit presentation templates to make your presentation stand out from others. So, what are you waiting for Download the template from Slidegeeks today and give a unique touch to your presentation. This slide represents the steps for predictive analytics workflow application in industries, and it includes accessing and exploring information, pre-processing information, developing predictive models, and integrating analytics with systems.
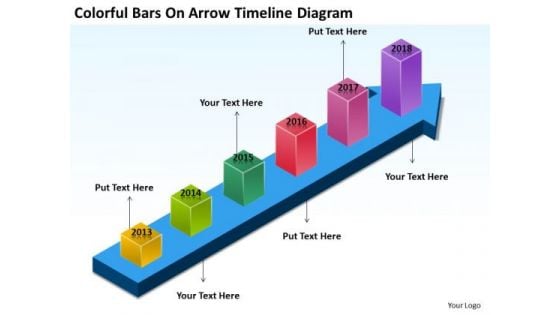
Colorful Bars On Arrow Timeline Diagram Catering Business Plan PowerPoint Templates
We present our colorful bars on arrow timeline diagram catering business plan PowerPoint templates.Present our Process and Flows PowerPoint Templates because You can Double your output with our PowerPoint Templates and Slides. They make beating deadlines a piece of cake. Use our Arrows PowerPoint Templates because Our PowerPoint Templates and Slides will let your words and thoughts hit bullseye everytime. Present our Business PowerPoint Templates because Your ideas provide food for thought. Our PowerPoint Templates and Slides will help you create a dish to tickle the most discerning palate. Use our Marketing PowerPoint Templates because Our PowerPoint Templates and Slides will provide you the cutting edge. Slice through the doubts in the minds of your listeners. Use our Success PowerPoint Templates because Our PowerPoint Templates and Slides are specially created by a professional team with vast experience. They diligently strive to come up with the right vehicle for your brilliant Ideas. Use these PowerPoint slides for presentations relating to Graph, chart, bar, growth, arrow, color,colorful,colour,colourful,market, grow, success, diagram, gain, stock, up, forecast, profile, holder, succeed, corporate, future, finance, analyst, goal,calculation, building, accounting, factor, company, progress, profit, firm, figures, statistic, financial, measure. The prominent colors used in the PowerPoint template are Purple, Pink, Blue. Whatever the facet you have in mind? You will find it covered by our Colorful Bars On Arrow Timeline Diagram Catering Business Plan PowerPoint Templates.
Planning Performance Of Process 12 Stages Ppt Business Format PowerPoint Templates
We present our planning performance of process 12 stages ppt business format PowerPoint templates.Download our Business PowerPoint Templates because Our PowerPoint Templates and Slides are effectively colour coded to prioritise your plans They automatically highlight the sequence of events you desire. Download and present our Marketing PowerPoint Templates because Our PowerPoint Templates and Slides has conjured up a web of all you need with the help of our great team. Use them to string together your glistening ideas. Download and present our Process and Flows PowerPoint Templates because Our PowerPoint Templates and Slides will give you great value for your money. Be assured of finding the best projection to highlight your words. Download our Shapes PowerPoint Templates because Our PowerPoint Templates and Slides will embellish your thoughts. See them provide the desired motivation to your team. Download our Flow Charts PowerPoint Templates because Our PowerPoint Templates and Slides will generate and maintain the level of interest you desire. They will create the impression you want to imprint on your audience.Use these PowerPoint slides for presentations relating to Mark, corporate, business, plan, concept, bright, symbol, diagram, crayon, stack, graphic, finance, stock,analysis, drawing, paint, calculation, accounting, creative, economic, creativity, chart, forecast, design, color, objects, stationary, pencil, education,profit, information, background, investment, figures, rainbow, business, business process. The prominent colors used in the PowerPoint template are Yellow, Green, Blue. You intend to deliver. Make it happen with our Planning Performance Of Process 12 Stages Ppt Business Format PowerPoint Templates. Make sure your presentation gets the attention it deserves.
Process Combination Of Acheivements 10 Stages Ppt Business Plans Made Easy PowerPoint Templates
We present our process combination of acheivements 10 stages ppt business plans made easy PowerPoint templates.Download and present our Business PowerPoint Templates because Our PowerPoint Templates and Slides have the Brilliant backdrops. Guaranteed to illuminate the minds of your audience. Use our Flow Charts PowerPoint Templates because Our PowerPoint Templates and Slides will give you great value for your money. Be assured of finding the best projection to highlight your words. Present our Shapes PowerPoint Templates because Our PowerPoint Templates and Slides team portray an attitude of elegance. Personify this quality by using them regularly. Download and present our Marketing PowerPoint Templates because Our PowerPoint Templates and Slides will fulfill your every need. Use them and effectively satisfy the desires of your audience. Present our Process and Flows PowerPoint Templates because you can Break through with our PowerPoint Templates and Slides. Bring down the mental barriers of your audience.Use these PowerPoint slides for presentations relating to Mark, corporate, business, plan, concept, bright, symbol, diagram, crayon, stack, graphic, finance, stock,analysis, drawing, paint, calculation, accounting, creative, economic, creativity, chart, forecast, design, color, objects, stationary, pencil, education,profit, information, background, investment, figures, rainbow, business, business process. The prominent colors used in the PowerPoint template are Yellow, Blue, Red. Go far with our Process Combination Of Acheivements 10 Stages Ppt Business Plans Made Easy PowerPoint Templates. They have the ability to carry you through.

Sequential Steps Of 11 Stages Market Analysis Ppt Business Plan Experts PowerPoint Slides
We present our sequential steps of 11 stages market analysis ppt business plan experts PowerPoint Slides.Download and present our Business PowerPoint Templates because Our PowerPoint Templates and Slides will let you Clearly mark the path for others to follow. Download and present our Marketing PowerPoint Templates because Our PowerPoint Templates and Slides will give you great value for your money. Be assured of finding the best projection to highlight your words. Present our Process and Flows PowerPoint Templates because Your ideas provide food for thought. Our PowerPoint Templates and Slides will help you create a dish to tickle the most discerning palate. Download our Shapes PowerPoint Templates because Our PowerPoint Templates and Slides are created with admirable insight. Use them and give your group a sense of your logical mind. Present our Flow Charts PowerPoint Templates because Our PowerPoint Templates and Slides will let Your superior ideas hit the target always and everytime.Use these PowerPoint slides for presentations relating to Mark, corporate, business, plan, concept, bright, symbol, diagram, crayon, stack, graphic, finance, stock,analysis, drawing, paint, calculation, accounting, creative, economic, creativity, chart, forecast, design, color, objects, stationary, pencil, education,profit, information, background, investment, figures, rainbow, business, business process. The prominent colors used in the PowerPoint template are Yellow, Green, Blue. Over a time the keenness may erode. Keep the edge sharp with our Sequential Steps Of 11 Stages Market Analysis Ppt Business Plan Experts PowerPoint Slides.
Vertical Steps In Sequence 5 Stages Ppt Insurance Business Plan PowerPoint Slides
We present our vertical steps in sequence 5 stages ppt insurance business plan PowerPoint Slides.Download our Business PowerPoint Templates because Our PowerPoint Templates and Slides will give you great value for your money. Be assured of finding the best projection to highlight your words. Present our Shapes PowerPoint Templates because You can Inspire your team with our PowerPoint Templates and Slides. Let the force of your ideas flow into their minds. Download and present our Education PowerPoint Templates because our PowerPoint Templates and Slides will give your ideas the shape. Download our Marketing PowerPoint Templates because our PowerPoint Templates and Slides will give your ideas the shape. Use our Success PowerPoint Templates because Our PowerPoint Templates and Slides ensures Effective communication. They help you put across your views with precision and clarity.Use these PowerPoint slides for presentations relating to Mark, corporate, business, plan, concept, bright, symbol, diagram, crayon, stack, graphic, finance, stock,analysis, drawing, paint, calculation, accounting, creative, economic, creativity, chart, forecast, design, color, objects, stationary, pencil, education,profit, information, background, investment, figures, ten, business, business process. The prominent colors used in the PowerPoint template are Blue, Black, Gray. Exhibit distinguished performance with our Vertical Steps In Sequence 5 Stages Ppt Insurance Business Plan PowerPoint Slides. They will make you look good.
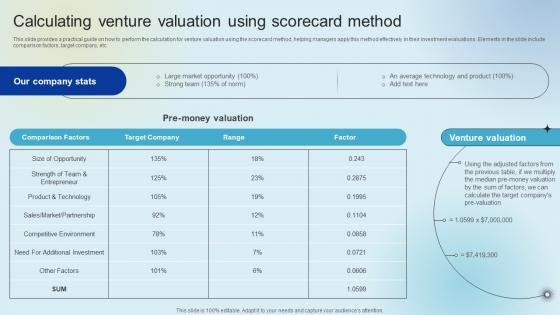
Calculating Venture Valuation Using Scorecard Raising Venture Capital A Holistic Approach Fin SS V
This slide provides a practical guide on how to perform the calculation for venture valuation using the scorecard method, helping managers apply this method effectively in their investment evaluations. Elements in the slide include comparison factors, target company, etc. Get a simple yet stunning designed Calculating Venture Valuation Using Scorecard Raising Venture Capital A Holistic Approach Fin SS V. It is the best one to establish the tone in your meetings. It is an excellent way to make your presentations highly effective. So, download this PPT today from Slidegeeks and see the positive impacts. Our easy-to-edit Calculating Venture Valuation Using Scorecard Raising Venture Capital A Holistic Approach Fin SS V can be your go-to option for all upcoming conferences and meetings. So, what are you waiting for. Grab this template today. This slide provides a practical guide on how to perform the calculation for venture valuation using the scorecard method, helping managers apply this method effectively in their investment evaluations. Elements in the slide include comparison factors, target company, etc.
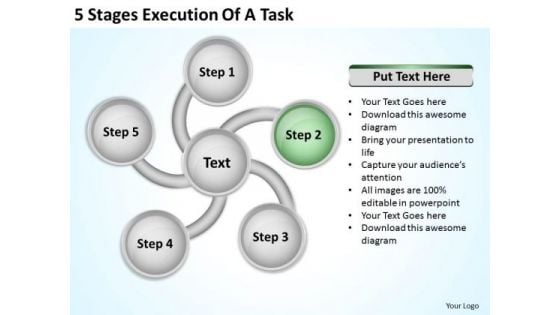
5 Stages Execution Of Business Plan PowerPoint Slide
We present our 5 stages execution of business plan PowerPoint Slide.Download and present our Marketing PowerPoint Templates because Our PowerPoint Templates and Slides offer you the needful to organise your thoughts. Use them to list out your views in a logical sequence. Download and present our Technology PowerPoint Templates because You should Ascend the ladder of success with ease. Our PowerPoint Templates and Slides will provide strong and sturdy steps. Present our Circle Charts PowerPoint Templates because You can Hit a home run with our PowerPoint Templates and Slides. See your ideas sail into the minds of your audience. Download our Business PowerPoint Templates because You are working at that stage with an air of royalty. Let our PowerPoint Templates and Slides be the jewels in your crown. Download our Shapes PowerPoint Templates because Our PowerPoint Templates and Slides are focused like a searchlight beam. They highlight your ideas for your target audience.Use these PowerPoint slides for presentations relating to Project, tasks, risk, testing, lessons, documents, closure, learned, delivering, life, value, identification, changes, initiation, development, train, support, inception, forecasts, status, execution, collection, planning, design, reports, quality, responsibilities, migration, staffing, release, resource, defining, construction, customer. The prominent colors used in the PowerPoint template are Green, Gray, White. Gain entry into a special world. Our 5 Stages Execution Of Business Plan PowerPoint Slide will ease the passage.
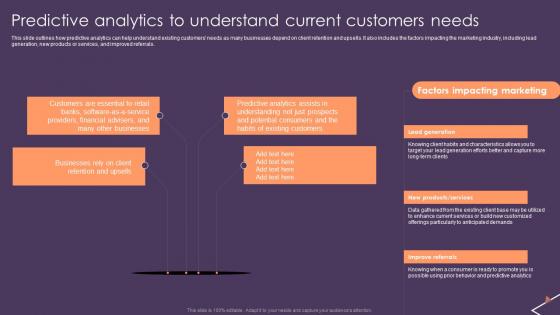
Predictive Analytics For Empowering Predictive Analytics To Understand Current Inspiration Pdf
This slide outlines how predictive analytics can help understand existing customers needs as many businesses depend on client retention and upsells. It also includes the factors impacting the marketing industry, including lead generation, new products or services, and improved referrals. Presenting this PowerPoint presentation, titled Predictive Analytics For Empowering Predictive Analytics To Understand Current Inspiration Pdf with topics curated by our researchers after extensive research. This editable presentation is available for immediate download and provides attractive features when used. Download now and captivate your audience. Presenting this Predictive Analytics For Empowering Predictive Analytics To Understand Current Inspiration Pdf Our researchers have carefully researched and created these slides with all aspects taken into consideration. This is a completely customizable Predictive Analytics For Empowering Predictive Analytics To Understand Current Inspiration Pdf that is available for immediate downloading. Download now and make an impact on your audience. Highlight the attractive features available with our PPTs. This slide outlines how predictive analytics can help understand existing customers needs as many businesses depend on client retention and upsells. It also includes the factors impacting the marketing industry, including lead generation, new products or services, and improved referrals.


 Continue with Email

 Home
Home


