Gender Ratio

Geographical Segmentation Gender Ratio Chart Ppt Slides
This is a geographical segmentation gender ratio chart ppt slides. This is a one stage process. The stages in this process are global, geographical, business, success.
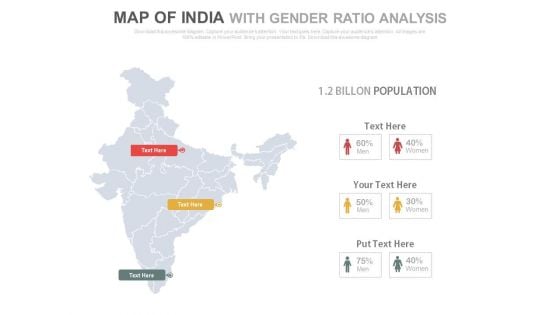
India Map Of With Gender Ratio Analysis Powerpoint Slides
This PowerPoint template displays graphics of India map with male female icons. This Map template can be used in presentations to depict gender ratio analysis. This slide can also be used by school students for educational projects.
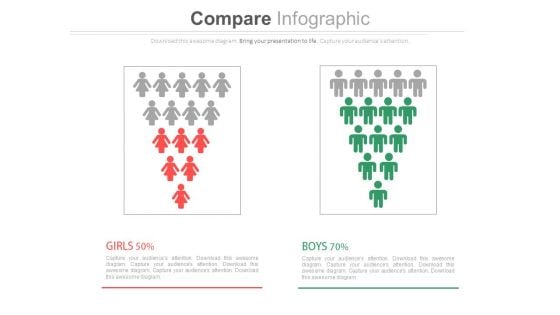
Male Female Gender Ratio Analysis Comparison Chart Powerpoint Slides
This PowerPoint template has been designed with graphics of male and female icons. Download this PPT slide to depict gender ratio analysis. Grab the attention of your team with this eye catching template.
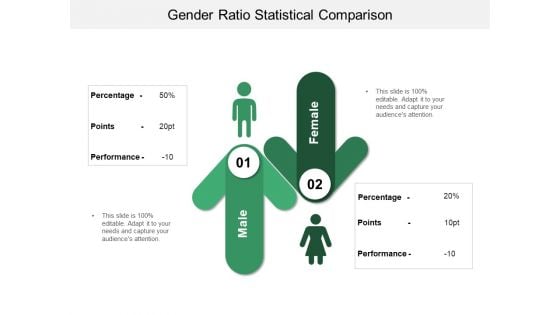
Gender Ratio Statistical Comparison Ppt PowerPoint Presentation Pictures Outfit
This is a gender ratio statistical comparison ppt powerpoint presentation pictures outfit. This is a two stage process. The stages in this process are compare, comparison of two, competitive analysis.
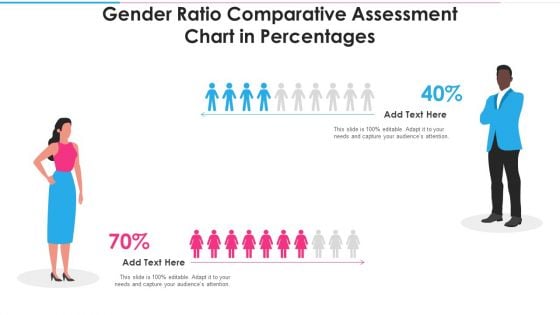
Gender Ratio Comparative Assessment Chart In Percentages Inspiration PDF
Persuade your audience using this gender ratio comparative assessment chart in percentages inspiration pdf. This PPT design covers two stages, thus making it a great tool to use. It also caters to a variety of topics including gender ratio comparative assessment chart in percentages. Download this PPT design now to present a convincing pitch that not only emphasizes the topic but also showcases your presentation skills.
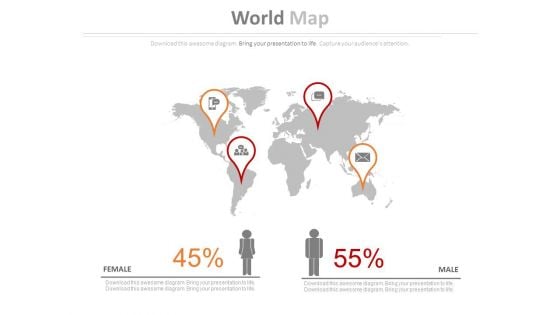
World Map With Gender Ratio Analysis PowerPoint Slides
This slide can be the perfect slide to demonstrate the comparison or changes between the different genders. This PowerPoint slide will be useful to show the ratio of males and females in different parts of the world. Have business abroad? Let your clients and investors know that visually. Above is the PowerPoint slide which can help you explain where all you have your empire. Now isn?t this great. Well yes. You can also use the above template to tell your colleagues or teammates about the places or countries where you plan to further expand your business or open a franchise. This would be an apt background template if you have tourism business. This PPT template is completely customizable. You can adjust the icons present in the slide. Color, icon and text can be modified the way you want. Download this and include it in your presentation to make it more impactful than before.
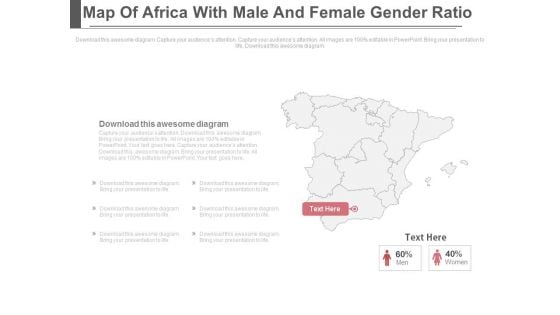
Map Of Africa With Men And Women Gender Ratio Powerpoint Slides
This PowerPoint template displays graphics of Africa map with men women icons. This PPT template can be used to display gender ratio analysis. This slide can also be used by school students for educational projects.
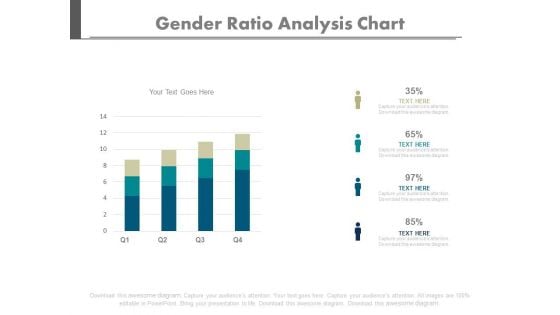
Four Bars Gender Population Ratio Chart Powerpoint Slides
Create dynamic presentations with our creative template of bar graph. This diagram may be used to present gender population. Download this template to leave permanent impression on your audience.
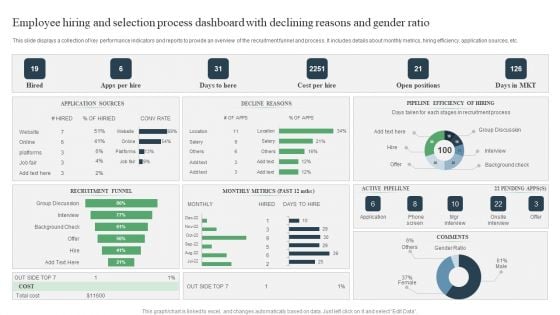
Employee Hiring And Selection Process Dashboard With Declining Reasons And Gender Ratio Ppt PowerPoint Presentation Infographic Template Rules PDF
Pitch your topic with ease and precision using this Employee Hiring And Selection Process Dashboard With Declining Reasons And Gender Ratio Ppt PowerPoint Presentation Infographic Template Rules PDF. This layout presents information on Group Discussion, Active Pipelilne, Onsite Interview. It is also available for immediate download and adjustment. So, changes can be made in the color, design, graphics or any other component to create a unique layout.
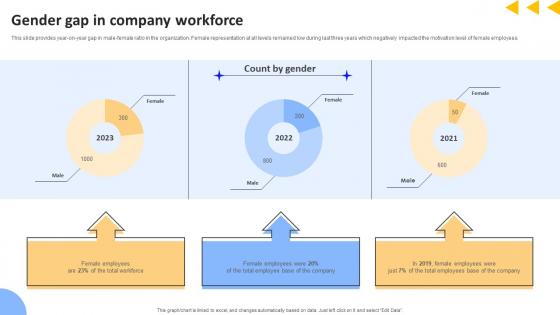
Workforce Productivity Improvement Gender Gap In Company Workforce Pictures Pdf
This slide provides year on year gap in male female ratio in the organization. Female representation at all levels remained low during last three years which negatively impacted the motivation level of female employees. Retrieve professionally designed Workforce Productivity Improvement Gender Gap In Company Workforce Pictures Pdf to effectively convey your message and captivate your listeners. Save time by selecting pre made slideshows that are appropriate for various topics, from business to educational purposes. These themes come in many different styles, from creative to corporate, and all of them are easily adjustable and can be edited quickly. Access them as PowerPoint templates or as Google Slides themes. You do not have to go on a hunt for the perfect presentation because Slidegeeks got you covered from everywhere. This slide provides year on year gap in male female ratio in the organization. Female representation at all levels remained low during last three years which negatively impacted the motivation level of female employees.
Gender Identity Psychology In Powerpoint And Google Slides Cpb
Introducing our well designed Gender Identity Psychology In Powerpoint And Google Slides Cpb. This PowerPoint design presents information on topics like Gender Identity Psychology. As it is predesigned it helps boost your confidence level. It also makes you a better presenter because of its high quality content and graphics. This PPT layout can be downloaded and used in different formats like PDF, PNG, and JPG. Not only this, it is available in both Standard Screen and Widescreen aspect ratios for your convenience. Therefore, click on the download button now to persuade and impress your audience. Our Gender Identity Psychology In Powerpoint And Google Slides Cpb are topically designed to provide an attractive backdrop to any subject. Use them to look like a presentation pro.

German Gender Roles In Powerpoint And Google Slides Cpb
Introducing our well-designed German Gender Roles In Powerpoint And Google Slides Cpb. This PowerPoint design presents information on topics like German Gender Roles. As it is predesigned it helps boost your confidence level. It also makes you a better presenter because of its high-quality content and graphics. This PPT layout can be downloaded and used in different formats like PDF, PNG, and JPG. Not only this, it is available in both Standard Screen and Widescreen aspect ratios for your convenience. Therefore, click on the download button now to persuade and impress your audience. Our German Gender Roles In Powerpoint And Google Slides Cpb are topically designed to provide an attractive backdrop to any subject. Use them to look like a presentation pro.
Gender Dysphoria Symptoms In Powerpoint And Google Slides Cpb
Introducing our well designed Gender Dysphoria Symptoms In Powerpoint And Google Slides Cpb This PowerPoint design presents information on topics like Gender Dysphoria Symptoms As it is predesigned it helps boost your confidence level. It also makes you a better presenter because of its high quality content and graphics. This PPT layout can be downloaded and used in different formats like PDF, PNG, and JPG. Not only this, it is available in both Standard Screen and Widescreen aspect ratios for your convenience. Therefore, click on the download button now to persuade and impress your audience. Our Gender Dysphoria Symptoms In Powerpoint And Google Slides Cpb are topically designed to provide an attractive backdrop to any subject. Use them to look like a presentation pro.

Gender Equality Workplace In Powerpoint And Google Slides Cpb
Introducing our well-designed Gender Equality Workplace In Powerpoint And Google Slides Cpb. This PowerPoint design presents information on topics like Gender Equality Workplace. As it is predesigned it helps boost your confidence level. It also makes you a better presenter because of its high-quality content and graphics. This PPT layout can be downloaded and used in different formats like PDF, PNG, and JPG. Not only this, it is available in both Standard Screen and Widescreen aspect ratios for your convenience. Therefore, click on the download button now to persuade and impress your audience. Our Gender Equality Workplace In Powerpoint And Google Slides Cpb are topically designed to provide an attractive backdrop to any subject. Use them to look like a presentation pro.
Gender Euphoria Definition In Powerpoint And Google Slides Cpb
Introducing our well-designed Gender Euphoria Definition In Powerpoint And Google Slides Cpb. This PowerPoint design presents information on topics like Gender Euphoria Definition. As it is predesigned it helps boost your confidence level. It also makes you a better presenter because of its high-quality content and graphics. This PPT layout can be downloaded and used in different formats like PDF, PNG, and JPG. Not only this, it is available in both Standard Screen and Widescreen aspect ratios for your convenience. Therefore, click on the download button now to persuade and impress your audience. Our Gender Euphoria Definition In Powerpoint And Google Slides Cpb are topically designed to provide an attractive backdrop to any subject. Use them to look like a presentation pro.
Improving HRM Process Gender Gap In Company Workforce Introduction PDF
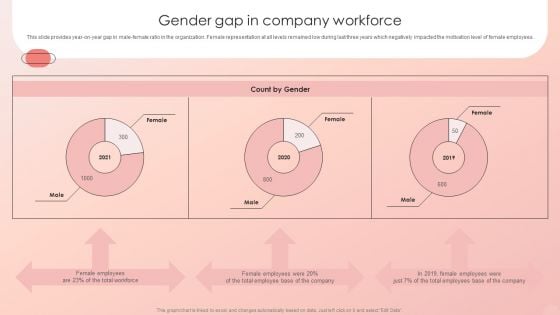
This slide provides year-on-year gap in male-female ratio in the organization. Female representation at all levels remained low during last three years which negatively impacted the motivation level of female employees. Slidegeeks has constructed Improving HRM Process Gender Gap In Company Workforce Introduction PDF after conducting extensive research and examination. These presentation templates are constantly being generated and modified based on user preferences and critiques from editors. Here, you will find the most attractive templates for a range of purposes while taking into account ratings and remarks from users regarding the content. This is an excellent jumping-off point to explore our content and will give new users an insight into our top-notch PowerPoint Templates.
Gender Inequality Healthcare In Powerpoint And Google Slides Cpb
Presenting our innovatively designed set of slides titled Gender Inequality Healthcare In Powerpoint And Google Slides Cpb. This completely editable PowerPoint graphic exhibits Gender Inequality Healthcare that will help you convey the message impactfully. It can be accessed with Google Slides and is available in both standard screen and widescreen aspect ratios. Apart from this, you can download this well structured PowerPoint template design in different formats like PDF, JPG, and PNG. So, click the download button now to gain full access to this PPT design. Our Gender Inequality Healthcare In Powerpoint And Google Slides Cpb are topically designed to provide an attractive backdrop to any subject. Use them to look like a presentation pro.
Gender Microaggressions Example In Powerpoint And Google Slides Cpb
Presenting our innovatively designed set of slides titled Gender Microaggressions Example In Powerpoint And Google Slides Cpb. This completely editable PowerPoint graphic exhibits Gender Microaggressions Example that will help you convey the message impactfully. It can be accessed with Google Slides and is available in both standard screen and widescreen aspect ratios. Apart from this, you can download this well structured PowerPoint template design in different formats like PDF, JPG, and PNG. So, click the download button now to gain full access to this PPT design. Our Gender Microaggressions Example In Powerpoint And Google Slides Cpb are topically designed to provide an attractive backdrop to any subject. Use them to look like a presentation pro.
Gender Roles Society In Powerpoint And Google Slides Cpb
Presenting our innovatively designed set of slides titled Gender Roles Society In Powerpoint And Google Slides Cpb. This completely editable PowerPoint graphic exhibits Gender Roles Society that will help you convey the message impactfully. It can be accessed with Google Slides and is available in both standard screen and widescreen aspect ratios. Apart from this, you can download this well structured PowerPoint template design in different formats like PDF, JPG, and PNG. So, click the download button now to gain full access to this PPT design. Our Gender Roles Society In Powerpoint And Google Slides Cpb are topically designed to provide an attractive backdrop to any subject. Use them to look like a presentation pro.
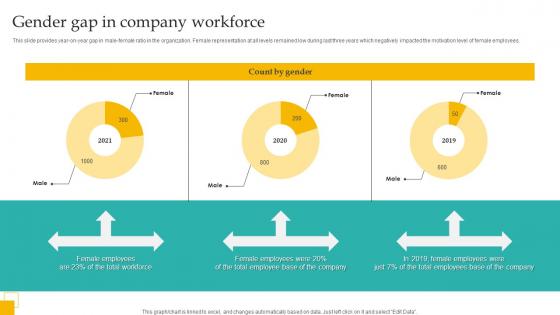
Gender Gap Company Workforce Administering Diversity And Inclusion At Workplace Structure Pdf
This slide provides year on year gap in male female ratio in the organization. Female representation at all levels remained low during last three years which negatively impacted the motivation level of female employees. Crafting an eye catching presentation has never been more straightforward. Let your presentation shine with this tasteful yet straightforward Gender Gap Company Workforce Administering Diversity And Inclusion At Workplace Structure Pdf template. It offers a minimalistic and classy look that is great for making a statement. The colors have been employed intelligently to add a bit of playfulness while still remaining professional. Construct the ideal Gender Gap Company Workforce Administering Diversity And Inclusion At Workplace Structure Pdf that effortlessly grabs the attention of your audience Begin now and be certain to wow your customers This slide provides year on year gap in male female ratio in the organization. Female representation at all levels remained low during last three years which negatively impacted the motivation level of female employees.

Employee Headcount Analysis On The Basis Of Gender Ppt PowerPoint Presentation Ideas Layout PDF
This slide shows the ratio of male and female in an organization. Number of male employees is almost double the number of female employees. Persuade your audience using this Employee Headcount Analysis On The Basis Of Gender Ppt PowerPoint Presentation Ideas Layout PDF. This PPT design covers two stages, thus making it a great tool to use. It also caters to a variety of topics including Employee Headcount, Analysis, Basis Gender. Download this PPT design now to present a convincing pitch that not only emphasizes the topic but also showcases your presentation skills.
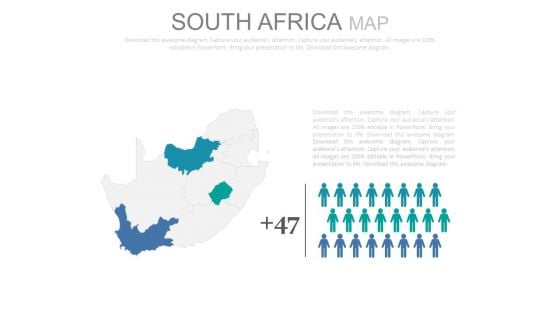
South Africa Map With Population Ratio Analysis Powerpoint Slides
This PowerPoint map template has been designed with map of South Africa and human icons. Use this map template to display gender population ratio analysis in your presentations. Any text can be entered at any point in the PowerPoint map slide.
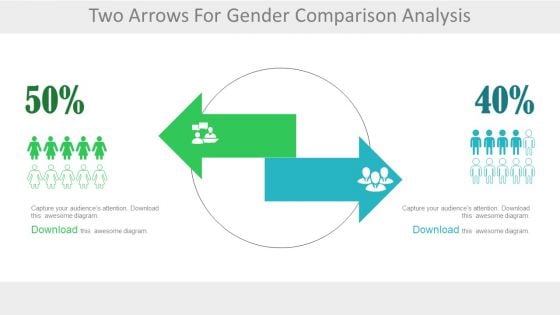
Two Arrows For Male Female Ratio Analysis Powerpoint Slides
Use this professionally created PowerPoint template to create the perfect slide to educate your audience about comparisons between choices and opinions of different genders. The slide can be used to denote the sex ratio or the changes occurring in the same. The 2 colored arrows can be used to refer to the 2 genders or even 2 teams or groups. This slide can be effectively used in corporate or business presentations to demonstrate the conversion of probable customers to sale. Other concepts like brain drain or brand preference or people making different choices can also be demonstrated using this template. A human resource manager can use this slide to demonstrate the transfer of employees to other locations or companies.

Gendered Terms Meaning In Powerpoint And Google Slides Cpb
Introducing our well designed Gendered Terms Meaning In Powerpoint And Google Slides Cpb. This PowerPoint design presents information on topics like Gendered Terms Meaning. As it is predesigned it helps boost your confidence level. It also makes you a better presenter because of its high quality content and graphics. This PPT layout can be downloaded and used in different formats like PDF, PNG, and JPG. Not only this, it is available in both Standard Screen and Widescreen aspect ratios for your convenience. Therefore, click on the download button now to persuade and impress your audience. Our Gendered Terms Meaning In Powerpoint And Google Slides Cpb are topically designed to provide an attractive backdrop to any subject. Use them to look like a presentation pro.
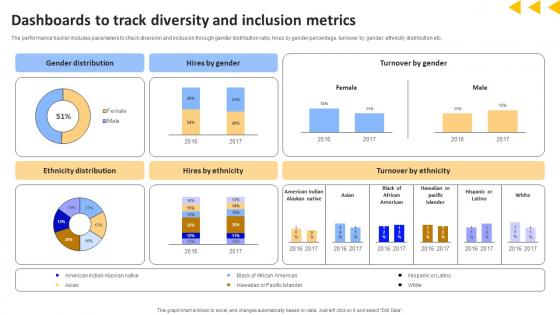
Workforce Productivity Improvement Dashboards To Track Diversity And Inclusion Metrics Structure Pdf
The performance tracker includes parameters to check diversion and inclusion through gender distribution ratio, hires by gender percentage, turnover by gender, ethnicity distribution etc. Coming up with a presentation necessitates that the majority of the effort goes into the content and the message you intend to convey. The visuals of a PowerPoint presentation can only be effective if it supplements and supports the story that is being told. Keeping this in mind our experts created Workforce Productivity Improvement Dashboards To Track Diversity And Inclusion Metrics Structure Pdf to reduce the time that goes into designing the presentation. This way, you can concentrate on the message while our designers take care of providing you with the right template for the situation. The performance tracker includes parameters to check diversion and inclusion through gender distribution ratio, hires by gender percentage, turnover by gender, ethnicity distribution etc.
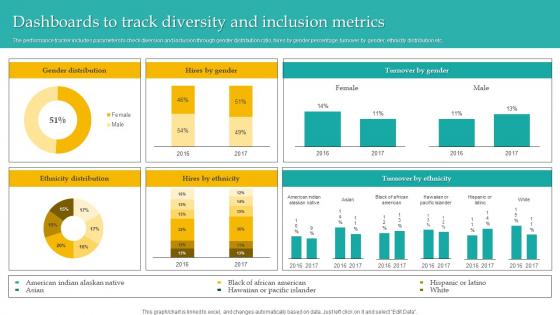
Dashboards Track Diversity Inclusion Administering Diversity And Inclusion At Workplace Template Pdf
The performance tracker includes parameters to check diversion and inclusion through gender distribution ratio, hires by gender percentage, turnover by gender, ethnicity distribution etc. Present like a pro with Dashboards Track Diversity Inclusion Administering Diversity And Inclusion At Workplace Template Pdf Create beautiful presentations together with your team, using our easy to use presentation slides. Share your ideas in real time and make changes on the fly by downloading our templates. So whether you are in the office, on the go, or in a remote location, you can stay in sync with your team and present your ideas with confidence. With Slidegeeks presentation got a whole lot easier. Grab these presentations today. The performance tracker includes parameters to check diversion and inclusion through gender distribution ratio, hires by gender percentage, turnover by gender, ethnicity distribution etc.
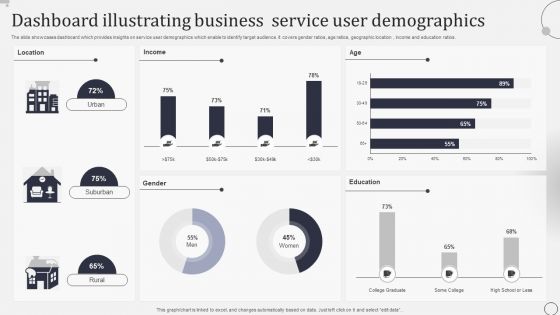
Dashboard Illustrating Business Service User Demographics Introduction PDF
The slide showcases dashboard which provides insights on service user demographics which enable to identify target audience. It covers gender ratios, age ratios, geographic location , income and education ratios. Showcasing this set of slides titled Dashboard Illustrating Business Service User Demographics Introduction PDF. The topics addressed in these templates are Location, Income, Age, Education. All the content presented in this PPT design is completely editable. Download it and make adjustments in color, background, font etc. as per your unique business setting.
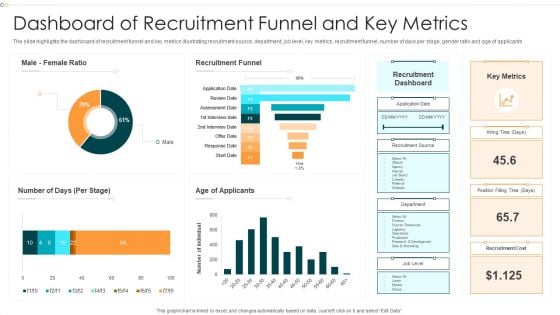
Dashboard Of Recruitment Funnel And Key Metrics Information PDF
The slide highlights the dashboard of recruitment funnel and key metrics illustrating recruitment source, department, job level, key metrics, recruitment funnel, number of days per stage, gender ratio and age of applicants.Pitch your topic with ease and precision using this Dashboard Of Recruitment Funnel And Key Metrics Information PDF This layout presents information on Recruitment Funnel, Recruitment Dashboard, Recruitment Cost It is also available for immediate download and adjustment. So, changes can be made in the color, design, graphics or any other component to create a unique layout.
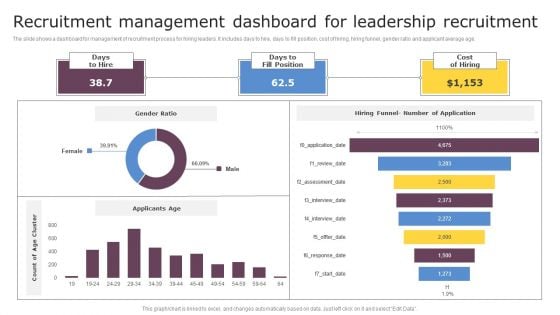
Recruitment Management Dashboard For Leadership Recruitment Graphics PDF
The slide shows a dashboard for management of recruitment process for hiring leaders. It includes days to hire, days to fill position, cost of hiring, hiring funnel, gender ratio and applicant average age. Showcasing this set of slides titled Recruitment Management Dashboard For Leadership Recruitment Graphics PDF. The topics addressed in these templates are Recruitment Management, Dashboard For Leadership. All the content presented in this PPT design is completely editable. Download it and make adjustments in color, background, font etc. as per your unique business setting.
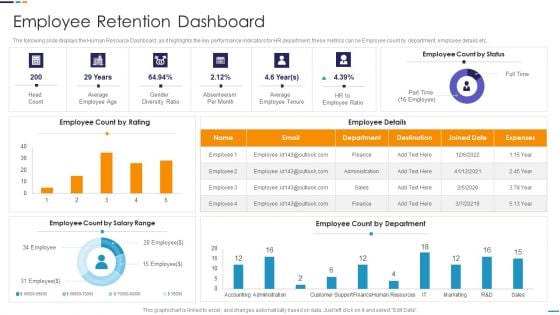
Employee Attrition Rate Management Employee Retention Dashboard Microsoft PDF
Deliver an awe inspiring pitch with this creative Employee Attrition Rate Management Employee Retention Dashboard Microsoft PDF bundle. Topics like Average Employee Age, Gender Diversity Ratio, Average Employee Tenure, Absenteeism Per Month, Department can be discussed with this completely editable template. It is available for immediate download depending on the needs and requirements of the user.
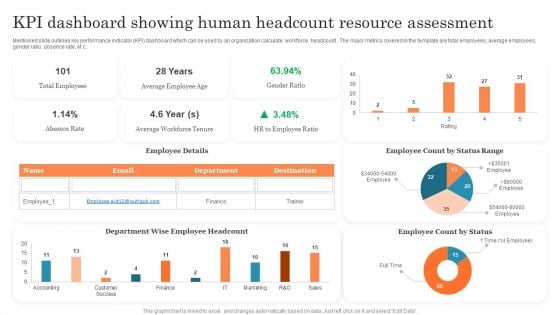
KPI Dashboard Showing Human Headcount Resource Assessment Ppt PowerPoint Presentation Outline PDF
Mentioned slide outlines key performance indicator KPI dashboard which can be used by an organization calculate workforce headcount . The major metrics covered in the template are total employees, average employees, gender ratio, absence rate, etc. Pitch your topic with ease and precision using this KPI Dashboard Showing Human Headcount Resource Assessment Ppt PowerPoint Presentation Outline PDF. This layout presents information on Total Employees, Average Employee, Employee Count. It is also available for immediate download and adjustment. So, changes can be made in the color, design, graphics or any other component to create a unique layout.

Skill Enhancement Performance Organization Staff Performance Evaluation Dashboard
This slide illustrate dashboard for staff performance evaluation for boosting performance level. it includes elements such as average employee age, average employee tenure, gender diversity ratio etc. Slidegeeks is here to make your presentations a breeze with Skill Enhancement Performance Organization Staff Performance Evaluation Dashboard With our easy-to-use and customizable templates, you can focus on delivering your ideas rather than worrying about formatting. With a variety of designs to choose from, you are sure to find one that suits your needs. And with animations and unique photos, illustrations, and fonts, you can make your presentation pop. So whether you are giving a sales pitch or presenting to the board, make sure to check out Slidegeeks first This slide illustrate dashboard for staff performance evaluation for boosting performance level. it includes elements such as average employee age, average employee tenure, gender diversity ratio etc.
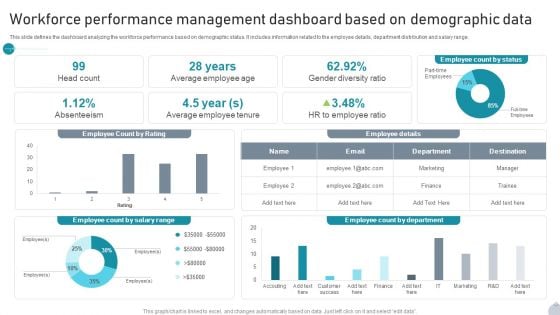
Workforce Performance Management Dashboard Based On Demographic Data Information PDF
This slide defines the dashboard analyzing the workforce performance based on demographic status. It includes information related to the employee details, department distribution and salary range. Showcasing this set of slides titled Workforce Performance Management Dashboard Based On Demographic Data Information PDF. The topics addressed in these templates are Employee Details, Department, Gender Diversity Ratio All the content presented in this PPT design is completely editable. Download it and make adjustments in color, background, font etc. as per your unique business setting.
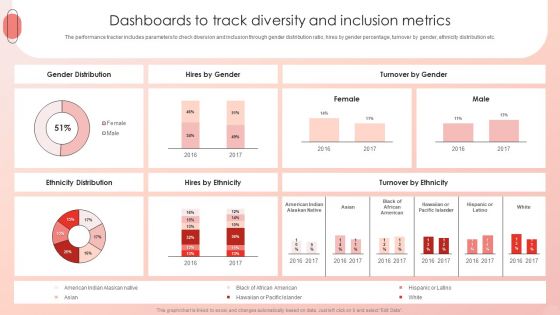
Improving HRM Process Dashboards To Track Diversity And Inclusion Metrics Background PDF
The performance tracker includes parameters to check diversion and inclusion through gender distribution ratio, hires by gender percentage, turnover by gender, ethnicity distribution etc. Are you in need of a template that can accommodate all of your creative concepts This one is crafted professionally and can be altered to fit any style. Use it with Google Slides or PowerPoint. Include striking photographs, symbols, depictions, and other visuals. Fill, move around, or remove text boxes as desired. Test out color palettes and font mixtures. Edit and save your work, or work with colleagues. Download Improving HRM Process Dashboards To Track Diversity And Inclusion Metrics Background PDF and observe how to make your presentation outstanding. Give an impeccable presentation to your group and make your presentation unforgettable.
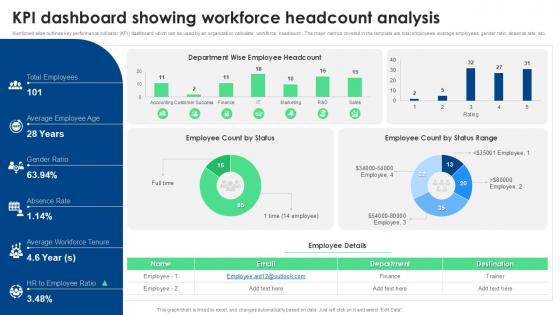
KPI Dashboard Snapshot Showing Workforce Headcount Analysis
From laying roadmaps to briefing everything in detail, our templates are perfect for you. You can set the stage with your presentation slides. All you have to do is download these easy-to-edit and customizable templates. KPI Dashboard Snapshot Showing Workforce Headcount Analysis will help you deliver an outstanding performance that everyone would remember and praise you for. Do download this presentation today. The KPI Dashboard Snapshot Showing Workforce Headcount Analysis is a visually compelling PowerPoint template designed to present key metrics related to workforce composition. It includes dynamic charts and graphs showcasing headcount trends, department breakdowns, gender ratios, and more. This template is perfect for HR teams and executives who need a concise overview of workforce analytics for strategic decision-making and operational efficiency.
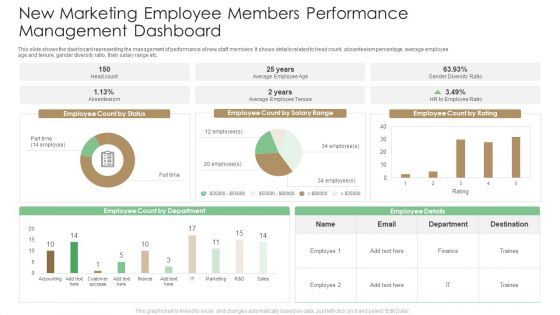
New Marketing Employee Members Performance Management Dashboard Summary PDF
This slide shows the dashboard representing the management of performance of new staff members. It shows details related to head count, absenteeism percentage, average employee age and tenure, gender diversity ratio, their salary range etc. Pitch your topic with ease and precision using this New Marketing Employee Members Performance Management Dashboard Summary PDF. This layout presents information on Employee Ratio, Average Employee Tenure. It is also available for immediate download and adjustment. So, changes can be made in the color, design, graphics or any other component to create a unique layout.
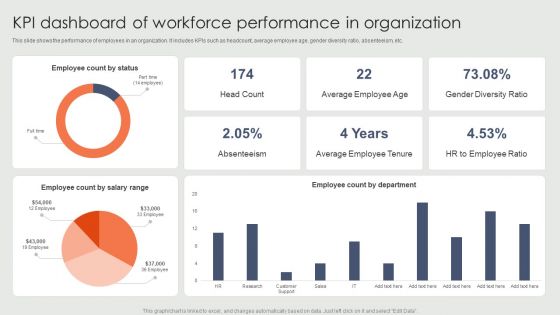
KPI Dashboard Of Workforce Performance In Organization Ppt Gallery Portfolio PDF

KPI Dashboard To Manage And Track Personnel Administration Summary PDF
This slide shows the dashboard which can be used to monitor performance of employees in an organization. It includes metrics such as headcount, average employee age, gender diversity ratio, absenteeism, etc. Showcasing this set of slides titled KPI Dashboard To Manage And Track Personnel Administration Summary PDF. The topics addressed in these templates are Employee Count Status, Employee Count Department, Employee Count Salary Range. All the content presented in this PPT design is completely editable. Download it and make adjustments in color, background, font etc. as per your unique business setting.
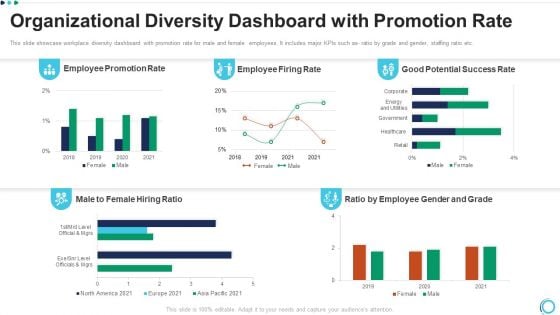
Organizational Diversity Dashboard With Promotion Rate Topics PDF
This slide showcase workplace diversity dashboard with promotion rate for male and female employees. It includes major KPIs such as ratio by grade and gender, staffing ratio etc. Showcasing this set of slides titled organizational diversity dashboard with promotion rate topics pdf. The topics addressed in these templates are employee promotion rate, employee firing rate, good potential success rate. All the content presented in this PPT design is completely editable. Download it and make adjustments in color, background, font etc. as per your unique business setting.
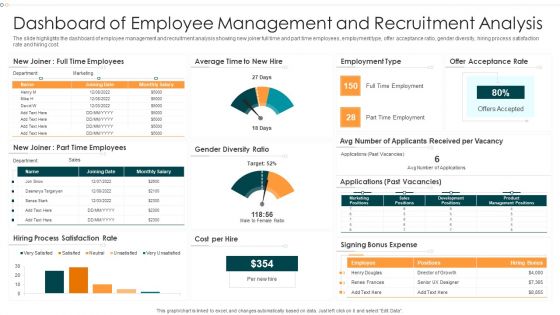
Dashboard Of Employee Management And Recruitment Analysis Infographics PDF
The slide highlights the dashboard of employee management and recruitment analysis showing new joiner full time and part time employees, employment type, offer acceptance ratio, gender diversity, hiring process satisfaction rate and hiring cost.Pitch your topic with ease and precision using this Dashboard Of Employee Management And Recruitment Analysis Infographics PDF This layout presents information on Dashboard Employee, Management, Recruitment Analysis It is also available for immediate download and adjustment. So, changes can be made in the color, design, graphics or any other component to create a unique layout.

Workspace Diversification And Inclusion Strategy Diversity And Inclusion Dashboard Leaders Brochure PDF
This infographic provides the DandI dashboard which covers promotion rate, termination rate, staffing ratio, etc. Deliver and pitch your topic in the best possible manner with this workspace diversification and inclusion strategy diversity and inclusion dashboard leaders brochure pdf. Use them to share invaluable insights on male to female staffing ratio, comp ratio by grade and gender, promotion rate in, termination rate future leaders, high potential successor rate and impress your audience. This template can be altered and modified as per your expectations. So, grab it now.
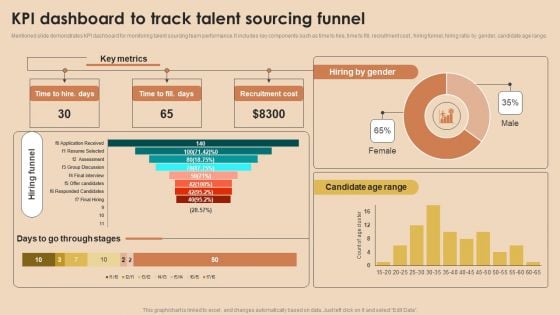
Detailed Guide For Talent Acquisition KPI Dashboard To Track Talent Sourcing Funnel Elements PDF
Mentioned slide demonstrates KPI dashboard for monitoring talent sourcing team performance. It includes key components such as time to hire, time to fill, recruitment cost , hiring funnel, hiring ratio by gender, candidate age range. Do you know about Slidesgeeks Detailed Guide For Talent Acquisition KPI Dashboard To Track Talent Sourcing Funnel Elements PDF These are perfect for delivering any kind od presentation. Using it, create PowerPoint presentations that communicate your ideas and engage audiences. Save time and effort by using our pre designed presentation templates that are perfect for a wide range of topic. Our vast selection of designs covers a range of styles, from creative to business, and are all highly customizable and easy to edit. Download as a PowerPoint template or use them as Google Slides themes.
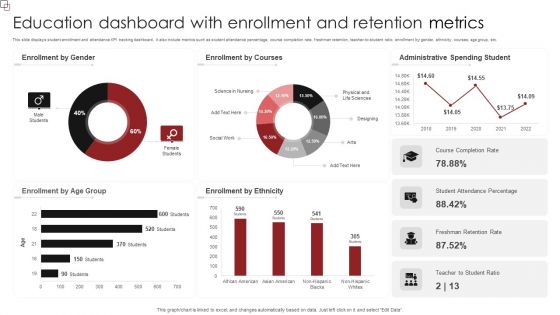
Education Dashboard With Enrollment And Retention Metrics Sample PDF
This slide displays student enrollment and attendance KPI tracking dashboard. It also include metrics such as student attendance percentage, course completion rate, freshman retention, teacher-to-student ratio, enrollment by gender, ethnicity, courses, age group, etc. Pitch your topic with ease and precision using this Education Dashboard With Enrollment And Retention Metrics Sample PDF. This layout presents information on Enrollment Gender, Enrollment Courses, Administrative Spending Student. It is also available for immediate download and adjustment. So, changes can be made in the color, design, graphics or any other component to create a unique layout.
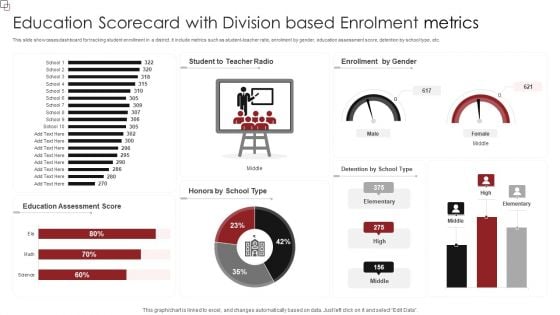
Education Scorecard With Division Based Enrolment Metrics Professional PDF
This slide showcases dashboard for tracking student enrollment in a district. It include metrics such as student-teacher ratio, enrolment by gender, education assessment score, detention by school type, etc. Pitch your topic with ease and precision using this Education Scorecard With Division Based Enrolment Metrics Professional PDF. This layout presents information on Education Assessment Score, Enrollment Gender. It is also available for immediate download and adjustment. So, changes can be made in the color, design, graphics or any other component to create a unique layout.
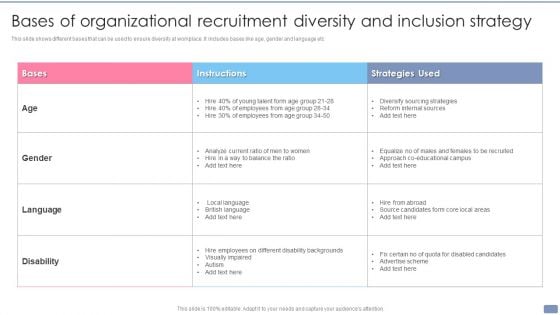
Bases Of Organizational Recruitment Diversity And Inclusion Strategy Inspiration PDF
This slide shows different bases that can be used to ensure diversity at workplace .It includes bases like age, gender and language etc. Showcasing this set of slides titled Bases Of Organizational Recruitment Diversity And Inclusion Strategy Inspiration PDF. The topics addressed in these templates are Analyze Current Ratio, Source, Employees. All the content presented in this PPT design is completely editable. Download it and make adjustments in color, background, font etc. as per your unique business setting.
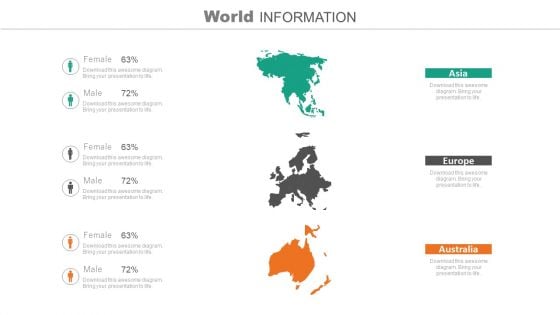
Population Of Asia Europe And Australia PowerPoint Slides
Above is the Power Point template which has the graphical maps of Asia, Europe and Australia. This creatively designed visual is the perfect slide to demonstrate the comparison between male and female about their patterns. You can also use this PPT template to show the prevalent sex ratio in these countries. This slide can also be used to depict the number of customers which are using your company?s brand according to the genders. The icon, color and text are easy to modify. You can change them as per your requirement. It would be easy for the audience to understand these points visually rather than verbally or in the conventional text form. You must include this template in your presentation if you want them to grasp the idea the way you intend them to. Your presentation won?t only look amazing, it is bound to leave an everlasting impression as well.


 Continue with Email

 Home
Home


