Goal Chart
Survey Results Depicting Problems Building Utility Billing And Invoicing Management System Icons Pdf
Following slide shows survey results to understand challenges in company billing system. It include pointers such as management issue, data manipulation, complexity, reporting concern etc. This Survey Results Depicting Problems Building Utility Billing And Invoicing Management System Icons Pdf from Slidegeeks makes it easy to present information on your topic with precision. It provides customization options, so you can make changes to the colors, design, graphics, or any other component to create a unique layout. It is also available for immediate download, so you can begin using it right away. Slidegeeks has done good research to ensure that you have everything you need to make your presentation stand out. Make a name out there for a brilliant performance. Following slide shows survey results to understand challenges in company billing system. It include pointers such as management issue, data manipulation, complexity, reporting concern etc.
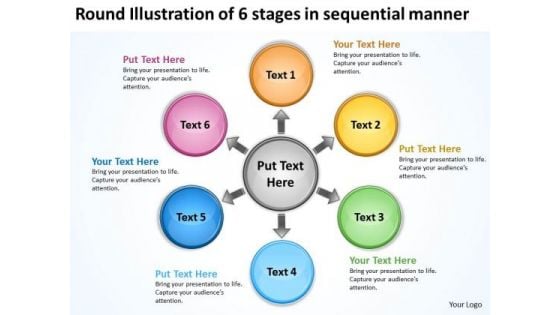
Illustration Of 6 Stages In Sequential Manner Arrows Network Software PowerPoint Templates
We present our illustration of 6 stages in sequential manner Arrows Network Software PowerPoint templates.Present our Circle Charts PowerPoint Templates because support groups are an essential element of the on going struggle against cancer. Present our Arrows PowerPoint Templates because this template helps you to delve on these thoughts and brief your team on the value of your depth of understanding of the subject. Present our Business PowerPoint Templates because this Layout can explain the relevance of the different layers and stages in getting down to your core competence, ability and desired result. Present our Shapes PowerPoint Templates because the basic stages are in place, you need to build upon them with our PowerPoint templates. Download our Flow Charts PowerPoint Templates because our template will help pinpoint their viability.Use these PowerPoint slides for presentations relating to abstract, art, backdrop, background, banner, black, blank, board, border, bubble, button, circle, concept, creative, dark, decoration, decorative, design, digital, element, frame, futuristic, glossy, graphic, grey, illustration, layout, light, modern, panel, round, shiny, speech, surface, table, tech, techno, template, urban, vector, wallpaper, web, website. The prominent colors used in the PowerPoint template are Yellow, Green, Blue. Customers tell us our illustration of 6 stages in sequential manner Arrows Network Software PowerPoint templates provide great value for your money. Be assured of finding the best projection to highlight your words. PowerPoint presentation experts tell us our board PowerPoint templates and PPT Slides are Graceful. People tell us our illustration of 6 stages in sequential manner Arrows Network Software PowerPoint templates are One-of-a-kind. People tell us our border PowerPoint templates and PPT Slides are Precious. Customers tell us our illustration of 6 stages in sequential manner Arrows Network Software PowerPoint templates are No-nonsense. People tell us our border PowerPoint templates and PPT Slides will help you be quick off the draw. Just enter your specific text and see your points hit home. Bring on the heat with our Illustration Of 6 Stages In Sequential Manner Arrows Network Software PowerPoint Templates. All your doubts will begin to evaporate.
Dashboard For Tracking Onboarding Email Campaign Results Designs Pdf
The purpose of this slide is to represent a dashboard for welcome email campaign result to analyse the success rate. It includes component such as click through rate, click to open ratio, soft bounce rate, unsubscribe rate, hard bounce rate etc. Pitch your topic with ease and precision using this Dashboard For Tracking Onboarding Email Campaign Results Designs Pdf. This layout presents information on Monthly Total Subscribers, Monthly Open Rate, Unsubscribe Rate . It is also available for immediate download and adjustment. So, changes can be made in the color, design, graphics or any other component to create a unique layout. The purpose of this slide is to represent a dashboard for welcome email campaign result to analyse the success rate. It includes component such as click through rate, click to open ratio, soft bounce rate, unsubscribe rate, hard bounce rate etc.
Kpi Dashboard For Tracking Social Media Campaign Results Powerful Marketing Techniques Strategy SS V
This slide covers the dashboard for analyzing social media marketing campaigns. It includes metrics such as tweets, followers, followings, listed favorites, reach, views, Facebook engagement, clicks, likes, Instagram photos, etc. This Kpi Dashboard For Tracking Social Media Campaign Results Powerful Marketing Techniques Strategy SS V from Slidegeeks makes it easy to present information on your topic with precision. It provides customization options, so you can make changes to the colors, design, graphics, or any other component to create a unique layout. It is also available for immediate download, so you can begin using it right away. Slidegeeks has done good research to ensure that you have everything you need to make your presentation stand out. Make a name out there for a brilliant performance. This slide covers the dashboard for analyzing social media marketing campaigns. It includes metrics such as tweets, followers, followings, listed favorites, reach, views, Facebook engagement, clicks, likes, Instagram photos, etc.
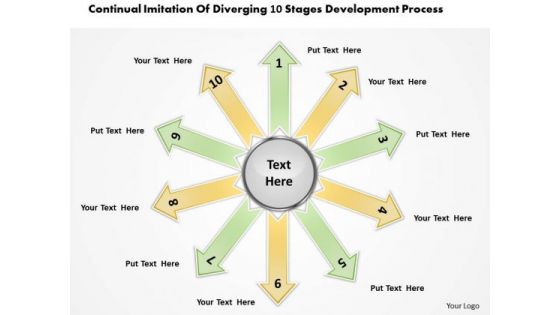
Imitation Of Diverging 10 Stages Development Process Ppt Pie Diagram PowerPoint Templates
We present our imitation of diverging 10 stages development process ppt Pie Diagram PowerPoint templates.Download our Arrows PowerPoint Templates because this layout helps you to see satisfaction spread across the room as they unravel your gifted views. Use our Circle Charts PowerPoint Templates because this Layout can explain the relevance of the different layers and stages in getting down to your core competence, ability and desired result. Use our Shapes PowerPoint Templates because it has inspired a whole new world of medical endeavour. Download our Business PowerPoint Templates because you can Lead your flock steadily to greater heights. Look around at the vast potential of achievement around you. Present our Flow Charts PowerPoint Templates because this is an excellent slide to detail and highlight your thought process, your views and your positive expectations..Use these PowerPoint slides for presentations relating to arrow, arrowheads, badge, banner, blue, button, cerulean, cobalt, colored, colorful, connection, cursor, cyan, design element, designator, icon, indicator, interface, internet, link, load, magenta, marker, matted, menu tool, navigation panel, next, orientation, page site, pictogram, pink, pointer, red, right, satined, sign, signpost, smooth, symbol, . The prominent colors used in the PowerPoint template are Yellow, Green, Gray. Presenters tell us our imitation of diverging 10 stages development process ppt Pie Diagram PowerPoint templates are Attractive. You can be sure our button PowerPoint templates and PPT Slides will make the presenter successul in his career/life. Professionals tell us our imitation of diverging 10 stages development process ppt Pie Diagram PowerPoint templates will impress their bosses and teams. People tell us our button PowerPoint templates and PPT Slides are Elevated. People tell us our imitation of diverging 10 stages development process ppt Pie Diagram PowerPoint templates provide great value for your money. Be assured of finding the best projection to highlight your words. Professionals tell us our blue PowerPoint templates and PPT Slides are Pretty. Give a fillip to your plans with our Imitation Of Diverging 10 Stages Development Process Ppt Pie Diagram PowerPoint Templates. They will get that extra attention you seek.
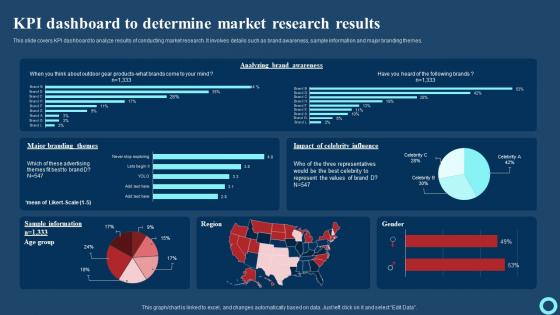
KPI Dashboard To Determine Market Research Results Effective Strategies To Enhance Structure Pdf
This slide covers KPI dashboard to analyze results of conducting market research. It involves details such as brand awareness, sample information and major branding themes. Do you have an important presentation coming up Are you looking for something that will make your presentation stand out from the rest Look no further than KPI Dashboard To Determine Market Research Results Effective Strategies To Enhance Structure Pdf With our professional designs, you can trust that your presentation will pop and make delivering it a smooth process. And with Slidegeeks, you can trust that your presentation will be unique and memorable. So why wait Grab KPI Dashboard To Determine Market Research Results Effective Strategies To Enhance Structure Pdf today and make your presentation stand out from the rest. This slide covers KPI dashboard to analyze results of conducting market research. It involves details such as brand awareness, sample information and major branding themes.
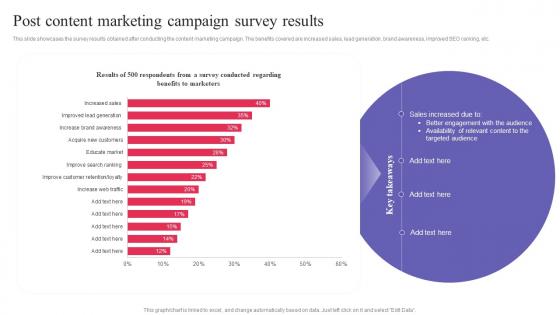
Post Content Marketing Campaign Survey Results Digital Promotional Campaign Guidelines Pdf
This slide showcases the survey results obtained after conducting the content marketing campaign. The benefits covered are increased sales, lead generation, brand awareness, improved SEO ranking, etc. Presenting this PowerPoint presentation, titled Post Content Marketing Campaign Survey Results Digital Promotional Campaign Guidelines Pdf, with topics curated by our researchers after extensive research. This editable presentation is available for immediate download and provides attractive features when used. Download now and captivate your audience. Presenting this Post Content Marketing Campaign Survey Results Digital Promotional Campaign Guidelines Pdf. Our researchers have carefully researched and created these slides with all aspects taken into consideration. This is a completely customizable Post Content Marketing Campaign Survey Results Digital Promotional Campaign Guidelines Pdf that is available for immediate downloading. Download now and make an impact on your audience. Highlight the attractive features available with our PPTs. This slide showcases the survey results obtained after conducting the content marketing campaign. The benefits covered are increased sales, lead generation, brand awareness, improved SEO ranking, etc.
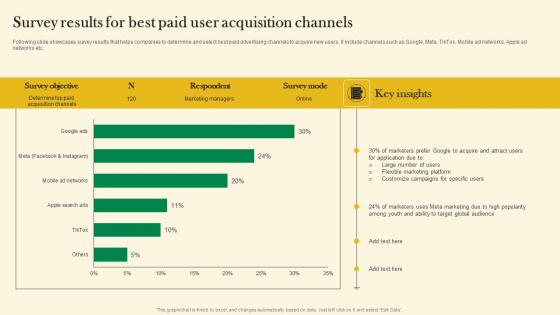
Survey Results For Best Paid User Acquisition Channels Online Customer Acquisition Rules Pdf
Following slide showcases survey results that helps companies to determine and select best paid advertising channels to acquire new users. It include channels such as Google, Meta, TikTok, Mobile ad networks, Apple ad networks etc. This Survey Results For Best Paid User Acquisition Channels Online Customer Acquisition Rules Pdf from Slidegeeks makes it easy to present information on your topic with precision. It provides customization options, so you can make changes to the colors, design, graphics, or any other component to create a unique layout. It is also available for immediate download, so you can begin using it right away. Slidegeeks has done good research to ensure that you have everything you need to make your presentation stand out. Make a name out there for a brilliant performance. Following slide showcases survey results that helps companies to determine and select best paid advertising channels to acquire new users. It include channels such as Google, Meta, TikTok, Mobile ad networks, Apple ad networks etc.

Survey Results Depicting Enhancing Customer Service Operations Using CRM Technology Download Pdf
Following slide shows survey results to understand challenges in company billing system. It include pointers such as management issue, data manipulation, complexity, reporting concern etc. Take your projects to the next level with our ultimate collection of Survey Results Depicting Enhancing Customer Service Operations Using CRM Technology Download Pdf. Slidegeeks has designed a range of layouts that are perfect for representing task or activity duration, keeping track of all your deadlines at a glance. Tailor these designs to your exact needs and give them a truly corporate look with your own brand colors they will make your projects stand out from the rest Following slide shows survey results to understand challenges in company billing system. It include pointers such as management issue, data manipulation, complexity, reporting concern etc.
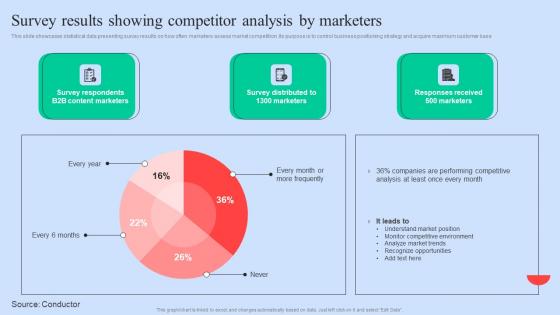
Survey Results Showing Executing Competitors Strategies To Assess Organizational Performance Download Pdf
This slide showcases statistical data presenting survey results on how often marketers assess market competition. Its purpose is to control business positioning strategy and acquire maximum customer base Take your projects to the next level with our ultimate collection of Survey Results Showing Executing Competitors Strategies To Assess Organizational Performance Download Pdf. Slidegeeks has designed a range of layouts that are perfect for representing task or activity duration, keeping track of all your deadlines at a glance. Tailor these designs to your exact needs and give them a truly corporate look with your own brand colors they will make your projects stand out from the rest This slide showcases statistical data presenting survey results on how often marketers assess market competition. Its purpose is to control business positioning strategy and acquire maximum customer base
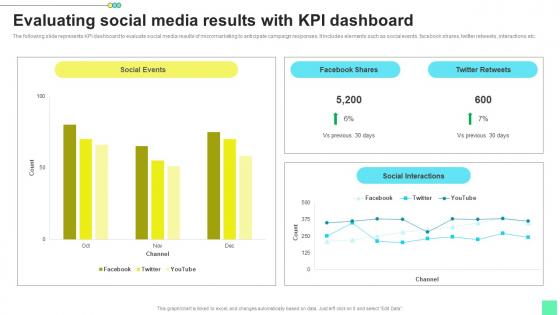
Evaluating Social Media Results Introduction To Niche Marketing Audience Segmentation Microsoft Pdf
The following slide represents KPI dashboard to evaluate social media results of micromarketing to anticipate campaign responses. It includes elements such as social events, facebook shares, twitter retweets, interactions etc. Make sure to capture your audiences attention in your business displays with our gratis customizable Evaluating Social Media Results Introduction To Niche Marketing Audience Segmentation Microsoft Pdf. These are great for business strategies, office conferences, capital raising or task suggestions. If you desire to acquire more customers for your tech business and ensure they stay satisfied, create your own sales presentation with these plain slides. The following slide represents KPI dashboard to evaluate social media results of micromarketing to anticipate campaign responses. It includes elements such as social events, facebook shares, twitter retweets, interactions etc.
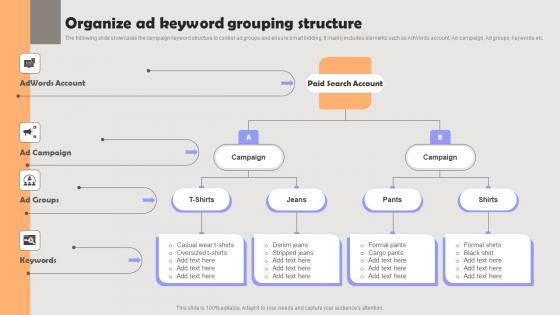
Improving PPC Campaign Results Organize Ad Keyword Grouping Structure Demonstration Pdf
The following slide showcases the campaign keyword structure to control ad groups and ensure smart bidding. It mainly includes elements such as AdWords account, Ad campaign, Ad groups, keywords etc. Retrieve professionally designed Improving PPC Campaign Results Organize Ad Keyword Grouping Structure Demonstration Pdf to effectively convey your message and captivate your listeners. Save time by selecting pre-made slideshows that are appropriate for various topics, from business to educational purposes. These themes come in many different styles, from creative to corporate, and all of them are easily adjustable and can be edited quickly. Access them as PowerPoint templates or as Google Slides themes. You do not have to go on a hunt for the perfect presentation because Slidegeeks got you covered from everywhere. The following slide showcases the campaign keyword structure to control ad groups and ensure smart bidding. It mainly includes elements such as AdWords account, Ad campaign, Ad groups, keywords etc.
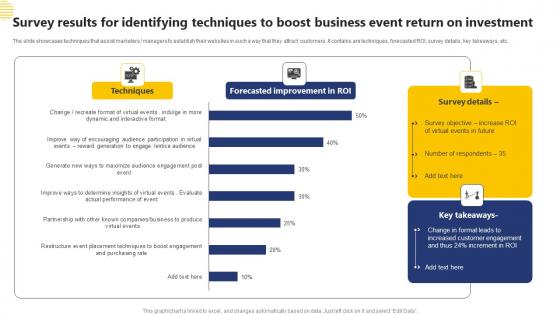
Survey Results For Identifying Techniques To Boost Business Event Return On Investment Introduction Pdf
The slide showcases techniques that assist marketers managers to establish their websites in such a way that they attract customers .It contains are techniques, forecasted ROI, survey details, key takeaways, etc. Pitch your topic with ease and precision using this Survey Results For Identifying Techniques To Boost Business Event Return On Investment Introduction Pdf This layout presents information on Survey Results, Identifying Techniques, Business Event It is also available for immediate download and adjustment. So, changes can be made in the color, design, graphics or any other component to create a unique layout. The slide showcases techniques that assist marketers managers to establish their websites in such a way that they attract customers .It contains are techniques, forecasted ROI, survey details, key takeaways, etc.
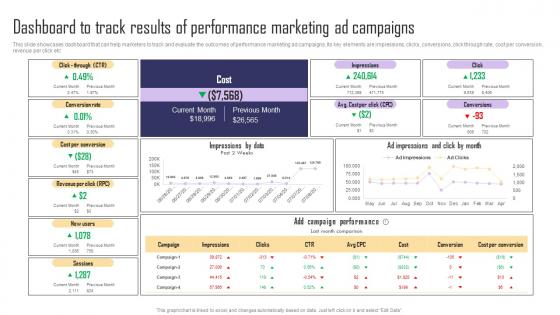
Dashboard To Track Results Of Performance Marketing Paid Internet Marketing Strategy Information Pdf
This slide showcases dashboard that can help marketers to track and evaluate the outcomes of performance marketing ad campaigns. Its key elements are impressions, clicks, conversions, click through rate, cost per conversion, revenue per click etc. Do you have an important presentation coming up Are you looking for something that will make your presentation stand out from the rest Look no further than Dashboard To Track Results Of Performance Marketing Paid Internet Marketing Strategy Information Pdf. With our professional designs, you can trust that your presentation will pop and make delivering it a smooth process. And with Slidegeeks, you can trust that your presentation will be unique and memorable. So why wait Grab Dashboard To Track Results Of Performance Marketing Paid Internet Marketing Strategy Information Pdf today and make your presentation stand out from the rest. This slide showcases dashboard that can help marketers to track and evaluate the outcomes of performance marketing ad campaigns. Its key elements are impressions, clicks, conversions, click through rate, cost per conversion, revenue per click etc.

Load Testing Performance Monitoring Dashboard Stress Testing For Robust Ppt Template
The purpose of this slide is to highlight the components in the load testing performance monitoring dashboard such as load size, hit time, log message, failed rounds, throughput, etc. Whether you have daily or monthly meetings, a brilliant presentation is necessary. Load Testing Performance Monitoring Dashboard Stress Testing For Robust Ppt Template can be your best option for delivering a presentation. Represent everything in detail using Load Testing Performance Monitoring Dashboard Stress Testing For Robust Ppt Template and make yourself stand out in meetings. The template is versatile and follows a structure that will cater to your requirements. All the templates prepared by Slidegeeks are easy to download and edit. Our research experts have taken care of the corporate themes as well. So, give it a try and see the results. The purpose of this slide is to highlight the components in the load testing performance monitoring dashboard such as load size, hit time, log message, failed rounds, throughput, etc.
PowerPoint Insert Arrow Forward Explanations Of Process 5 Stages Templates
We present our powerpoint insert arrow forward explanations of process 5 stages templates.Download our Circle Charts PowerPoint Templates because You should Kick up a storm with our PowerPoint Templates and Slides. The heads of your listeners will swirl with your ideas. Download and present our Ring Charts PowerPoint Templates because You can Zap them with our PowerPoint Templates and Slides. See them reel under the impact. Download and present our Business PowerPoint Templates because You can Double your output with our PowerPoint Templates and Slides. They make beating deadlines a piece of cake. Download and present our Marketing PowerPoint Templates because Our PowerPoint Templates and Slides are created by a hardworking bunch of busybees. Always flitting around with solutions gauranteed to please. Present our Process and Flows PowerPoint Templates because Your audience will believe you are the cats whiskers.Use these PowerPoint slides for presentations relating to Abstract, arrow, art, background, banner,blue, bright, business, circle, color,colorful, concept, conceptual, connection,creative, cycle, design, different, element,empty, form, frame, graphic, group, idea, illustration, match,message, order, part, petal, piece, place, ring, shape, solution, special,speech, strategy, symbol. The prominent colors used in the PowerPoint template are Yellow, Gray, White. PowerPoint presentation experts tell us our powerpoint insert arrow forward explanations of process 5 stages templates will generate and maintain the level of interest you desire. They will create the impression you want to imprint on your audience. Presenters tell us our background PowerPoint templates and PPT Slides will get their audience's attention. Use our powerpoint insert arrow forward explanations of process 5 stages templates will generate and maintain the level of interest you desire. They will create the impression you want to imprint on your audience. People tell us our business PowerPoint templates and PPT Slides are topically designed to provide an attractive backdrop to any subject. Presenters tell us our powerpoint insert arrow forward explanations of process 5 stages templates will help you be quick off the draw. Just enter your specific text and see your points hit home. Presenters tell us our background PowerPoint templates and PPT Slides will get their audience's attention. Get them to pay attention with our PowerPoint Insert Arrow Forward Explanations Of Process 5 Stages Templates. You will come out on top.
World Business PowerPoint Templates Process Relative Cycle Arrow Network Slides
We present our world business powerpoint templates process Relative Cycle Arrow Network Slides.Present our Arrows PowerPoint Templates because the Venn graphic comprising interlinking circles geometrically demonstate how various functions operating independantly, to a large extent, are essentially interdependant. Download our Circle Charts PowerPoint Templates because you can Unravel the desired and essential elements of your overall strategy. Present our Shapes PowerPoint Templates because You can Be the star of the show with our PowerPoint Templates and Slides. Rock the stage with your ideas. Use our Business PowerPoint Templates because it will demonstrate the strength of character under severe stress. Shine the torch ahead and bring the light to shine on all. Use our Flow Charts PowerPoint Templates because the Gear train is a basic element of living and daily business.Use these PowerPoint slides for presentations relating to abstract, action, arrow, background, bang, bright, burst, carnival, celebration, color, colorful, concentration, contour, curled, decoration, design, divergent, evolution, explosions, explosive, festival, firecracker, firework, flare, flash, glow, graphic, growth, illustration, lights, magic, magical, modern, motion, objects, ornate, outline, pointer, rays, salute, shape, shiny, show, silhouette, sparks, spiral, sunlight, symbol, vector, wallpaper. The prominent colors used in the PowerPoint template are Blue, Gray, Black. Presenters tell us our world business powerpoint templates process Relative Cycle Arrow Network Slides are Spiffy. The feedback we get is that our celebration PowerPoint templates and PPT Slides are designed to make your presentations professional. Presenters tell us our world business powerpoint templates process Relative Cycle Arrow Network Slides will help them to explain complicated concepts. You can be sure our arrow PowerPoint templates and PPT Slides provide you with a vast range of viable options. Select the appropriate ones and just fill in your text. People tell us our world business powerpoint templates process Relative Cycle Arrow Network Slides are Clever. PowerPoint presentation experts tell us our carnival PowerPoint templates and PPT Slides are Excellent. Get your audience all activated to go. Emit exhilirating energy with our World Business PowerPoint Templates Process Relative Cycle Arrow Network Slides.
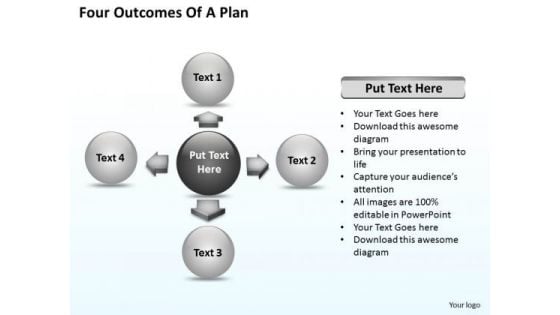
Sample Business Process Diagram PowerPoint 2010 Templates Ppt Backgrounds For Slides
We present our sample business process diagram powerpoint 2010 templates PPT backgrounds for slides.Use our Flow Charts PowerPoint Templates because Our PowerPoint Templates and Slides will fulfill your every need. Use them and effectively satisfy the desires of your audience. Download and present our Technology PowerPoint Templates because You aspire to touch the sky with glory. Let our PowerPoint Templates and Slides provide the fuel for your ascent. Use our Network Diagrams PowerPoint Templates because Our PowerPoint Templates and Slides are like the strings of a tennis racquet. Well strung to help you serve aces. Present our Circle Charts PowerPoint Templates because Our PowerPoint Templates and Slides will provide you a launch platform. Give a lift off to your ideas and send them into orbit. Present our Shapes PowerPoint Templates because You aspire to touch the sky with glory. Let our PowerPoint Templates and Slides provide the fuel for your ascent.Use these PowerPoint slides for presentations relating to Communication, computer, computer center, computer ,congress, customer, data center, processing center, distribution, distribution channels, economy, electronic data processing, employee, external work, graphics, group, illustrations, information technology, innovation, international, internet, marketing, meeting, network, networking, people, production, department, team. The prominent colors used in the PowerPoint template are Gray, White, Black. Professionals tell us our sample business process diagram powerpoint 2010 templates PPT backgrounds for slides have awesome images to get your point across. Presenters tell us our center PowerPoint templates and PPT Slides will make the presenter successul in his career/life. The feedback we get is that our sample business process diagram powerpoint 2010 templates PPT backgrounds for slides will make the presenter successul in his career/life. Use our computer PowerPoint templates and PPT Slides will get their audience's attention. You can be sure our sample business process diagram powerpoint 2010 templates PPT backgrounds for slides look good visually. Customers tell us our customer PowerPoint templates and PPT Slides are visually appealing. Our Sample Business Process Diagram PowerPoint 2010 Templates Ppt Backgrounds For Slides maintain equilibrium. Give your thoughts that balanced look.
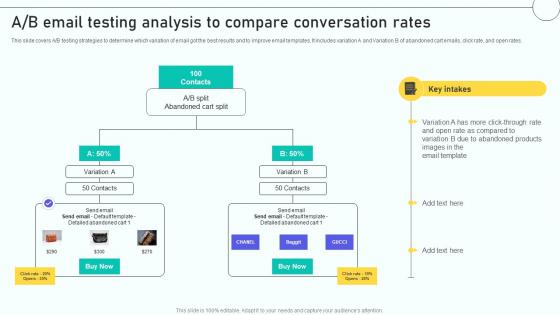
Email Marketing Automation Process A B Email Testing Analysis To Compare Conversation
This slide covers A or B testing strategies to determine which variation of email got the best results and to improve email templates. It includes variation A and Variation B of abandoned cart emails, click rate, and open rates. Get a simple yet stunning designed Email Marketing Automation Process A B Email Testing Analysis To Compare Conversation. It is the best one to establish the tone in your meetings. It is an excellent way to make your presentations highly effective. So, download this PPT today from Slidegeeks and see the positive impacts. Our easy-to-edit Email Marketing Automation Process A B Email Testing Analysis To Compare Conversation can be your go-to option for all upcoming conferences and meetings. So, what are you waiting for Grab this template today. This slide covers A or B testing strategies to determine which variation of email got the best results and to improve email templates. It includes variation A and Variation B of abandoned cart emails, click rate, and open rates.
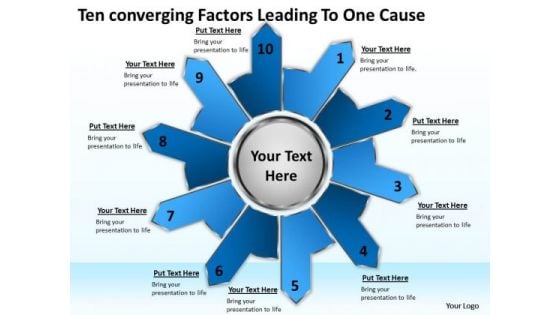
Ten Converging Factors Leading One Cause Circular Spoke Diagram PowerPoint Templates
We present our ten converging factors leading one cause Circular Spoke Diagram PowerPoint templates.Download our Circle Charts PowerPoint Templates because with the help of our Slides you can Illustrate your plans on using the many social media modes available to inform soceity at large of the benefits of your product. Download our Arrows PowerPoint Templates because the basic stages are in place, you need to build upon them with our PowerPoint templates. Present our Business PowerPoint Templates because profit levels have been steady over the recent past. Spread your heightened excitement to others in the room. Download our Shapes PowerPoint Templates because your brain is always churning out ideas like cogs in a wheel. Use our Flow Charts PowerPoint Templates because it helps to anticipate the doubts and questions in the minds of your colleagues and enlighten them with your inspired strategy to garner desired success.Use these PowerPoint slides for presentations relating to abstract, arrows, art, banner, block, blue, box, bright, business, color, colorful, concept, conceptual, connection, creative, cube, design, different, element, empty, form, frame, graphic, green, group, idea, illustration, match, message, order, part, piece, place, puzzle, red, shape, solution, special, speech, square, strategy, symbol, template, text, usable, vector, web, website. The prominent colors used in the PowerPoint template are Blue, Blue navy, Gray. Customers tell us our ten converging factors leading one cause Circular Spoke Diagram PowerPoint templates are Wistful. PowerPoint presentation experts tell us our business PowerPoint templates and PPT Slides are Vintage. People tell us our ten converging factors leading one cause Circular Spoke Diagram PowerPoint templates are Nifty. People tell us our box PowerPoint templates and PPT Slides are specially created by a professional team with vast experience. They diligently strive to come up with the right vehicle for your brilliant Ideas. Customers tell us our ten converging factors leading one cause Circular Spoke Diagram PowerPoint templates are Youthful. People tell us our blue PowerPoint templates and PPT Slides will help them to explain complicated concepts. Keep it cool and chatty with our Ten Converging Factors Leading One Cause Circular Spoke Diagram PowerPoint Templates. Enlighten and entertain with your thoughts.
Business People Pictures 3d Man With Questions PowerPoint Templates Ppt Backgrounds For Slides
We present our business people pictures 3d man with questions PowerPoint templates PPT backgrounds for slides.Present our People PowerPoint Templates because You have gained great respect for your brilliant ideas. Use our PowerPoint Templates and Slides to strengthen and enhance your reputation. Use our Circle Charts PowerPoint Templates because Our PowerPoint Templates and Slides will generate and maintain the level of interest you desire. They will create the impression you want to imprint on your audience. Present our Ring Charts PowerPoint Templates because Our PowerPoint Templates and Slides will help you be quick off the draw. Just enter your specific text and see your points hit home. Download and present our Shapes PowerPoint Templates because You canTake a leap off the starting blocks with our PowerPoint Templates and Slides. They will put you ahead of the competition in quick time. Download and present our Future PowerPoint Templates because Our PowerPoint Templates and Slides are the chords of your song. String them along and provide the lilt to your views.Use these PowerPoint slides for presentations relating to 3d, around, ask, assistance, business, care, career, circle,communication, community, companionship, concept, connection, cooperation,crowd, friend, friendship, group, hand, help, human, illustration, information,isolated, man, mark, organization, outstretched, partner, partnership, people,quest, question, red, sign, social, solidarity, solution, support, symbol, team,teamwork, together, togetherness, union, unity, white background. The prominent colors used in the PowerPoint template are White, Red, Black. Professionals tell us our business people pictures 3d man with questions PowerPoint templates PPT backgrounds for slides are aesthetically designed to attract attention. We guarantee that they will grab all the eyeballs you need. People tell us our assistance PowerPoint templates and PPT Slides are second to none. We assure you our business people pictures 3d man with questions PowerPoint templates PPT backgrounds for slides are incredible easy to use. Presenters tell us our career PowerPoint templates and PPT Slides are readymade to fit into any presentation structure. We assure you our business people pictures 3d man with questions PowerPoint templates PPT backgrounds for slides will make you look like a winner. PowerPoint presentation experts tell us our ask PowerPoint templates and PPT Slides will make the presenter look like a pro even if they are not computer savvy. Our Business People Pictures 3d Man With Questions PowerPoint Templates Ppt Backgrounds For Slides will be your lucky charm. They will deliver for you on your fateful day.
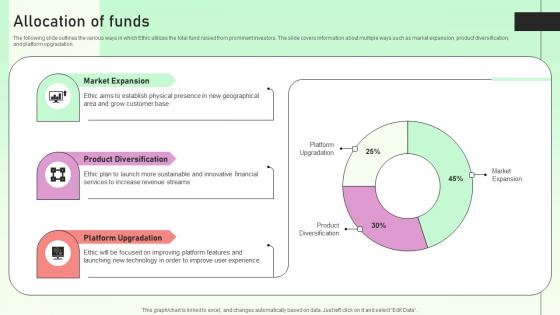
Allocation Of Funds Value Based Investor Financing Pitch Deck Introduction Pdf
The following slide outlines the various ways in which Ethic utilizes the total fund raised from prominent investors. The slide covers information about multiple ways such as market expansion, product diversification,and platform upgradation. Boost your pitch with our creative Allocation Of Funds Value Based Investor Financing Pitch Deck Introduction Pdf. Deliver an awe inspiring pitch that will mesmerize everyone. Using these presentation templates you will surely catch everyones attention. You can browse the ppts collection on our website. We have researchers who are experts at creating the right content for the templates. So you do not have to invest time in any additional work. Just grab the template now and use them. The following slide outlines the various ways in which Ethic utilizes the total fund raised from prominent investors. The slide covers information about multiple ways such as market expansion, product diversification,and platform upgradation.
Effective Product Adaptation Dashboard Tracking Influencer Marketing Campaign Performance Diagrams PDF
If you are looking for a format to display your unique thoughts, then the professionally designed Effective Product Adaptation Dashboard Tracking Influencer Marketing Campaign Performance Diagrams PDF is the one for you. You can use it as a Google Slides template or a PowerPoint template. Incorporate impressive visuals, symbols, images, and other charts. Modify or reorganize the text boxes as you desire. Experiment with shade schemes and font pairings. Alter, share or cooperate with other people on your work. Download Effective Product Adaptation Dashboard Tracking Influencer Marketing Campaign Performance Diagrams PDF and find out how to give a successful presentation. Present a perfect display to your team and make your presentation unforgettable. This slide represents a dashboard monitoring the performance of local influencer marketing campaigns to promote the product in the target market. It tracks KPIs such as, post, Instagram impressions, likes, comments, visitor calculation, campaign insights, and top performers.
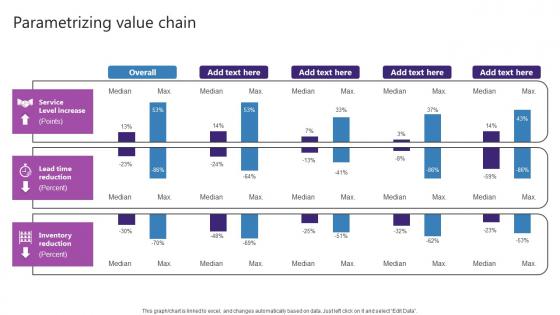
Parametrizing Value Chain Strategic Plan For Enhancing Designs Pdf
Boost your pitch with our creative Parametrizing Value Chain Strategic Plan For Enhancing Designs Pdf Deliver an awe-inspiring pitch that will mesmerize everyone. Using these presentation templates you will surely catch everyones attention. You can browse the ppts collection on our website. We have researchers who are experts at creating the right content for the templates. So you do not have to invest time in any additional work. Just grab the template now and use them. Our Parametrizing Value Chain Strategic Plan For Enhancing Designs Pdf are topically designed to provide an attractive backdrop to any subject. Use them to look like a presentation pro.
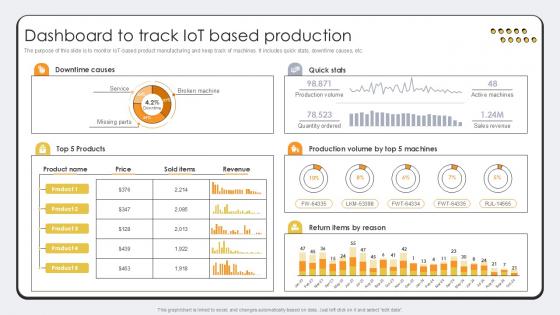
Dashboard To Track IoT Based Revolutionizing Production IoT Ppt PowerPoint
The purpose of this slide is to monitor IoT-based product manufacturing and keep track of machines. It includes quick stats, downtime causes, etc. If you are looking for a format to display your unique thoughts, then the professionally designed Dashboard To Track IoT Based Revolutionizing Production IoT Ppt PowerPoint is the one for you. You can use it as a Google Slides template or a PowerPoint template. Incorporate impressive visuals, symbols, images, and other charts. Modify or reorganize the text boxes as you desire. Experiment with shade schemes and font pairings. Alter, share or cooperate with other people on your work. Download Dashboard To Track IoT Based Revolutionizing Production IoT Ppt PowerPoint and find out how to give a successful presentation. Present a perfect display to your team and make your presentation unforgettable. The purpose of this slide is to monitor IoT-based product manufacturing and keep track of machines. It includes quick stats, downtime causes, etc.
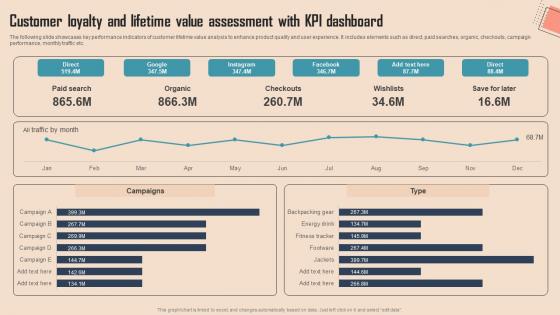
Customer Loyalty And Lifetime Value Comprehensive CDP Guide For Promoters Summary Pdf
The following slide showcases key performance indicators of customer lifetime value analysis to enhance product quality and user experience. It includes elements such as direct, paid searches, organic, checkouts, campaign performance, monthly traffic etc.Present like a pro with Customer Loyalty And Lifetime Value Comprehensive CDP Guide For Promoters Summary Pdf Create beautiful presentations together with your team, using our easy-to-use presentation slides. Share your ideas in real-time and make changes on the fly by downloading our templates. So whether you are in the office, on the go, or in a remote location, you can stay in sync with your team and present your ideas with confidence. With Slidegeeks presentation got a whole lot easier. Grab these presentations today. The following slide showcases key performance indicators of customer lifetime value analysis to enhance product quality and user experience. It includes elements such as direct, paid searches, organic, checkouts, campaign performance, monthly traffic etc.
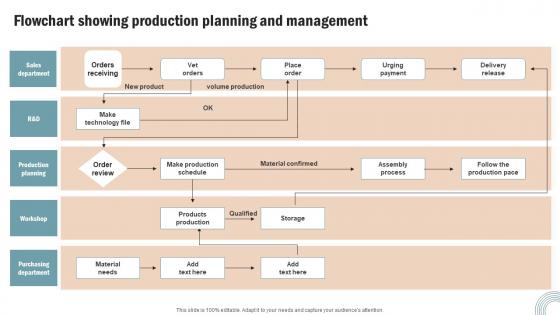
Flowchart Showing Production Operations Strategy Improve Business Productivity Clipart Pdf
If you are looking for a format to display your unique thoughts, then the professionally designed Flowchart Showing Production Operations Strategy Improve Business Productivity Clipart Pdf is the one for you. You can use it as a Google Slides template or a PowerPoint template. Incorporate impressive visuals, symbols, images, and other charts. Modify or reorganize the text boxes as you desire. Experiment with shade schemes and font pairings. Alter, share or cooperate with other people on your work. Download Flowchart Showing Production Operations Strategy Improve Business Productivity Clipart Pdf and find out how to give a successful presentation. Present a perfect display to your team and make your presentation unforgettable. Our Flowchart Showing Production Operations Strategy Improve Business Productivity Clipart Pdf are topically designed to provide an attractive backdrop to any subject. Use them to look like a presentation pro.
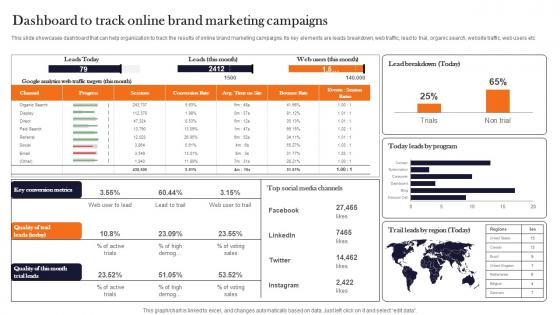
Dashboard To Track Online Brand Marketing Product Advertising And Positioning Graphics Pdf
This slide showcases dashboard that can help organization to track the results of online brand marketing campaigns. Its key elements are leads breakdown, web traffic, lead to trial, organic search, website traffic, web users etc. If you are looking for a format to display your unique thoughts, then the professionally designed Dashboard To Track Online Brand Marketing Product Advertising And Positioning Graphics Pdf is the one for you. You can use it as a Google Slides template or a PowerPoint template. Incorporate impressive visuals, symbols, images, and other charts. Modify or reorganize the text boxes as you desire. Experiment with shade schemes and font pairings. Alter, share or cooperate with other people on your work. Download Dashboard To Track Online Brand Marketing Product Advertising And Positioning Graphics Pdf and find out how to give a successful presentation. Present a perfect display to your team and make your presentation unforgettable. This slide showcases dashboard that can help organization to track the results of online brand marketing campaigns. Its key elements are leads breakdown, web traffic, lead to trial, organic search, website traffic, web users etc.
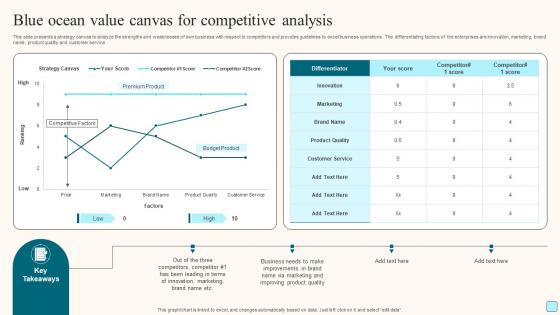
Blue Ocean Value Canvas For Competitive Analysis Mockup Pdf
This slide presents a strategy canvas to analyze the strengths and weaknesses of own business with respect to competitors and provides guidelines to excel business operations. The differentiating factors of the enterprises are innovation, marketing, brand name, product quality and customer service. Pitch your topic with ease and precision using this Blue Ocean Value Canvas For Competitive Analysis Mockup Pdf. This layout presents information on Blue Ocean Value Canvas, Competitive Analysis, Product Quality. It is also available for immediate download and adjustment. So, changes can be made in the color, design, graphics or any other component to create a unique layout. This slide presents a strategy canvas to analyze the strengths and weaknesses of own business with respect to competitors and provides guidelines to excel business operations. The differentiating factors of the enterprises are innovation, marketing, brand name, product quality and customer service.
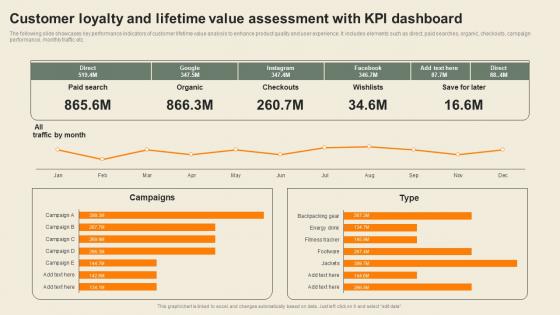
Customer Loyalty And Lifetime Value Usability Of CDP Software Tool Information Pdf
The following slide showcases key performance indicators of customer lifetime value analysis to enhance product quality and user experience. It includes elements such as direct, paid searches, organic, checkouts, campaign performance, monthly traffic etc. Are you in need of a template that can accommodate all of your creative concepts This one is crafted professionally and can be altered to fit any style. Use it with Google Slides or PowerPoint. Include striking photographs, symbols, depictions, and other visuals. Fill, move around, or remove text boxes as desired. Test out color palettes and font mixtures. Edit and save your work, or work with colleagues. Download Customer Loyalty And Lifetime Value Usability Of CDP Software Tool Information Pdf and observe how to make your presentation outstanding. Give an impeccable presentation to your group and make your presentation unforgettable. The following slide showcases key performance indicators of customer lifetime value analysis to enhance product quality and user experience. It includes elements such as direct, paid searches, organic, checkouts, campaign performance, monthly traffic etc.
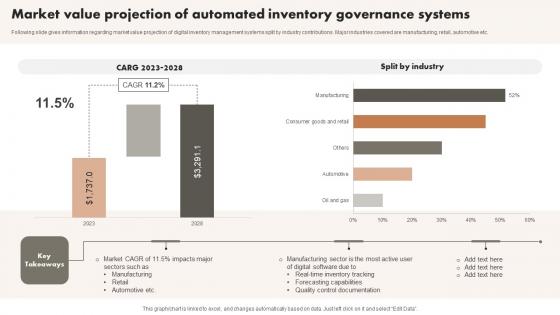
Market Value Projection Of Automated Inventory Governance Systems Graphics Pdf
Following slide gives information regarding market value projection of digital inventory management systems split by industry contributions. Major industries covered are manufacturing, retail, automotive etc. Showcasing this set of slides titled Market Value Projection Of Automated Inventory Governance Systems Graphics Pdf. The topics addressed in these templates are Systems, Industry, Key Takeaways. All the content presented in this PPT design is completely editable. Download it and make adjustments in color, background, font etc. as per your unique business setting. Following slide gives information regarding market value projection of digital inventory management systems split by industry contributions. Major industries covered are manufacturing, retail, automotive etc.
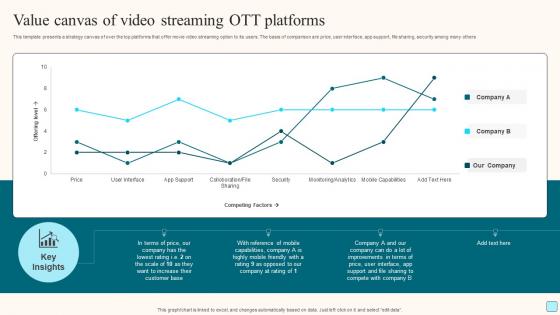
Value Canvas Of Video Streaming Ott Platforms Professional Pdf
This template presents a strategy canvas of over the top platforms that offer movie video streaming option to its users. The basis of comparison are price, user interface, app support, file sharing, security among many others. Pitch your topic with ease and precision using this Value Canvas Of Video Streaming Ott Platforms Professional Pdf. This layout presents information on Value Canvas, Video Streaming, App Support, Security. It is also available for immediate download and adjustment. So, changes can be made in the color, design, graphics or any other component to create a unique layout. This template presents a strategy canvas of over the top platforms that offer movie video streaming option to its users. The basis of comparison are price, user interface, app support, file sharing, security among many others.
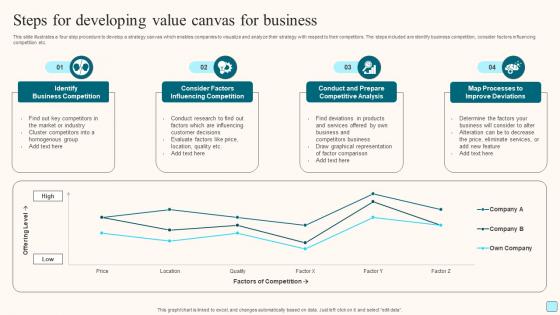
Steps For Developing Value Canvas For Business Portrait Pdf
This slide illustrates a four step procedure to develop a strategy canvas which enables companies to visualize and analyze their strategy with respect to their competitors. The steps included are identify business competition, consider factors influencing competition etc. Showcasing this set of slides titled Steps For Developing Value Canvas For Business Portrait Pdf. The topics addressed in these templates are Identify Business Competition, Prepare Competitive Analysis, Value Canvas For Business. All the content presented in this PPT design is completely editable. Download it and make adjustments in color, background, font etc. as per your unique business setting. This slide illustrates a four step procedure to develop a strategy canvas which enables companies to visualize and analyze their strategy with respect to their competitors. The steps included are identify business competition, consider factors influencing competition etc.
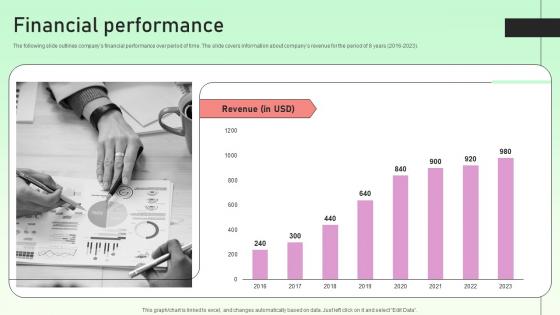
Financial Performance Value Based Investor Financing Pitch Deck Rules Pdf
The following slide outlines companys financial performance over period of time. The slide covers information about companys revenue for the period of 8 years 2016 2023. Slidegeeks is here to make your presentations a breeze with Financial Performance Value Based Investor Financing Pitch Deck Rules Pdf With our easy to use and customizable templates, you can focus on delivering your ideas rather than worrying about formatting. With a variety of designs to choose from, you are sure to find one that suits your needs. And with animations and unique photos, illustrations, and fonts, you can make your presentation pop. So whether you are giving a sales pitch or presenting to the board, make sure to check out Slidegeeks first The following slide outlines companys financial performance over period of time. The slide covers information about companys revenue for the period of 8 years 2016 2023.
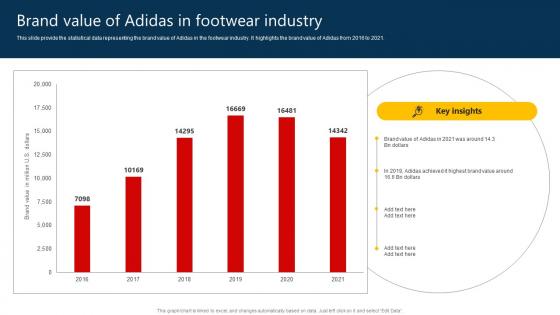
The Marketing Mix Of Brand Value Of Adidas In Footwear Industry Strategy SS V
This slide provide the statistical data representing the brand value of Adidas in the footwear industry. It highlights the brand value of Adidas from 2016 to 2021. Slidegeeks has constructed The Marketing Mix Of Brand Value Of Adidas In Footwear Industry Strategy SS V after conducting extensive research and examination. These presentation templates are constantly being generated and modified based on user preferences and critiques from editors. Here, you will find the most attractive templates for a range of purposes while taking into account ratings and remarks from users regarding the content. This is an excellent jumping-off point to explore our content and will give new users an insight into our top-notch PowerPoint Templates. This slide provide the statistical data representing the brand value of Adidas in the footwear industry. It highlights the brand value of Adidas from 2016 to 2021.
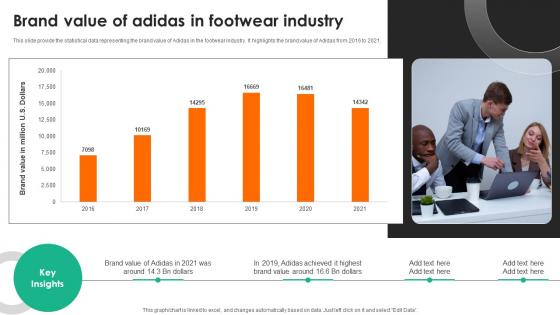
Evaluating Adidas Branding Brand Value Of Adidas In Footwear Industry Strategy SS V
This slide provide the statistical data representing the brand value of Adidas in the footwear industry. It highlights the brand value of Adidas from 2016 to 2021. This modern and well-arranged Evaluating Adidas Branding Brand Value Of Adidas In Footwear Industry Strategy SS V provides lots of creative possibilities. It is very simple to customize and edit with the Powerpoint Software. Just drag and drop your pictures into the shapes. All facets of this template can be edited with Powerpoint, no extra software is necessary. Add your own material, put your images in the places assigned for them, adjust the colors, and then you can show your slides to the world, with an animated slide included. This slide provide the statistical data representing the brand value of Adidas in the footwear industry. It highlights the brand value of Adidas from 2016 to 2021.
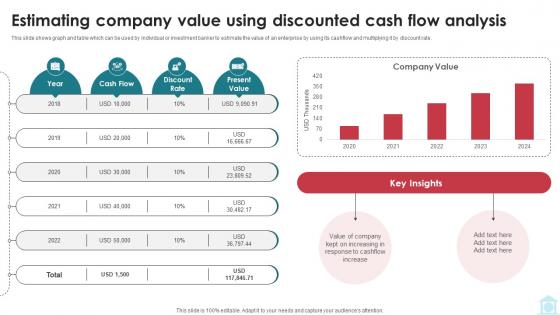
Estimating Company Value Using Discounted Cash Mastering Investment Banking Fin SS V
This slide shows graph and table which can be used by individual or investment banker to estimate the value of an enterprise by using its cashflow and multiplying it by discount rate. Coming up with a presentation necessitates that the majority of the effort goes into the content and the message you intend to convey. The visuals of a PowerPoint presentation can only be effective if it supplements and supports the story that is being told. Keeping this in mind our experts created Estimating Company Value Using Discounted Cash Mastering Investment Banking Fin SS V to reduce the time that goes into designing the presentation. This way, you can concentrate on the message while our designers take care of providing you with the right template for the situation. This slide shows graph and table which can be used by individual or investment banker to estimate the value of an enterprise by using its cashflow and multiplying it by discount rate.

Estimating Company Value Using Investment Banking Simplified Functions Fin SS V
This slide shows graph and table which can be used by individual or investment banker to estimate the value of an enterprise by using its cashflow and multiplying it by discount rate. Coming up with a presentation necessitates that the majority of the effort goes into the content and the message you intend to convey. The visuals of a PowerPoint presentation can only be effective if it supplements and supports the story that is being told. Keeping this in mind our experts created Estimating Company Value Using Investment Banking Simplified Functions Fin SS V to reduce the time that goes into designing the presentation. This way, you can concentrate on the message while our designers take care of providing you with the right template for the situation. This slide shows graph and table which can be used by individual or investment banker to estimate the value of an enterprise by using its cashflow and multiplying it by discount rate.
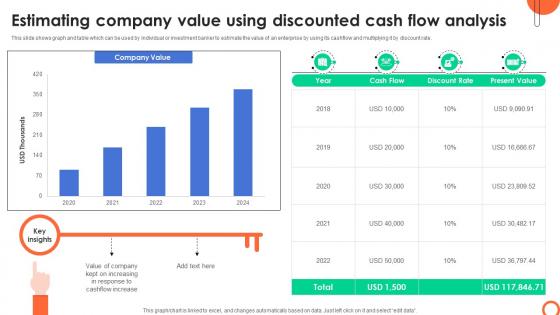
Estimating Company Value Using Discounted Understanding Investment Banking Framework Fin SS V
This slide shows graph and table which can be used by individual or investment banker to estimate the value of an enterprise by using its cashflow and multiplying it by discount rate. Coming up with a presentation necessitates that the majority of the effort goes into the content and the message you intend to convey. The visuals of a PowerPoint presentation can only be effective if it supplements and supports the story that is being told. Keeping this in mind our experts created Estimating Company Value Using Discounted Understanding Investment Banking Framework Fin SS V to reduce the time that goes into designing the presentation. This way, you can concentrate on the message while our designers take care of providing you with the right template for the situation. This slide shows graph and table which can be used by individual or investment banker to estimate the value of an enterprise by using its cashflow and multiplying it by discount rate.
Financial Projections Value Based Investor Financing Pitch Deck Icons Pdf
The following slide outlines projected yearly growth of our company based on past performance. Information covered in this slide is related to annual sales of company for next four years. Do you have an important presentation coming up Are you looking for something that will make your presentation stand out from the rest Look no further than Financial Projections Value Based Investor Financing Pitch Deck Icons Pdf. With our professional designs, you can trust that your presentation will pop and make delivering it a smooth process. And with Slidegeeks, you can trust that your presentation will be unique and memorable. So why wait Grab Financial Projections Value Based Investor Financing Pitch Deck Icons Pdf today and make your presentation stand out from the rest The following slide outlines projected yearly growth of our company based on past performance. Information covered in this slide is related to annual sales of company for next four years.
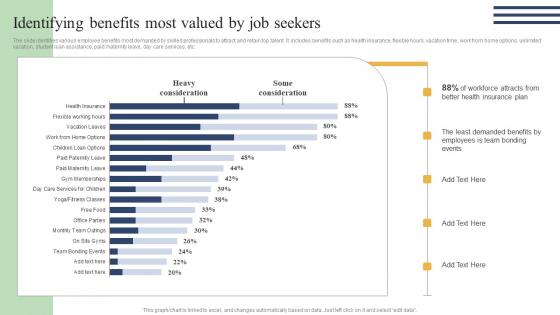
Action Measures To Build Staff Identifying Benefits Most Valued By Job Seekers Designs Pdf
The slide identifies various employee benefits most demanded by skilled professionals to attract and retain top talent. It includes benefits such as health insurance, flexible hours, vacation time, work from home options, unlimited vacation, student loan assistance, paid maternity leave, day care services, etc. Crafting an eye-catching presentation has never been more straightforward. Let your presentation shine with this tasteful yet straightforward Action Measures To Build Staff Identifying Benefits Most Valued By Job Seekers Designs Pdf template. It offers a minimalistic and classy look that is great for making a statement. The colors have been employed intelligently to add a bit of playfulness while still remaining professional. Construct the ideal Action Measures To Build Staff Identifying Benefits Most Valued By Job Seekers Designs Pdf that effortlessly grabs the attention of your audience. Begin now and be certain to wow your customers. The slide identifies various employee benefits most demanded by skilled professionals to attract and retain top talent. It includes benefits such as health insurance, flexible hours, vacation time, work from home options, unlimited vacation, student loan assistance, paid maternity leave, day care services, etc.
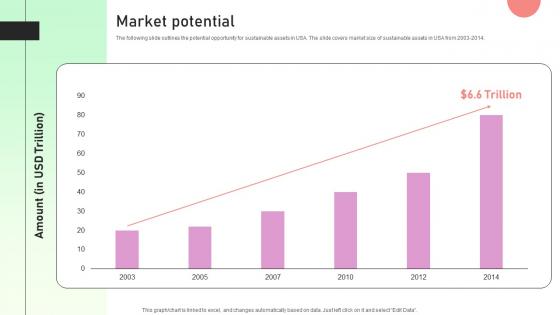
Market Potential Value Based Investor Financing Pitch Deck Infographics Pdf
The following slide outlines the potential opportunity for sustainable assets in USA. The slide covers market size of sustainable assets in USA from 2003 2014. Make sure to capture your audiences attention in your business displays with our gratis customizable Market Potential Value Based Investor Financing Pitch Deck Infographics Pdf. These are great for business strategies, office conferences, capital raising or task suggestions. If you desire to acquire more customers for your tech business and ensure they stay satisfied, create your own sales presentation with these plain slides. The following slide outlines the potential opportunity for sustainable assets in USA. The slide covers market size of sustainable assets in USA from 2003 2014.
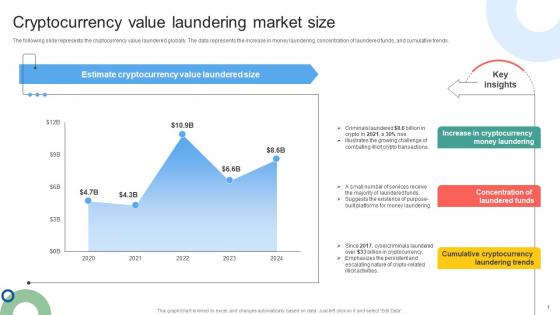
Cryptocurrency Value Laundering Market Size Mapping Out The Anti Money Fin SS V
The following slide represents the cryptocurrency value laundered globally. The data represents the increase in money laundering, concentration of laundered funds, and cumulative trends. Make sure to capture your audiences attention in your business displays with our gratis customizable Cryptocurrency Value Laundering Market Size Mapping Out The Anti Money Fin SS V. These are great for business strategies, office conferences, capital raising or task suggestions. If you desire to acquire more customers for your tech business and ensure they stay satisfied, create your own sales presentation with these plain slides. The following slide represents the cryptocurrency value laundered globally. The data represents the increase in money laundering, concentration of laundered funds, and cumulative trends.
Decline In Product Sales Brand Building Techniques To Gain Competitive Edge Icons Pdf
The following slide outlines the graphical representation of companys sales and profit. It cover details about the quarterly sales and profit for the current year along with key intakes. If you are looking for a format to display your unique thoughts, then the professionally designed Decline In Product Sales Brand Building Techniques To Gain Competitive Edge Icons Pdf is the one for you. You can use it as a Google Slides template or a PowerPoint template. Incorporate impressive visuals, symbols, images, and other charts. Modify or reorganize the text boxes as you desire. Experiment with shade schemes and font pairings. Alter, share or cooperate with other people on your work. Download Decline In Product Sales Brand Building Techniques To Gain Competitive Edge Icons Pdf and find out how to give a successful presentation. Present a perfect display to your team and make your presentation unforgettable. The following slide outlines the graphical representation of companys sales and profit. It cover details about the quarterly sales and profit for the current year along with key intakes.
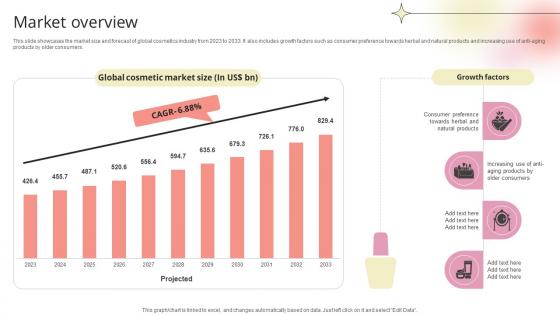
Market Overview Beauty Product Company Go To Market Strategy GTM SS V
This slide showcases the market size and forecast of global cosmetics industry from 2023 to 2033. It also includes growth factors such as consumer preference towards herbal and natural products and increasing use of anti-aging products by older consumers.If you are looking for a format to display your unique thoughts, then the professionally designed Market Overview Beauty Product Company Go To Market Strategy GTM SS V is the one for you. You can use it as a Google Slides template or a PowerPoint template. Incorporate impressive visuals, symbols, images, and other charts. Modify or reorganize the text boxes as you desire. Experiment with shade schemes and font pairings. Alter, share or cooperate with other people on your work. Download Market Overview Beauty Product Company Go To Market Strategy GTM SS V and find out how to give a successful presentation. Present a perfect display to your team and make your presentation unforgettable. This slide showcases the market size and forecast of global cosmetics industry from 2023 to 2033. It also includes growth factors such as consumer preference towards herbal and natural products and increasing use of anti-aging products by older consumers.
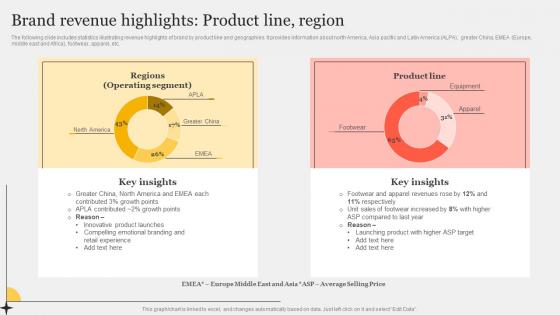
Brand Revenue Highlights Product Line Region Improving Customer Interaction Through Rules Pdf
The following slide includes statistics illustrating revenue highlights of brand by product line and geographies. It provides information about north America, Asia pacific and Latin America ALPA, greater China, EMEA Europe, middle east and Africa, footwear, apparel, etc.If you are looking for a format to display your unique thoughts, then the professionally designed Brand Revenue Highlights Product Line Region Improving Customer Interaction Through Rules Pdf is the one for you. You can use it as a Google Slides template or a PowerPoint template. Incorporate impressive visuals, symbols, images, and other charts. Modify or reorganize the text boxes as you desire. Experiment with shade schemes and font pairings. Alter, share or cooperate with other people on your work. Download Brand Revenue Highlights Product Line Region Improving Customer Interaction Through Rules Pdf and find out how to give a successful presentation. Present a perfect display to your team and make your presentation unforgettable. The following slide includes statistics illustrating revenue highlights of brand by product line and geographies. It provides information about north America, Asia pacific and Latin America ALPA, greater China, EMEA Europe, middle east and Africa, footwear, apparel, etc.
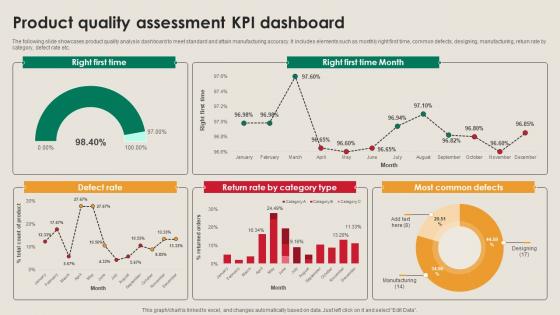
Product Quality Assessment KPI Dashboard Manufacturing Strategy Driving Industry 4 0
The following slide showcases product quality analysis dashboard to meet standard and attain manufacturing accuracy. It includes elements such as monthly right first time, common defects, designing, manufacturing, return rate by category, defect rate etc. If you are looking for a format to display your unique thoughts, then the professionally designed Product Quality Assessment KPI Dashboard Manufacturing Strategy Driving Industry 4 0 is the one for you. You can use it as a Google Slides template or a PowerPoint template. Incorporate impressive visuals, symbols, images, and other charts. Modify or reorganize the text boxes as you desire. Experiment with shade schemes and font pairings. Alter, share or cooperate with other people on your work. Download Product Quality Assessment KPI Dashboard Manufacturing Strategy Driving Industry 4 0 and find out how to give a successful presentation. Present a perfect display to your team and make your presentation unforgettable. The following slide showcases product quality analysis dashboard to meet standard and attain manufacturing accuracy. It includes elements such as monthly right first time, common defects, designing, manufacturing, return rate by category, defect rate etc.
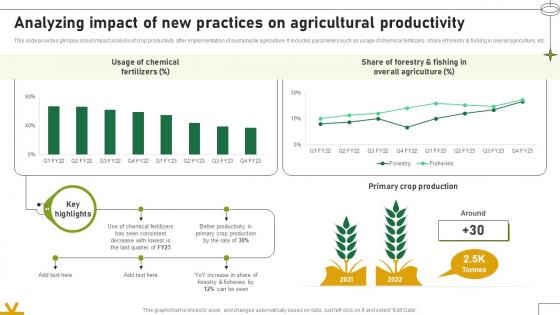
Analyzing Impact Of New Practices On Agricultural Productivity Adopting Sustainable Farming Techniques
This slide provides glimpse about impact analysis of crop productivity after implementation of sustainable agriculture. It includes parameters such as usage of chemical fertilizers, share of forestry and fishing in overall agriculture, etc. If you are looking for a format to display your unique thoughts, then the professionally designed Analyzing Impact Of New Practices On Agricultural Productivity Adopting Sustainable Farming Techniques is the one for you. You can use it as a Google Slides template or a PowerPoint template. Incorporate impressive visuals, symbols, images, and other charts. Modify or reorganize the text boxes as you desire. Experiment with shade schemes and font pairings. Alter, share or cooperate with other people on your work. Download Analyzing Impact Of New Practices On Agricultural Productivity Adopting Sustainable Farming Techniques and find out how to give a successful presentation. Present a perfect display to your team and make your presentation unforgettable. This slide provides glimpse about impact analysis of crop productivity after implementation of sustainable agriculture. It includes parameters such as usage of chemical fertilizers, share of forestry and fishing in overall agriculture, etc.
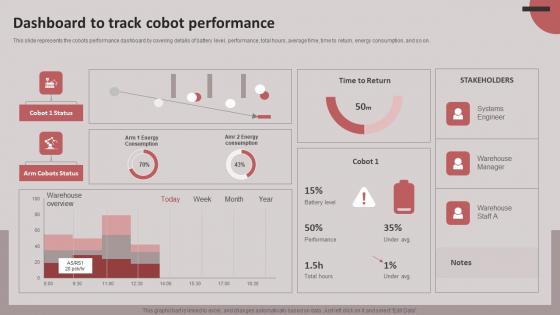
Dashboard To Track Cobot Performance Cobots For Improved Productivity Formats PDF
This slide represents the cobots performance dashboard by covering details of battery level, performance, total hours, average time, time to return, energy consumption, and so on. If you are looking for a format to display your unique thoughts, then the professionally designed Dashboard To Track Cobot Performance Cobots For Improved Productivity Formats PDF is the one for you. You can use it as a Google Slides template or a PowerPoint template. Incorporate impressive visuals, symbols, images, and other charts. Modify or reorganize the text boxes as you desire. Experiment with shade schemes and font pairings. Alter, share or cooperate with other people on your work. Download Dashboard To Track Cobot Performance Cobots For Improved Productivity Formats PDF and find out how to give a successful presentation. Present a perfect display to your team and make your presentation unforgettable. This slide represents the cobots performance dashboard by covering details of battery level, performance, total hours, average time, time to return, energy consumption, and so on.
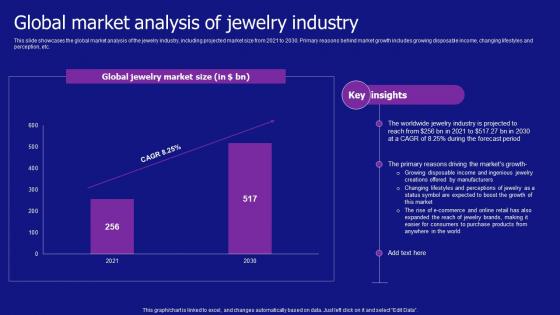
Global Market Analysis Of Jewelry Industry Jewelry Products Business Background Pdf
This slide showcases the global market analysis of the jewelry industry, including projected market size from 2021 to 2030. Primary reasons behind market growth includes growing disposable income, changing lifestyles and perception, etc. If you are looking for a format to display your unique thoughts, then the professionally designed Global Market Analysis Of Jewelry Industry Jewelry Products Business Background Pdf is the one for you. You can use it as a Google Slides template or a PowerPoint template. Incorporate impressive visuals, symbols, images, and other charts. Modify or reorganize the text boxes as you desire. Experiment with shade schemes and font pairings. Alter, share or cooperate with other people on your work. Download Global Market Analysis Of Jewelry Industry Jewelry Products Business Background Pdf and find out how to give a successful presentation. Present a perfect display to your team and make your presentation unforgettable. This slide showcases the global market analysis of the jewelry industry, including projected market size from 2021 to 2030. Primary reasons behind market growth includes growing disposable income, changing lifestyles and perception, etc.
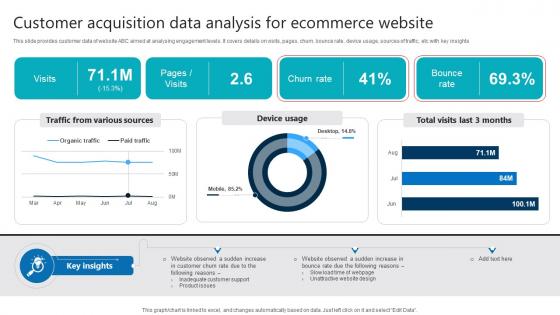
Customer Acquisition Data Analysis For Ecommerce Website Product Analytics Implementation Data Analytics V
This slide provides customer data of website ABC aimed at analysing engagement levels. It covers details on visits, pages, churn, bounce rate, device usage, sources of traffic, etc with key insights If you are looking for a format to display your unique thoughts, then the professionally designed Customer Acquisition Data Analysis For Ecommerce Website Product Analytics Implementation Data Analytics V is the one for you. You can use it as a Google Slides template or a PowerPoint template. Incorporate impressive visuals, symbols, images, and other charts. Modify or reorganize the text boxes as you desire. Experiment with shade schemes and font pairings. Alter, share or cooperate with other people on your work. Download Customer Acquisition Data Analysis For Ecommerce Website Product Analytics Implementation Data Analytics V and find out how to give a successful presentation. Present a perfect display to your team and make your presentation unforgettable. This slide provides customer data of website ABC aimed at analysing engagement levels. It covers details on visits, pages, churn, bounce rate, device usage, sources of traffic, etc with key insights
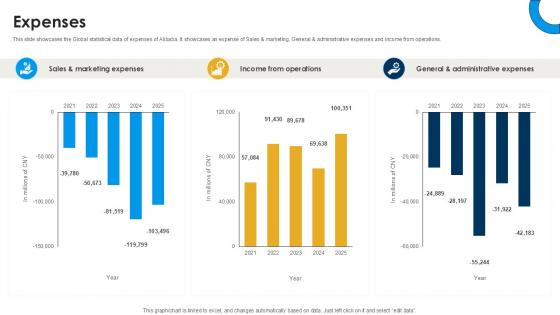
Expenses International Trade Of Products And Services PPT Slide CP SS V
This slide showcases the Global statistical data of expenses of Alibaba. It showcases an expense of Sales and marketing, General and administrative expenses and Income from operations. If you are looking for a format to display your unique thoughts, then the professionally designed Expenses International Trade Of Products And Services PPT Slide CP SS V is the one for you. You can use it as a Google Slides template or a PowerPoint template. Incorporate impressive visuals, symbols, images, and other charts. Modify or reorganize the text boxes as you desire. Experiment with shade schemes and font pairings. Alter, share or cooperate with other people on your work. Download Expenses International Trade Of Products And Services PPT Slide CP SS V and find out how to give a successful presentation. Present a perfect display to your team and make your presentation unforgettable. This slide showcases the Global statistical data of expenses of Alibaba. It showcases an expense of Sales and marketing, General and administrative expenses and Income from operations.
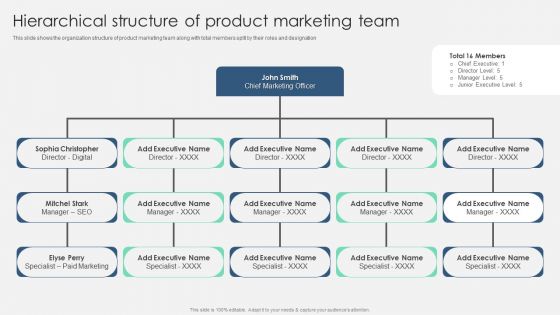
Product Marketing Management To Enforce Business Performance Hierarchical Structure Of Product Mockup PDF
This slide shows the organization structure of product marketing team along with total members split by their roles and designation. Make sure to capture your audiences attention in your business displays with our gratis customizable Product Marketing Management To Enforce Business Performance Hierarchical Structure Of Product Mockup PDF. These are great for business strategies, office conferences, capital raising or task suggestions. If you desire to acquire more customers for your tech business and ensure they stay satisfied, create your own sales presentation with these plain slides.
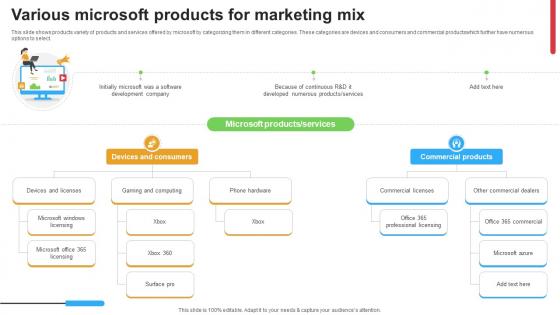
Micosoft Intensive Growth Various Microsoft Products For Marketing Mix Strategy SS V
This slide shows products variety of products and services offered by microsoft by categorizing them in different categories. These categories are devices and consumers and commercial productswhich further have numerous options to select. If you are looking for a format to display your unique thoughts, then the professionally designed Micosoft Intensive Growth Various Microsoft Products For Marketing Mix Strategy SS V is the one for you. You can use it as a Google Slides template or a PowerPoint template. Incorporate impressive visuals, symbols, images, and other charts. Modify or reorganize the text boxes as you desire. Experiment with shade schemes and font pairings. Alter, share or cooperate with other people on your work. Download Micosoft Intensive Growth Various Microsoft Products For Marketing Mix Strategy SS V and find out how to give a successful presentation. Present a perfect display to your team and make your presentation unforgettable. This slide shows products variety of products and services offered by microsoft by categorizing them in different categories. These categories are devices and consumers and commercial productswhich further have numerous options to select.
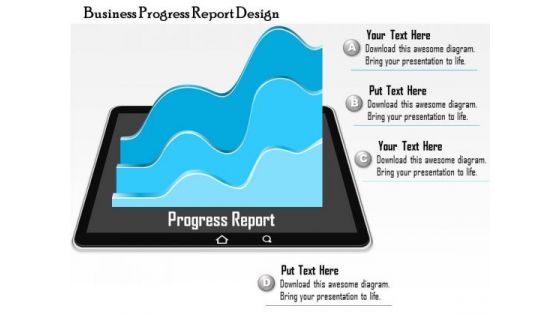
Business Diagram Business Progress Report Design Presentation Template
Come forth with the plans you have so carefully laid out. Use this business consulting diagram to inject values into your group and see them bond to achieve success. Excite your audience with the brilliance of your thoughts
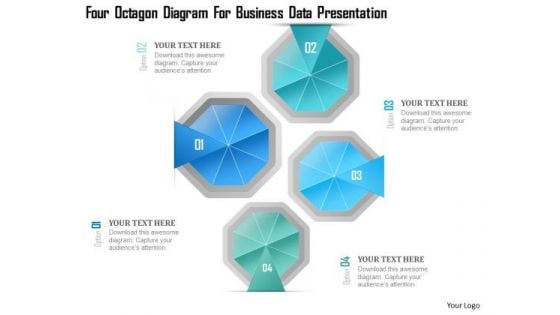
Busines Diagram Four Octagon Diagram For Business Data Presentation Template
This business diagram has been designed with graphic of four octagon and text boxes. This slide contains the concept of business data flow. Deliver amazing presentations to mesmerize your audience.
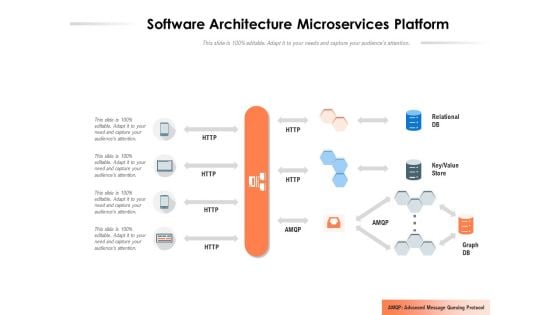
Software Architecture Microservices Platform Ppt PowerPoint Presentation Infographic Template Show
Presenting this set of slides with name software architecture microservices platform ppt powerpoint presentation infographic template show. The topics discussed in these slides are relational db, key, value store, graph db. This is a completely editable PowerPoint presentation and is available for immediate download. Download now and impress your audience.
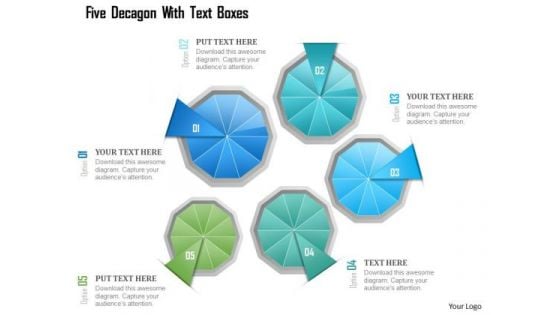
Busines Diagram Five Decagon With Text Boxes Presentation Template
This business diagram has been designed with graphic of five decagon and text boxes. This slide contains the concept of business data flow. Deliver amazing presentations to mesmerize your audience.

Grid Diagram Ppt PowerPoint Presentation Complete Deck With Slides
Improve your presentation delivery using this Grid Diagram Ppt PowerPoint Presentation Complete Deck With Slides. Support your business vision and objectives using this well-structured PPT deck. This template offers a great starting point for delivering beautifully designed presentations on the topic of your choice. Comprising seventeen this professionally designed template is all you need to host discussion and meetings with collaborators. Each slide is self-explanatory and equipped with high-quality graphics that can be adjusted to your needs. Therefore, you will face no difficulty in portraying your desired content using this PPT slideshow. This PowerPoint slideshow contains every important element that you need for a great pitch. It is not only editable but also available for immediate download and utilization. The color, font size, background, shapes everything can be modified to create your unique presentation layout. Therefore, download it now.
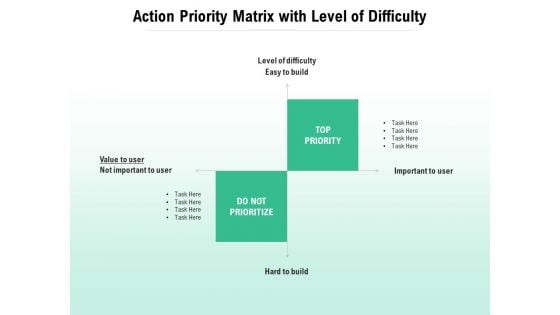
Action Priority Matrix With Level Of Difficulty Ppt PowerPoint Presentation Infographics File Formats
Presenting this set of slides with name action priority matrix with level of difficulty ppt powerpoint presentation infographics file formats. The topics discussed in these slides are priority, prioritize, value. This is a completely editable PowerPoint presentation and is available for immediate download. Download now and impress your audience.


 Continue with Email

 Home
Home


