Goal Icon
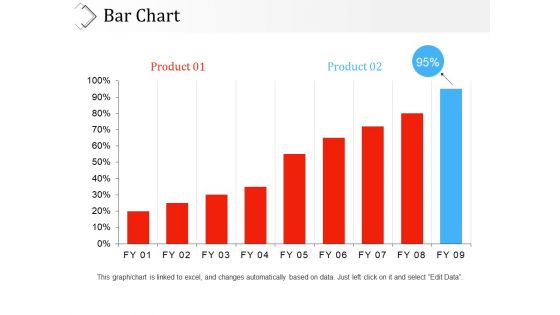
Bar Chart Ppt PowerPoint Presentation Show Example File
This is a bar chart ppt powerpoint presentation show example file. This is a two stage process. The stages in this process are product, business, marketing, graph, percentage.
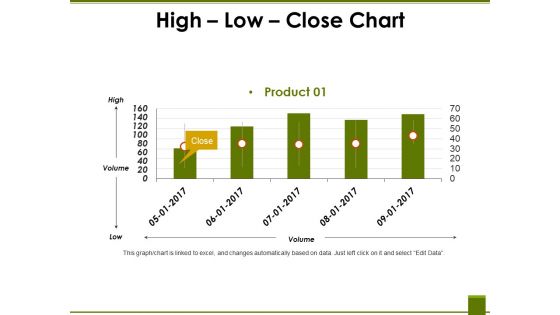
High Low Close Chart Ppt PowerPoint Presentation Portfolio Gridlines
This is a high low close chart ppt powerpoint presentation portfolio gridlines. This is a one stage process. The stages in this process are high, product, volume, low.
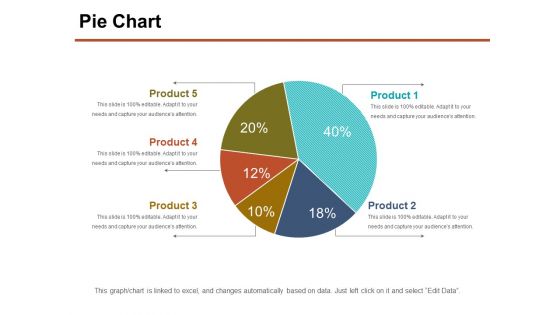
Pie Chart Ppt PowerPoint Presentation Outline Infographic Template
This is a pie chart ppt powerpoint presentation outline infographic template. This is a five stage process. The stages in this process are product, percentage, business, process.
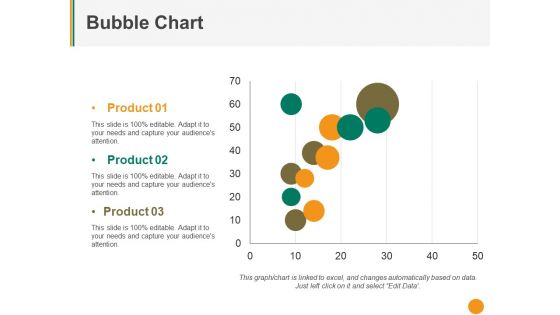
Bubble Chart Ppt PowerPoint Presentation Pictures Slide Download
This is a bubble chart ppt powerpoint presentation pictures slide download. This is a three stage process. The stages in this process are product, business, graph, finance.
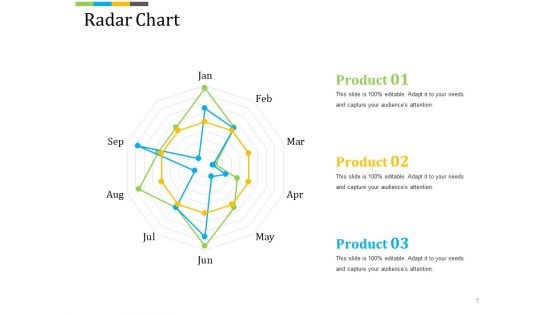
Radar Chart Ppt PowerPoint Presentation Summary Master Slide
This is a radar chart ppt powerpoint presentation summary master slide. This is a three stage process. The stages in this process are product, business, marketing, finance.
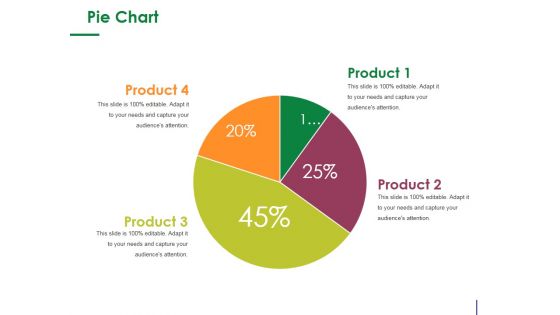
Pie Chart Ppt PowerPoint Presentation Professional Graphic Images
This is a pie chart ppt powerpoint presentation professional graphic images. This is a four stage process. The stages in this process are product, percentage, pie, finance, business.
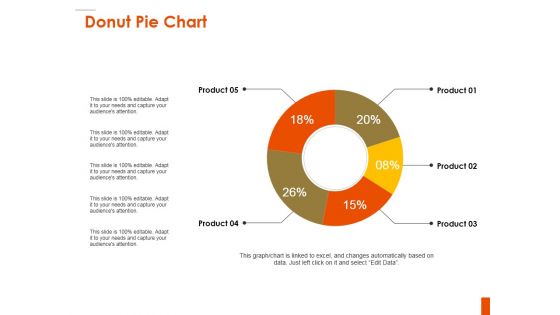
Donut Pie Chart Ppt PowerPoint Presentation Professional Influencers
This is a donut pie chart ppt powerpoint presentation professional influencers. This is a five stage process. The stages in this process are product, percentage, finance, donut, business.
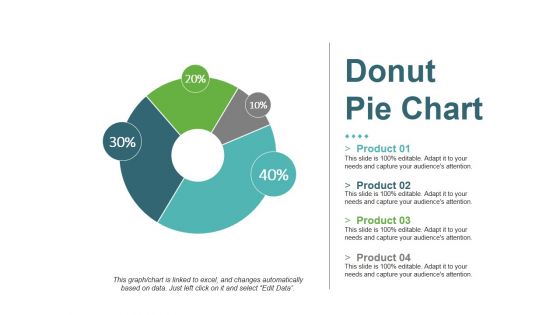
Donut Pie Chart Ppt PowerPoint Presentation Portfolio Sample
This is a donut pie chart ppt powerpoint presentation portfolio sample. This is a four stage process. The stages in this process are product, donut, percentage, finance, process.
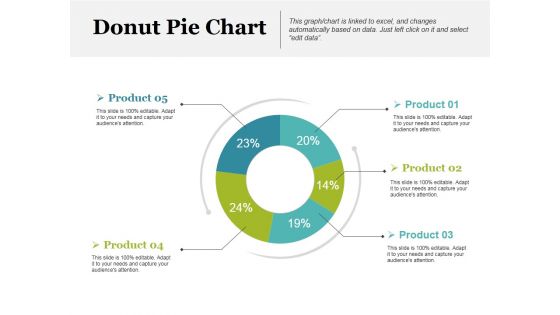
Donut Pie Chart Ppt PowerPoint Presentation Layouts Visuals
This is a donut pie chart ppt powerpoint presentation layouts visuals. This is a five stage process. The stages in this process are product, donut, percentage, finance, business.
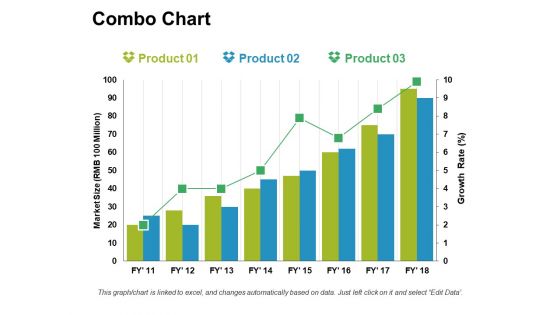
Combo Chart Ppt PowerPoint Presentation Summary Graphics Example
This is a combo chart ppt powerpoint presentation summary graphics example. This is a three stage process. The stages in this process are product, growth, marketing.
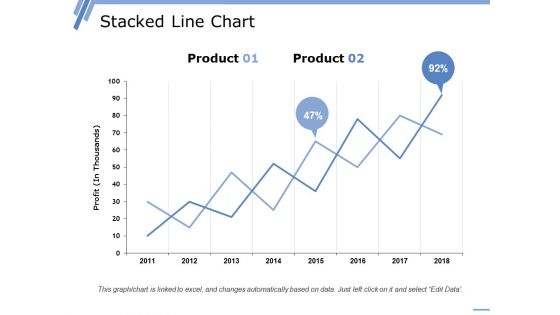
Stacked Line Chart Ppt PowerPoint Presentation Styles Graphics
This is a stacked line chart ppt powerpoint presentation styles graphics. This is a two stage process. The stages in this process are product, year, profit, percentage, growth.
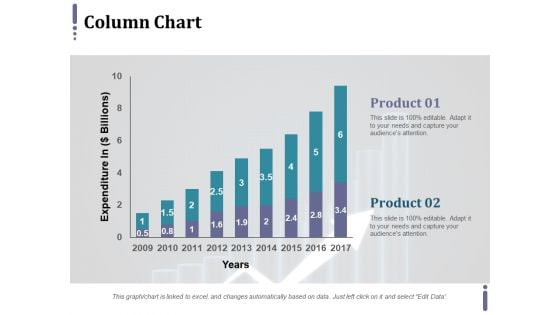
Column Chart Ppt PowerPoint Presentation Model Graphics Example
This is a column chart ppt powerpoint presentation model graphics example. This is a two stage process. The stages in this process are expenditure in, product, years.
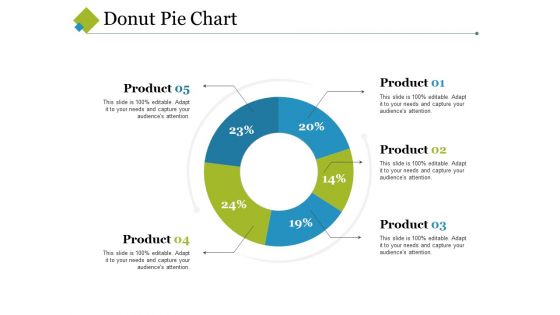
Donut Pie Chart Ppt PowerPoint Presentation Show Introduction
This is a donut pie chart ppt powerpoint presentation show introduction. This is a five stage process. The stages in this process are percentage, finance, donut, business, product.
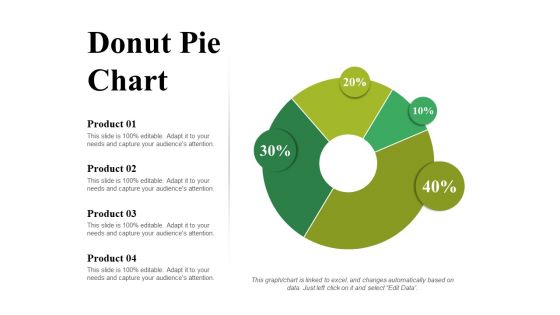
Donut Pie Chart Ppt PowerPoint Presentation Styles Example
This is a donut pie chart ppt powerpoint presentation styles example. This is a four stage process. The stages in this process are percentage, finance, donut, business, product.
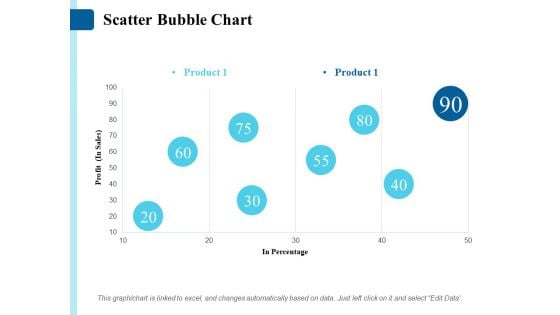
Scatter Bubble Chart Ppt PowerPoint Presentation Summary Slides
This is a scatter bubble chart ppt powerpoint presentation summary slides. This is a one stage process. The stages in this process are product, profit, in percentage.
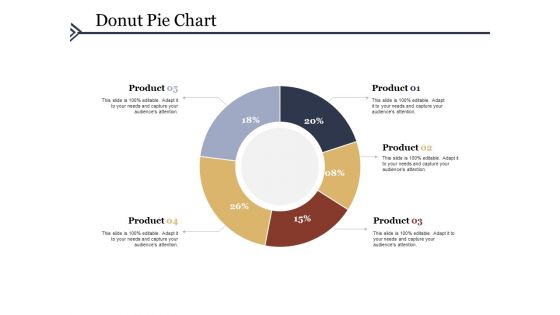
Donut Pie Chart Ppt PowerPoint Presentation Outline Smartart
This is a donut pie chart ppt powerpoint presentation outline smartart. This is a five stage process. The stages in this process are percentage, finance, donut, business, product.
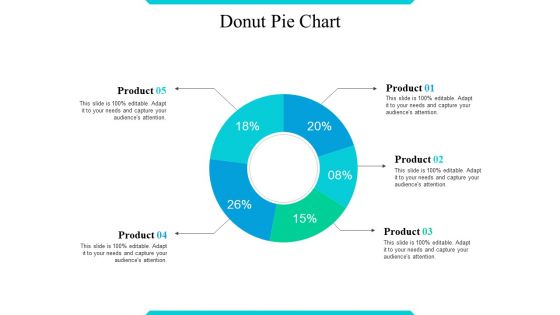
Donut Pie Chart Ppt PowerPoint Presentation Outline Display
This is a donut pie chart ppt powerpoint presentation outline display. This is a five stage process. The stages in this process are percentage, finance, donut, business, product.
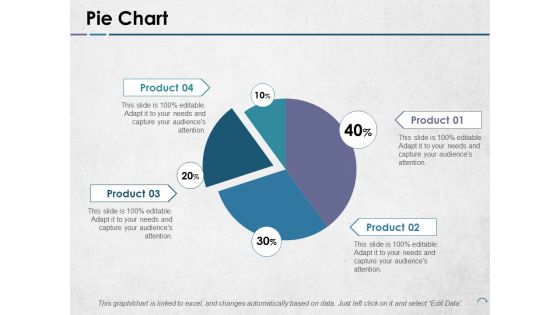
Pie Chart Ppt PowerPoint Presentation Infographics Example Topics
This is a pie chart ppt powerpoint presentation infographics example topics. This is a four stage process. The stages in this process are product, pie, process, percentage, finance.
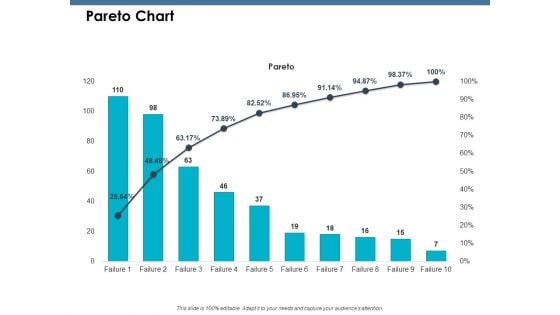
Pareto Chart Ppt PowerPoint Presentation Styles File Formats
This is a pareto chart ppt powerpoint presentation styles file formats. This is a ten stage process. The stages in this process are Product, Percentage, Business, Marketing.
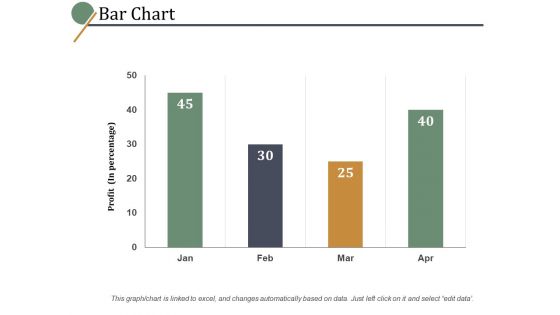
Bar Chart Slide Ppt PowerPoint Presentation Summary Example File
This is a bar chart slide ppt powerpoint presentation summary example file. This is a three stage process. The stages in this process are percentage, marketing, management, product.
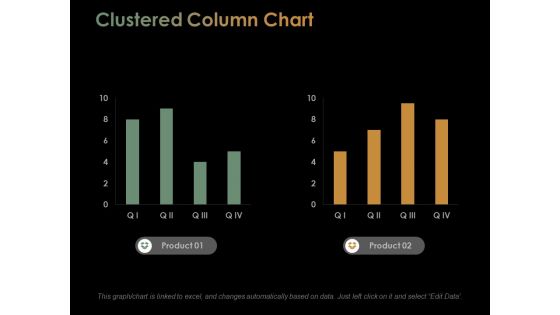
Clustered Column Chart Ppt PowerPoint Presentation Slides Information
This is a clustered column chart ppt powerpoint presentation slides information. This is a two stage process. The stages in this process are percentage, product, business, marketing.
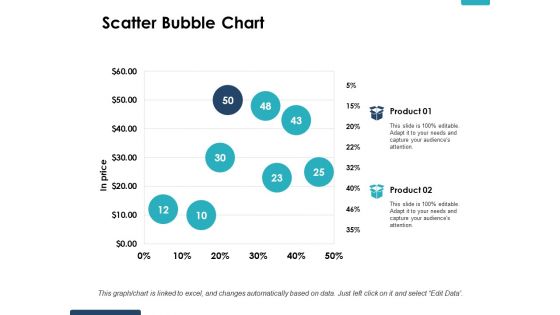
Scatter Bubble Chart Ppt PowerPoint Presentation Layouts Gridlines
This is a scatter bubble chart ppt powerpoint presentation layouts gridlines. This is a two stage process. The stages in this process are percentage, product, business, marketing.
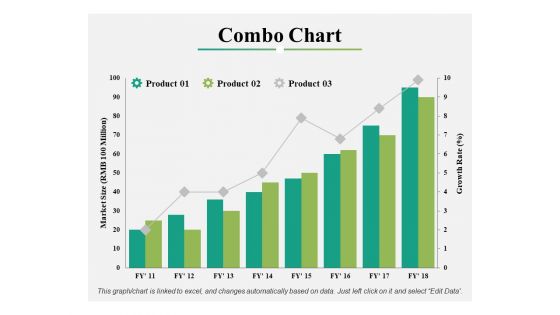
Combo Chart Ppt PowerPoint Presentation Styles Format Ideas
This is a combo chart ppt powerpoint presentation styles format ideas. This is a three stage process. The stages in this process are percentage, product, marketing.
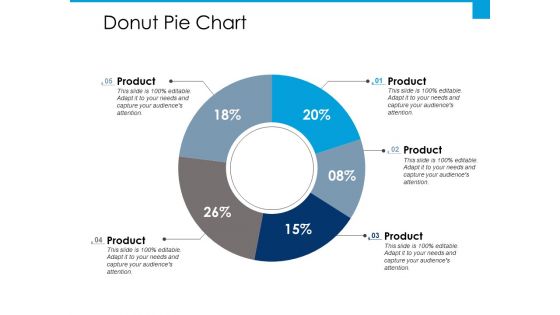
Donut Pie Chart Ppt PowerPoint Presentation Gallery Design Ideas
This is a donut pie chart ppt powerpoint presentation gallery design ideas. This is a five stage process. The stages in this process are business, marketing, percentage, product.
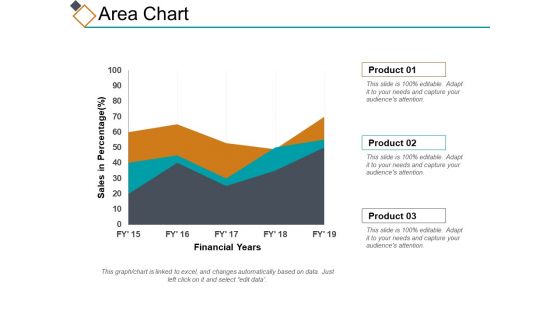
Area Chart Ppt PowerPoint Presentation File Design Inspiration
This is a area chart ppt powerpoint presentation file design inspiration. This is a three stage process. The stages in this process are percentage, product, business, management, marketing.
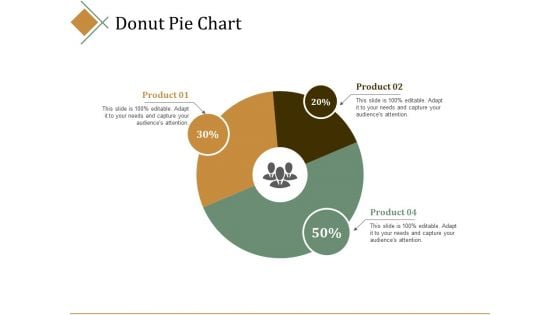
Donut Pie Chart Ppt PowerPoint Presentation Inspiration Elements
This is a donut pie chart ppt powerpoint presentation inspiration elements. This is a three stage process. The stages in this process are percentage, product, business, management, marketing.
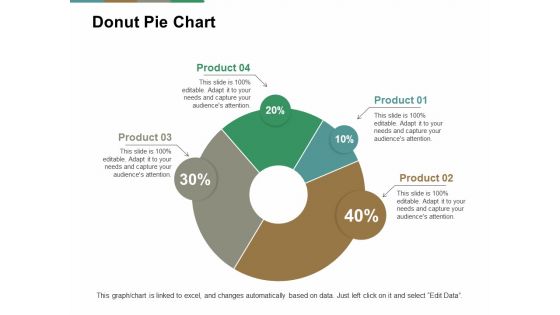
Donut Pie Chart Ppt PowerPoint Presentation Pictures Summary
This is a donut pie chart ppt powerpoint presentation pictures summary. This is a four stage process. The stages in this process are percentage, product, business, management, marketing.
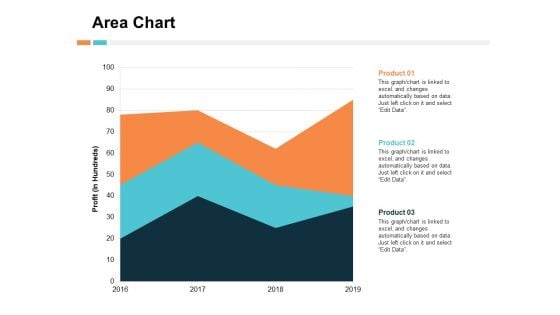
Area Chart Financial Ppt PowerPoint Presentation Outline Information
This is a area chart financial ppt powerpoint presentation outline information. This is a three stage process. The stages in this process are percentage, product, business, management, marketing.
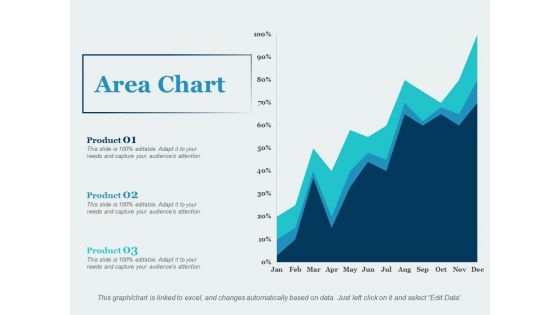
Area Chart Percentage Ppt PowerPoint Presentation Gallery Outline
This is a area chart percentage ppt powerpoint presentation gallery outline. This is a three stage process. The stages in this process are business, management, marketing, percentage, product.

Scatter Bubble Chart Ppt PowerPoint Presentation Outline Demonstration
This is a scatter bubble chart ppt powerpoint presentation outline demonstration. This is a three stage process. The stages in this process are percentage, product, management, marketing, business.
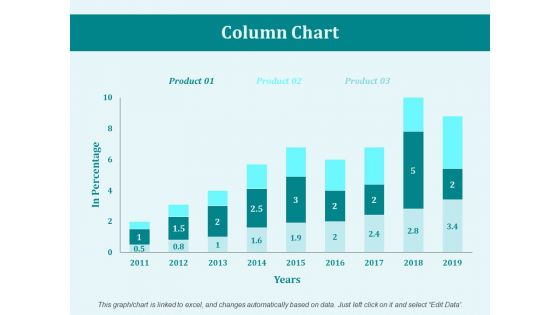
Column Chart Marketing Ppt PowerPoint Presentation Summary Images
This is a column chart marketing ppt powerpoint presentation summary images. This is a three stage process. The stages in this process are business, management, marketing, product, percentage.
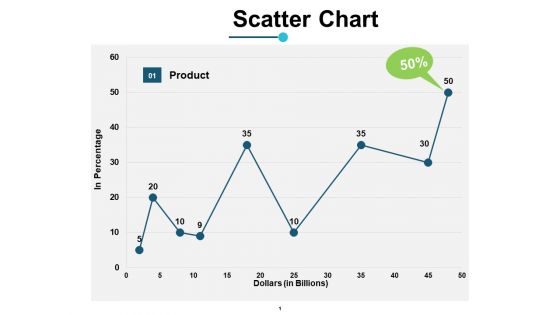
Scatter Chart Financial Ppt PowerPoint Presentation Model Deck
This is a scatter chart financial ppt powerpoint presentation model deck. This is a one stage process. The stages in this process are business, management, marketing, percentage, product.
Marketing Process Diagram With Arrows 2 Stages Ppt Insurance Business Plan PowerPoint Templates
We present our marketing process diagram with arrows 2 stages ppt insurance business plan PowerPoint templates.Download and present our Symbol PowerPoint Templates because you know the path so show the way. Use our Business PowerPoint Templates because your product has established a foothold in the market. Customers are happy with the value it brings to their lives. Download and present our Arrows PowerPoint Templates because retrace your steps with your team and have a relook at the basic aspects of your work. Download our Process and Flows PowerPoint Templates because this helps you to put all your brilliant views to your audience. Download and present our Flow charts PowerPoint Templates because it shows how one can contribute to the overall feeling of well-being.Use these PowerPoint slides for presentations relating to Abstract, Arrow, Arrows, Business, Chart, Design, Development, Diagram, Direction, Element, Flow, Flowchart, Graph, Linear, Management, Model, Motion, Organization, Plan, Process, Program, Section, Segment, Set, Sign, Solution, Strategy, Symbol, Technology. The prominent colors used in the PowerPoint template are Green, Gray, Black. Presenters tell us our marketing process diagram with arrows 2 stages ppt insurance business plan PowerPoint templates are Elegant. Use our Diagram PowerPoint templates and PPT Slides will make the presenter look like a pro even if they are not computer savvy. You can be sure our marketing process diagram with arrows 2 stages ppt insurance business plan PowerPoint templates are Liberated. Professionals tell us our Arrows PowerPoint templates and PPT Slides are Enchanting. Presenters tell us our marketing process diagram with arrows 2 stages ppt insurance business plan PowerPoint templates are Fun. PowerPoint presentation experts tell us our Diagram PowerPoint templates and PPT Slides will help them to explain complicated concepts. Our Marketing Process Diagram With Arrows 2 Stages Ppt Insurance Business Plan PowerPoint Templates are truly fair minded. They take all arguments into account.
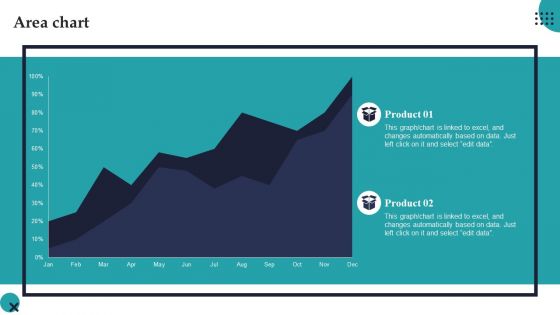
Area Chart Employee Performance Management System To Enhance Workforce Productivity Ideas PDF
This Area Chart Employee Performance Management System To Enhance Workforce Productivity Ideas PDF from Slidegeeks makes it easy to present information on your topic with precision. It provides customization options, so you can make changes to the colors, design, graphics, or any other component to create a unique layout. It is also available for immediate download, so you can begin using it right away. Slidegeeks has done good research to ensure that you have everything you need to make your presentation stand out. Make a name out there for a brilliant performance.
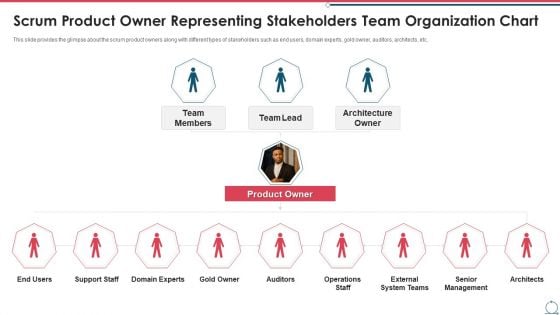
Building An Agile Development Scrum Team Scrum Product Owner Representing Stakeholders Team Organization Chart Professional PDF
This slide provides the glimpse about the scrum product owners along with different types of stakeholders such as end users, domain experts, gold owner, auditors, architects, etc. This is a building an agile development scrum team scrum product owner representing stakeholders team organization chart professional pdf template with various stages. Focus and dispense information on three stages using this creative set, that comes with editable features. It contains large content boxes to add your information on topics like Auditors, Domain Experts, Operations Staff, External System Teams, Senior Management. You can also showcase facts, figures, and other relevant content using this PPT layout. Grab it now.
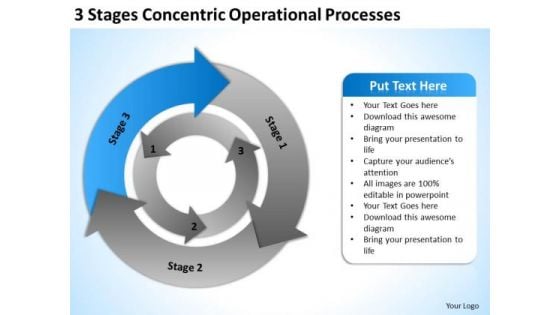
3 Stages Concentric Operational Processes Ppt Business Plan Downloads PowerPoint Templates
We present our 3 stages concentric operational processes ppt business plan downloads PowerPoint templates.Download our Finance PowerPoint Templates because You can Be the star of the show with our PowerPoint Templates and Slides. Rock the stage with your ideas. Download and present our Communication PowerPoint Templates because Our PowerPoint Templates and Slides will fulfill your every need. Use them and effectively satisfy the desires of your audience. Download our Arrows PowerPoint Templates because you should once Tap the ingenuity of our PowerPoint Templates and Slides. They are programmed to succeed. Use our Business PowerPoint Templates because Our PowerPoint Templates and Slides are a sure bet. Gauranteed to win against all odds. Use our Circle Charts PowerPoint Templates because Our PowerPoint Templates and Slides will provide you the cutting edge. Slice through the doubts in the minds of your listeners.Use these PowerPoint slides for presentations relating to Advertise, around, arrow, brand, business, chart, circle, collective, communication, concentric, concept, diagram, direction, financial, flow, flowchart, graphic element, grunge, loop, motion, movement, object, old, operation, organization, pie, presentation, process, production, relationship, repetitive, rotation, round, sequence, step, system, teamwork, wheel. The prominent colors used in the PowerPoint template are Blue, Gray, Black. Enact plans with our 3 Stages Concentric Operational Processes Ppt Business Plan Downloads PowerPoint Templates. Download without worries with our money back guaranteee.
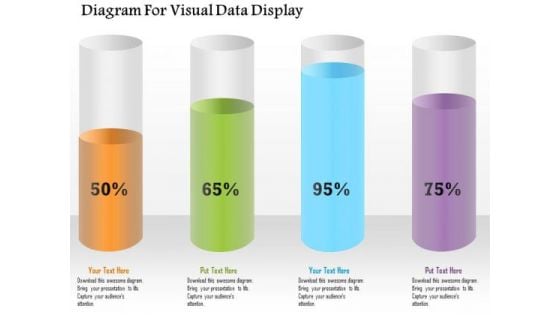
Business Diagram Diagram For Visual Data Display Presentation Template
Four colored cylindrical bars with percentage values are used to design this power point template. This diagram slide helps to display financial data analysis. Use this diagram for your business and finance related presentations.
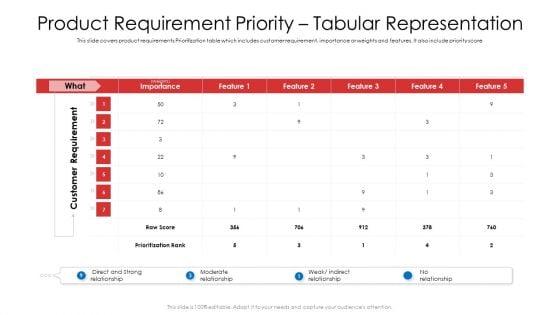
Product Requirement Priority Tabular Representation Ppt Pictures Diagrams PDF
This slide covers product requirements Prioritization table which includes customer requirement, importance or weights and features. It also include priority score. Deliver an awe-inspiring pitch with this creative product requirement priority tabular representation ppt pictures diagrams pdf bundle. Topics like customer requirement, prioritization rank, moderate relationship can be discussed with this completely editable template. It is available for immediate download depending on the needs and requirements of the user.
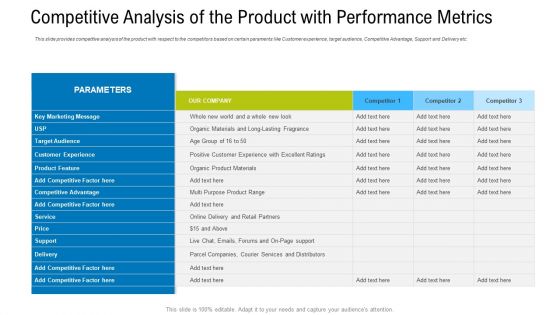
Competitive Analysis Of The Product With Performance Metrics Diagrams PDF
This slide provides competitive analysis of the product with respect to the competitors based on certain paraments like Customer experience, target audience, Competitive Advantage, Support and Delivery etc.Deliver an awe-inspiring pitch with this creative competitive analysis of the product with performance metrics diagrams pdf. bundle. Topics like marketing message, competitive advantage can be discussed with this completely editable template. It is available for immediate download depending on the needs and requirements of the user.
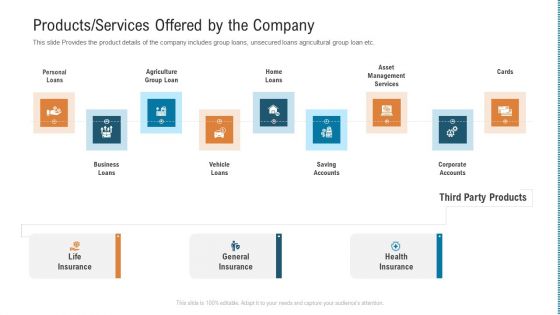
Products Services Offered By The Company Diagrams PDF
This slide Provides the product details of the company includes group loans, unsecured loans agricultural group loan etc. Deliver an awe-inspiring pitch with this creative products services offered by the company diagrams pdf. bundle. Topics like life insurance, general insurance, health insurance can be discussed with this completely editable template. It is available for immediate download depending on the needs and requirements of the user.
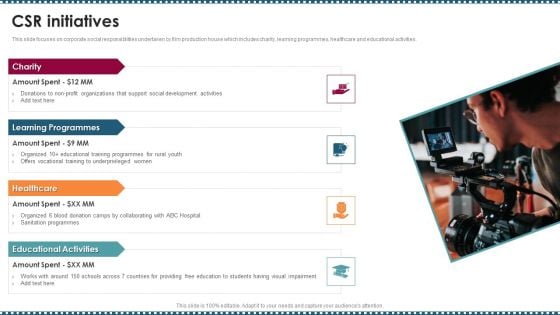
Feature Film Production Company Profile CSR Initiatives Diagrams PDF
This slide represents the film production house comparison with competitors based on market share which shows our leading company with greatest share in US market.Deliver and pitch your topic in the best possible manner with this Feature Film Production Company Profile CSR Initiatives Diagrams PDF Use them to share invaluable insights on Amount Spent, Learning Programs, Educational Activities and impress your audience. This template can be altered and modified as per your expectations. So, grab it now.
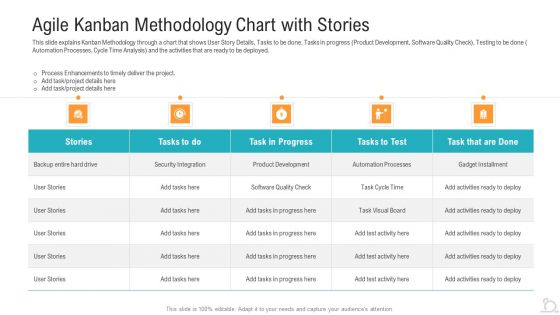
Agile Kanban Methodology Chart With Stories Microsoft PDF
Deliver an awe inspiring pitch with this creative agile kanban methodology chart with stories microsoft pdf bundle. Topics like security integration, automation processes, product development can be discussed with this completely editable template. It is available for immediate download depending on the needs and requirements of the user.
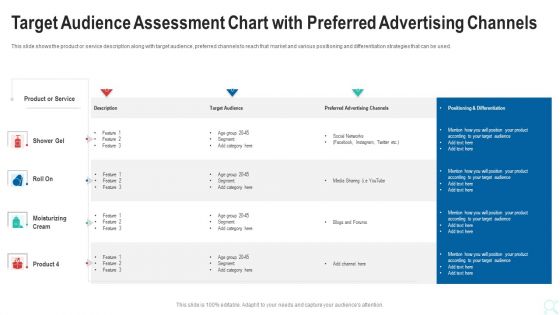
Target Audience Assessment Chart With Preferred Advertising Channels Inspiration PDF
Deliver an awe inspiring pitch with this creative target audience assessment chart with preferred advertising channels inspiration pdf bundle. Topics like product or service, target audience, preferred advertising channels can be discussed with this completely editable template. It is available for immediate download depending on the needs and requirements of the user.
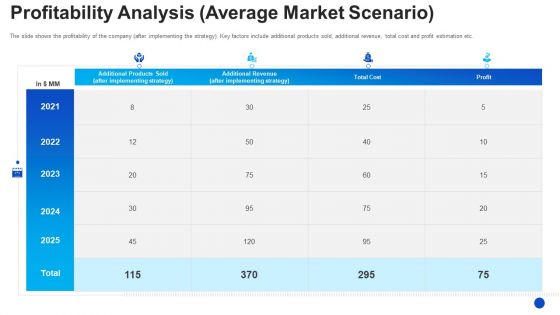
Profitability Analysis Average Market Scenario Themes PDF
The slide shows the profitability of the company after implementing the strategy. Key factors include additional products sold, additional revenue, total cost and profit estimation etc. Deliver an awe inspiring pitch with this creative profitability analysis average market scenario themes pdf bundle. Topics like additional products sold, additional revenue, after implementing strategy can be discussed with this completely editable template. It is available for immediate download depending on the needs and requirements of the user.
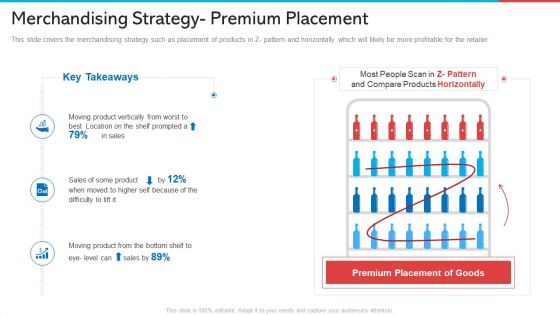
Merchandising Strategy- Premium Placement Themes PDF
This slide covers the merchandising strategy such as placement of products in Z pattern and horizontally which will likely be more profitable for the retailer. Deliver an awe inspiring pitch with this creative merchandising strategy- premium placement themes pdf bundle. Topics like sales, products can be discussed with this completely editable template. It is available for immediate download depending on the needs and requirements of the user.
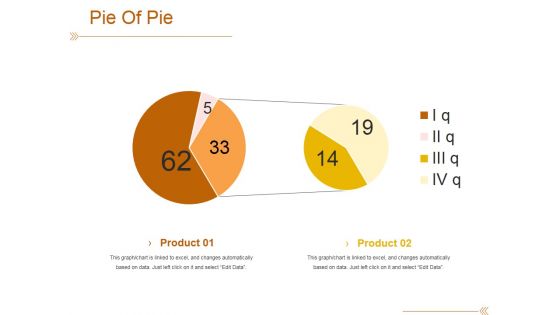
Pie Of Pie Ppt PowerPoint Presentation Portfolio Diagrams
This is a pie of pie ppt powerpoint presentation portfolio diagrams. This is a two stage process. The stages in this process are product, pie, business, marketing, management.
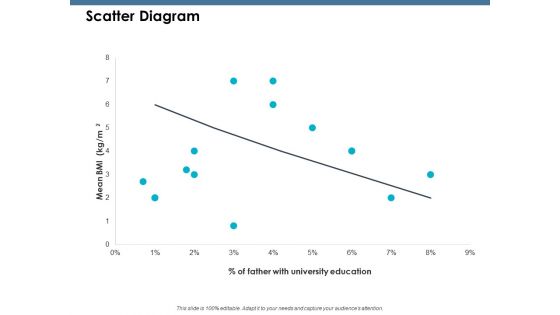
Scatter Diagram Ppt PowerPoint Presentation Pictures Graphics Design
This is a scatter diagram ppt powerpoint presentation pictures graphics design. This is a two stage process. The stages in this process are product, percentage, business, marketing.
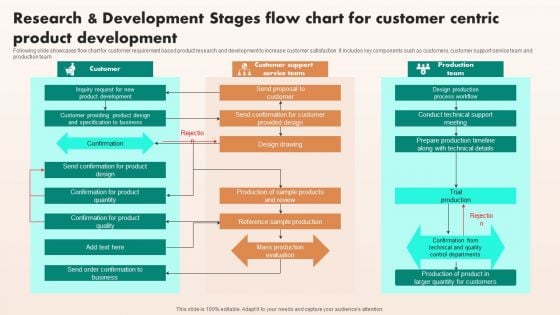
Research And Development Stages Flow Chart For Customer Centric Product Development Mockup PDF
Following slide showcases flow chart for customer requirement based product research and development to increase customer satisfaction. It includes key components such as customers, customer support service team and production team. Persuade your audience using this Research And Development Stages Flow Chart For Customer Centric Product Development Mockup PDF. This PPT design covers three stages, thus making it a great tool to use. It also caters to a variety of topics including Customer, Customer Support Service Team, Production Team. Download this PPT design now to present a convincing pitch that not only emphasizes the topic but also showcases your presentation skills.
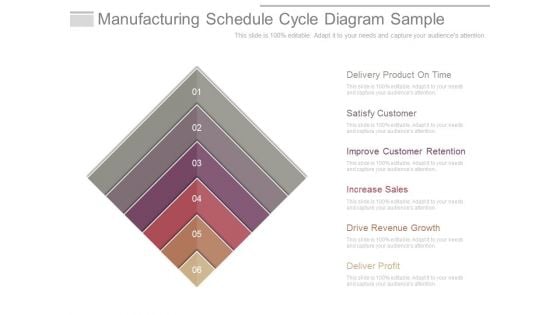
Manufacturing Schedule Cycle Diagram Sample
This is a manufacturing schedule cycle diagram sample. This is a six stage process. The stages in this process are delivery product on time, satisfy customer, improve customer retention, increase sales, drive revenue growth, deliver profit.
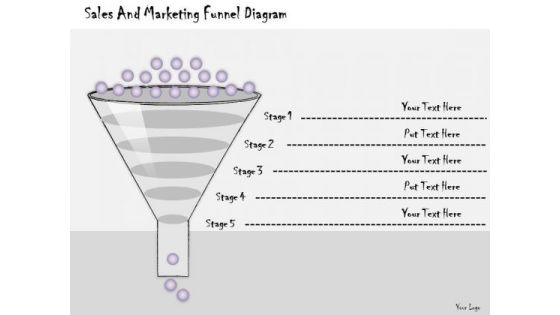
Ppt Slide Sales And Marketing Funnel Diagram Strategic Planning
Your Thoughts Will Be The Main Course. Provide The Dressing With Our PPT Slide sales and marketing funnel diagram strategic planning Powerpoint Templates. Dress Up Your Views With Our Business Plan Powerpoint Templates. Deliver Your Ideas With Aplomb.

Ppt Slide 5 Interconnected Circle Diagram Consulting Firms
Our PPT Slide 5 interconnected circle diagram consulting firms Powerpoint Templates Deliver At Your Doorstep. Let Them In For A Wonderful Experience. Dig Out The Dope With Our Business Plan Powerpoint Templates. Your Thoughts Will Expose The Truth.
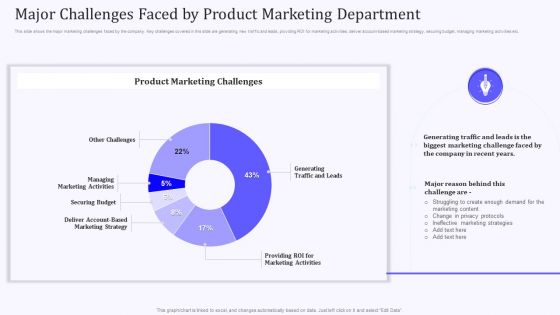
Product Marketing And Awareness Programs Major Challenges Faced By Product Marketing Inspiration PDF
This slide shows the major marketing challenges faced by the company. Key challenges covered in this slide are generating new traffic and leads, providing ROI for marketing activities, deliver account-based marketing strategy, securing budget, managing marketing activities etc. Do you know about Slidesgeeks Product Marketing And Awareness Programs Major Challenges Faced By Product Marketing Inspiration PDF These are perfect for delivering any kind od presentation. Using it, create PowerPoint presentations that communicate your ideas and engage audiences. Save time and effort by using our pre-designed presentation templates that are perfect for a wide range of topic. Our vast selection of designs covers a range of styles, from creative to business, and are all highly customizable and easy to edit. Download as a PowerPoint template or use them as Google Slides themes.
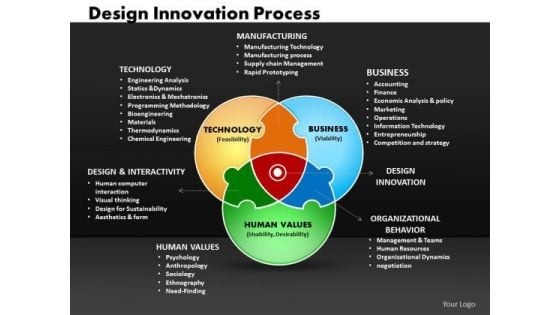
Business Venn Diagrams PowerPoint Templates Business Design Innovation Process Ppt Slides
Business Venn Diagrams PowerPoint Templates Business design innovation process PPT Slides-A Venn diagram is a graphical illustration of the relationships between and among sets of data, groups of objects that share something in common. The Venn diagram is made up of two or more overlapping circles that show all possible logical relations.-Business Venn Diagrams PowerPoint Templates Business design innovation process PPT Slides-This template can be used for presentations relating to Analysis, Assay, Biology, Biotechnology, Chemical, Chemist, Chemistry, Clinical, Discovery, Drug, Equipment, Experiment, Finger, Glass, Glassware, Glove, Hold, Instrument, Lab, Laboratory, Medical, Medicine, Microbiology, Pharmaceutical, Pharmacology, Process, Research, Sample, Science Break out of the cocoon with our Business Venn Diagrams PowerPoint Templates Business Design Innovation Process Ppt Slides. Let your thoughts take to the air.
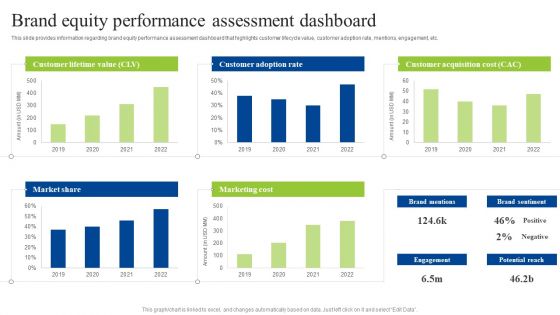
Brand Personality Improvement To Increase Profits Brand Equity Performance Assessment Dashboard Diagrams PDF
This slide provides information regarding brand equity performance assessment dashboard that highlights customer lifecycle value, customer adoption rate, mentions, engagement, etc. Do you have to make sure that everyone on your team knows about any specific topic I yes, then you should give Brand Personality Improvement To Increase Profits Brand Equity Performance Assessment Dashboard Diagrams PDF a try. Our experts have put a lot of knowledge and effort into creating this impeccable Brand Personality Improvement To Increase Profits Brand Equity Performance Assessment Dashboard Diagrams PDF. You can use this template for your upcoming presentations, as the slides are perfect to represent even the tiniest detail. You can download these templates from the Slidegeeks website and these are easy to edit. So grab these today.
Influencers Marketing Campaign Performance Tracking Dashboard Ppt PowerPoint Presentation Diagram Lists PDF
This slide covers performance monitoring dashboard of influencer based referral marketing program. It includes elements such as impressions on Instagram, likes, comments, clicks, sales generated along with value calculators and campaign breakdown based on gender and age. Formulating a presentation can take up a lot of effort and time, so the content and message should always be the primary focus. The visuals of the PowerPoint can enhance the presenters message, so our Influencers Marketing Campaign Performance Tracking Dashboard Ppt PowerPoint Presentation Diagram Lists PDF was created to help save time. Instead of worrying about the design, the presenter can concentrate on the message while our designers work on creating the ideal templates for whatever situation is needed. Slidegeeks has experts for everything from amazing designs to valuable content, we have put everything into Influencers Marketing Campaign Performance Tracking Dashboard Ppt PowerPoint Presentation Diagram Lists PDF
Reinforcement Learning Techniques And Applications Performance Tracking Dashboard Reinforcement Diagrams PDF
This slide shows the roadmap for the reinforcement learning project, including the list of tasks to be performed from March 2023 to February 2024. The tasks include initializing the values table, observing the current state, choosing an action for that state, and so on. Formulating a presentation can take up a lot of effort and time, so the content and message should always be the primary focus. The visuals of the PowerPoint can enhance the presenters message, so our Reinforcement Learning Techniques And Applications Performance Tracking Dashboard Reinforcement Diagrams PDF was created to help save time. Instead of worrying about the design, the presenter can concentrate on the message while our designers work on creating the ideal templates for whatever situation is needed. Slidegeeks has experts for everything from amazing designs to valuable content, we have put everything into Reinforcement Learning Techniques And Applications Performance Tracking Dashboard Reinforcement Diagrams PDF
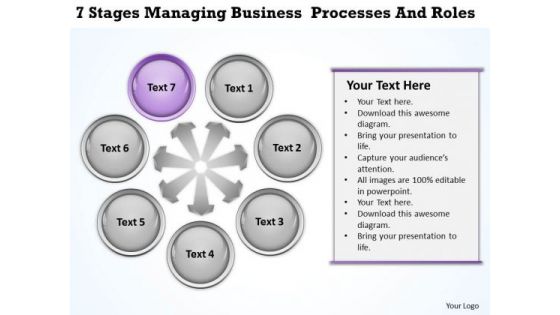
Business Use Case Diagram Example Managing Processes And Roles Ppt PowerPoint Slides
We present our Business Use Case Diagram Example Managing Processes And Roles Ppt Powerpoint Slides.Download our Arrows PowerPoint Templates because Our PowerPoint Templates and Slides will let you meet your Deadlines. Present our Business PowerPoint Templates because It will get your audience in sync. Download and present our Circle Charts PowerPoint Templates because It will let you Set new benchmarks with our PowerPoint Templates and Slides. They will keep your prospects well above par. Use our Shapes PowerPoint Templates because You can Inspire your team with our PowerPoint Templates and Slides. Let the force of your ideas flow into their minds. Download our Process and Flows PowerPoint Templates because Our PowerPoint Templates and Slides provide you with a vast range of viable options. Select the appropriate ones and just fill in your text. Use these PowerPoint slides for presentations relating to Abstract, Arrow, Blue, Business, Button, Chart, Circle, Company, Cross, Data, Design, Diagram, Direction, Document, Financial, Five, Function, Green, Management, Market, Marketing, Model, Multicolored, Multiple, Navigation, Network, Options, Orange, Plan, Presentation, Process, Red, Results, Shiny, Sphere, Statistics, Structure, Template, Three, Vector, Website, Wheel. The prominent colors used in the PowerPoint template are Purple, Gray, Black. Audience approval is always sought after. Our Business Use Case Diagram Example Managing Processes And Roles Ppt PowerPoint Slides will fetch it for you.
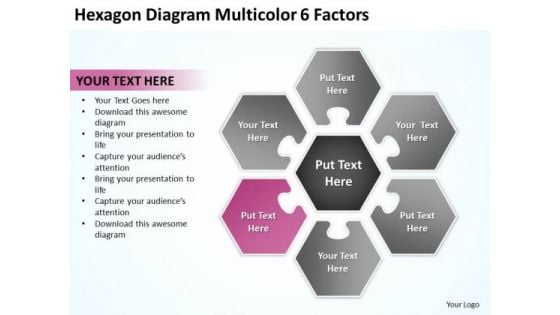
Hexagon Diagram Multicolor 6 Factors Cell Phone Business Plans PowerPoint Slides
We present our hexagon diagram multicolor 6 factors cell phone business plans PowerPoint Slides.Use our Flow Charts PowerPoint Templates because you can Add colour to your speech with our PowerPoint Templates and Slides. Your presentation will leave your audience speechless. Present our Process and Flows PowerPoint Templates because Our PowerPoint Templates and Slides offer you the widest possible range of options. Download our Marketing PowerPoint Templates because It can Bubble and burst with your ideas. Present our Shapes PowerPoint Templates because Our PowerPoint Templates and Slides are created by a hardworking bunch of busybees. Always flitting around with solutions gauranteed to please. Present our Business PowerPoint Templates because You should Bet on your luck with our PowerPoint Templates and Slides. Be assured that you will hit the jackpot.Use these PowerPoint slides for presentations relating to Process, chart, market, website, network, cross, statistics, model, document, junction, business, plan, presentation, glossy, diagram, circle, brochure, data, marketing, management, multicolored, six, box, sphere, options, catalog, shiny, direction, design, text,company, navigation, financial, structure, multiple, button, results. The prominent colors used in the PowerPoint template are Pink, Gray, Black. This may prove your fateful day. Change the course of your days with our Hexagon Diagram Multicolor 6 Factors Cell Phone Business Plans PowerPoint Slides.
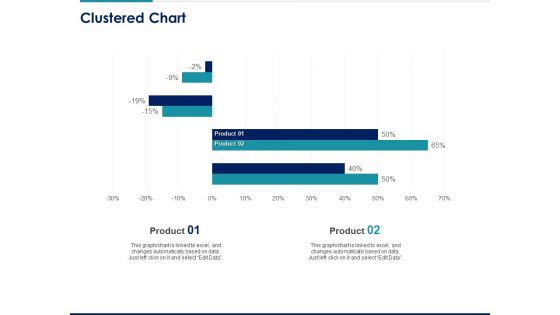
Managing Organization Finance Clustered Chart Ppt Show Demonstration PDF
Presenting this set of slides with name managing organization finance clustered chart ppt show demonstration pdf. The topics discussed in these slides are product 01, product 02. This is a completely editable PowerPoint presentation and is available for immediate download. Download now and impress your audience.
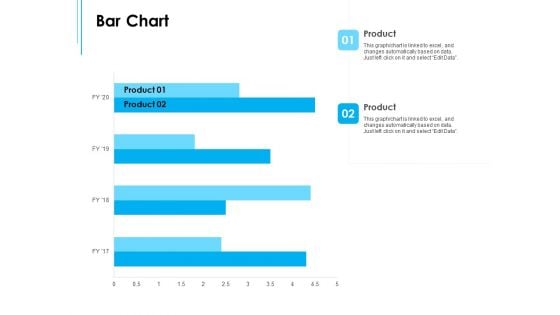
Business Environment Components Bar Chart Ppt Professional Format Ideas PDF
Presenting this set of slides with name business environment components bar chart ppt professional format ideas pdf. The topics discussed in these slides are product 01, product 02. This is a completely editable PowerPoint presentation and is available for immediate download. Download now and impress your audience.


 Continue with Email

 Home
Home


