Google Analytics
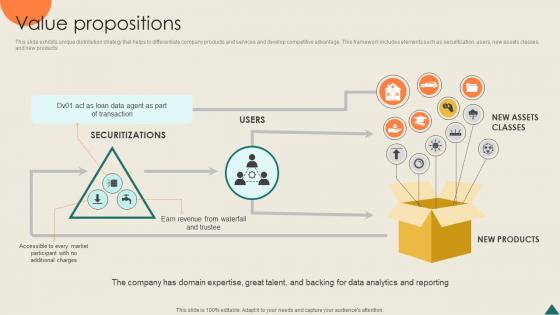
Value Propositions Financial Analytics Platform Investor Elevator Pitch Deck
This slide exhibits unique distribution strategy that helps to differentiate company products and services and develop competitive advantage. This framework includes elements such as securitization, users, new assets classes, and new products. If you are looking for a format to display your unique thoughts, then the professionally designed Value Propositions Financial Analytics Platform Investor Elevator Pitch Deck is the one for you. You can use it as a Google Slides template or a PowerPoint template. Incorporate impressive visuals, symbols, images, and other charts. Modify or reorganize the text boxes as you desire. Experiment with shade schemes and font pairings. Alter, share or cooperate with other people on your work. Download Value Propositions Financial Analytics Platform Investor Elevator Pitch Deck and find out how to give a successful presentation. Present a perfect display to your team and make your presentation unforgettable. This slide exhibits unique distribution strategy that helps to differentiate company products and services and develop competitive advantage. This framework includes elements such as securitization, users, new assets classes, and new products.
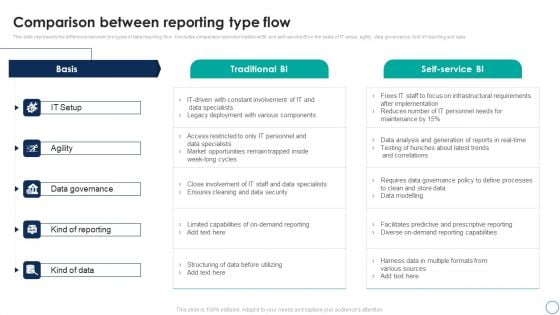
Business Analytics Application Comparison Between Reporting Type Flow Ideas PDF
This slide represents the difference between the types of data reporting flow. It includes comparison between traditional BI and self-service BI on the basis of IT setup, agility, data governance, kind of reporting and data. Are you in need of a template that can accommodate all of your creative concepts This one is crafted professionally and can be altered to fit any style. Use it with Google Slides or PowerPoint. Include striking photographs, symbols, depictions, and other visuals. Fill, move around, or remove text boxes as desired. Test out color palettes and font mixtures. Edit and save your work, or work with colleagues. Download Business Analytics Application Comparison Between Reporting Type Flow Ideas PDF and observe how to make your presentation outstanding. Give an impeccable presentation to your group and make your presentation unforgettable.
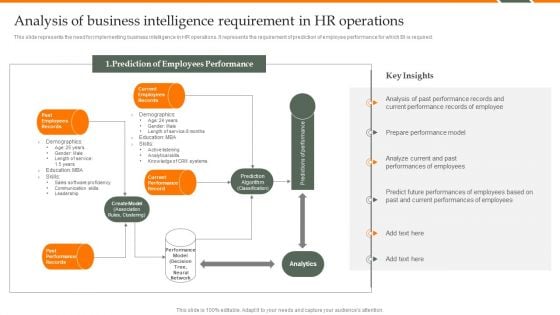
Human Resource Analytics Analysis Of Business Intelligence Requirement Template PDF
This slide represents the need for implementing business intelligence in HR operations. It represents the requirement of prediction of employee performance for which BI is required. Do you know about Slidesgeeks Human Resource Analytics Analysis Of Business Intelligence Requirement Template PDF These are perfect for delivering any kind od presentation. Using it, create PowerPoint presentations that communicate your ideas and engage audiences. Save time and effort by using our pre-designed presentation templates that are perfect for a wide range of topic. Our vast selection of designs covers a range of styles, from creative to business, and are all highly customizable and easy to edit. Download as a PowerPoint template or use them as Google Slides themes.
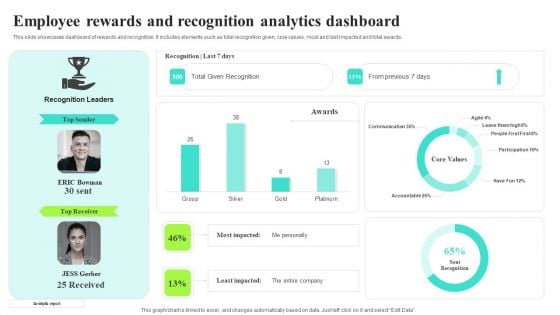
Employee Rewards And Recognition Analytics Dashboard Rules PDF
This slide showcases dashboard of rewards and recognition. It includes elements such as total recognition given, core values, most and last impacted and total awards. Are you in need of a template that can accommodate all of your creative concepts This one is crafted professionally and can be altered to fit any style. Use it with Google Slides or PowerPoint. Include striking photographs, symbols, depictions, and other visuals. Fill, move around, or remove text boxes as desired. Test out color palettes and font mixtures. Edit and save your work, or work with colleagues. Download Employee Rewards And Recognition Analytics Dashboard Rules PDF and observe how to make your presentation outstanding. Give an impeccable presentation to your group and make your presentation unforgettable.
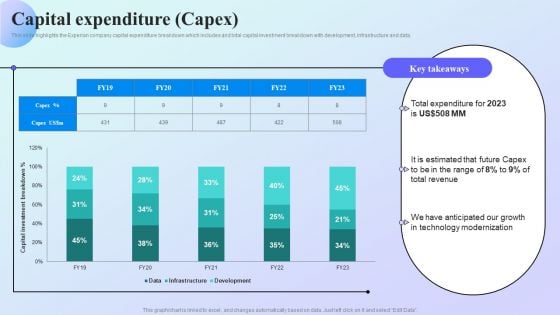
Information Analytics Company Outline Capital Expenditure Capex Information PDF
This slide highlights the Experian company capital expenditure breakdown which includes and total capital investment breakdown with development, infrastructure and data. Are you in need of a template that can accommodate all of your creative concepts This one is crafted professionally and can be altered to fit any style. Use it with Google Slides or PowerPoint. Include striking photographs, symbols, depictions, and other visuals. Fill, move around, or remove text boxes as desired. Test out color palettes and font mixtures. Edit and save your work, or work with colleagues. Download Information Analytics Company Outline Capital Expenditure Capex Information PDF and observe how to make your presentation outstanding. Give an impeccable presentation to your group and make your presentation unforgettable.
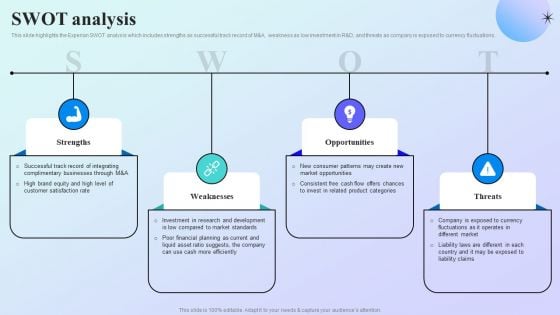
Information Analytics Company Outline SWOT Analysis Demonstration PDF
This slide highlights the Experian SWOT analysis which includes strengths as successful track record of M and A, weakness as low investment in R and D, and threats as company is exposed to currency fluctuations. Retrieve professionally designed Information Analytics Company Outline SWOT Analysis Demonstration PDF to effectively convey your message and captivate your listeners. Save time by selecting pre made slideshows that are appropriate for various topics, from business to educational purposes. These themes come in many different styles, from creative to corporate, and all of them are easily adjustable and can be edited quickly. Access them as PowerPoint templates or as Google Slides themes. You do not have to go on a hunt for the perfect presentation because Slidegeeks got you covered from everywhere.
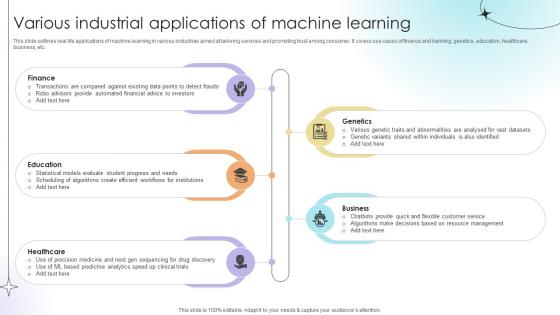
Various Industrial Applications Of Machine Learning Data Analytics SS V
This slide outlines real life applications of machine learning in various industries aimed at tailoring services and promoting trust among consumer. It covers use cases of finance and banking, genetics, education, healthcare, business, etc.Retrieve professionally designed Various Industrial Applications Of Machine Learning Data Analytics SS V to effectively convey your message and captivate your listeners. Save time by selecting pre-made slideshows that are appropriate for various topics, from business to educational purposes. These themes come in many different styles, from creative to corporate, and all of them are easily adjustable and can be edited quickly. Access them as PowerPoint templates or as Google Slides themes. You do not have to go on a hunt for the perfect presentation because Slidegeeks got you covered from everywhere. This slide outlines real life applications of machine learning in various industries aimed at tailoring services and promoting trust among consumer. It covers use cases of finance and banking, genetics, education, healthcare, business, etc.
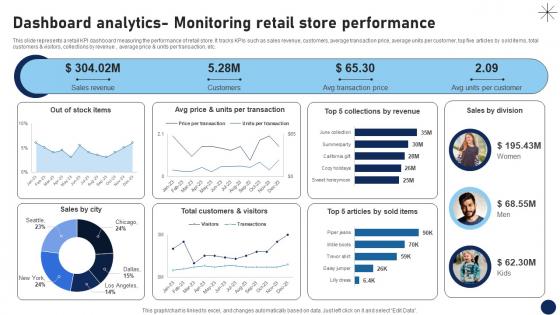
Dashboard Analytics Monitoring Retail Store Performance DT SS V
This slide represents a retail KPI dashboard measuring the performance of retail store. It tracks KPIs such as sales revenue, customers, average transaction price, average units per customer, top five articles by sold items, total customers and visitors, collections by revenue , average price and units per transaction, etc.Are you in need of a template that can accommodate all of your creative concepts This one is crafted professionally and can be altered to fit any style. Use it with Google Slides or PowerPoint. Include striking photographs, symbols, depictions, and other visuals. Fill, move around, or remove text boxes as desired. Test out color palettes and font mixtures. Edit and save your work, or work with colleagues. Download Dashboard Analytics Monitoring Retail Store Performance DT SS V and observe how to make your presentation outstanding. Give an impeccable presentation to your group and make your presentation unforgettable. This slide represents a retail KPI dashboard measuring the performance of retail store. It tracks KPIs such as sales revenue, customers, average transaction price, average units per customer, top five articles by sold items, total customers and visitors, collections by revenue , average price and units per transaction, etc.
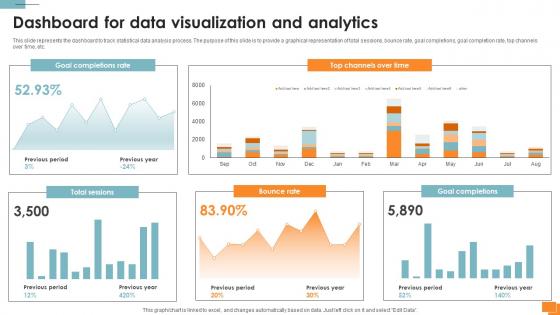
Statistical Tools For Evidence Dashboard For Data Visualization And Analytics
This slide represents the dashboard to track statistical data analysis process. The purpose of this slide is to provide a graphical representation of total sessions, bounce rate, goal completions, goal completion rate, top channels over time, etc. Are you in need of a template that can accommodate all of your creative concepts This one is crafted professionally and can be altered to fit any style. Use it with Google Slides or PowerPoint. Include striking photographs, symbols, depictions, and other visuals. Fill, move around, or remove text boxes as desired. Test out color palettes and font mixtures. Edit and save your work, or work with colleagues. Download Statistical Tools For Evidence Dashboard For Data Visualization And Analytics and observe how to make your presentation outstanding. Give an impeccable presentation to your group and make your presentation unforgettable. This slide represents the dashboard to track statistical data analysis process. The purpose of this slide is to provide a graphical representation of total sessions, bounce rate, goal completions, goal completion rate, top channels over time, etc.

Real Life Applications Of Genetic Algorithms Data Analytics SS V
This slide highlights real life examples of genetic algorithms aimed at understanding its extensive use at a global level. It covers applications in various firms such as Google, Amazon, Uber, Tesla, Autodesk, etc. Presenting this PowerPoint presentation, titled Real Life Applications Of Genetic Algorithms Data Analytics SS V, with topics curated by our researchers after extensive research. This editable presentation is available for immediate download and provides attractive features when used. Download now and captivate your audience. Presenting this Real Life Applications Of Genetic Algorithms Data Analytics SS V. Our researchers have carefully researched and created these slides with all aspects taken into consideration. This is a completely customizable Real Life Applications Of Genetic Algorithms Data Analytics SS V that is available for immediate downloading. Download now and make an impact on your audience. Highlight the attractive features available with our PPTs. This slide highlights real life examples of genetic algorithms aimed at understanding its extensive use at a global level. It covers applications in various firms such as Google, Amazon, Uber, Tesla, Autodesk, etc.
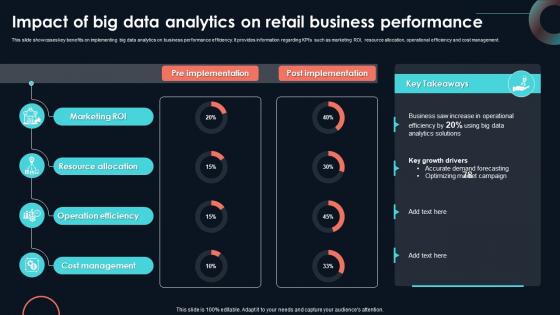
Impact Of Big Data Analytics On Retail Business Developing Strategic Insights Using Big Data Analytics SS V
This slide showcases key benefits on implementing big data analytics on business performance efficiency. It provides information regarding KPIs such as marketing ROI, resource allocation, operational efficiency and cost management. Do you know about Slidesgeeks Impact Of Big Data Analytics On Retail Business Developing Strategic Insights Using Big Data Analytics SS V These are perfect for delivering any kind od presentation. Using it, create PowerPoint presentations that communicate your ideas and engage audiences. Save time and effort by using our pre-designed presentation templates that are perfect for a wide range of topic. Our vast selection of designs covers a range of styles, from creative to business, and are all highly customizable and easy to edit. Download as a PowerPoint template or use them as Google Slides themes. This slide showcases key benefits on implementing big data analytics on business performance efficiency. It provides information regarding KPIs such as marketing ROI, resource allocation, operational efficiency and cost management.
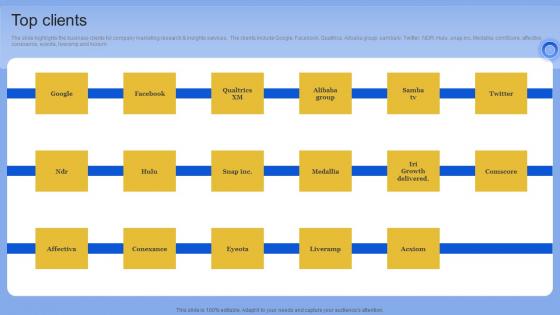
Top Clients Data Analytics Company Outline Pictures PDF
The slide highlights the business clients for company marketing research and insights services. The clients include Google, Facebook, Qualtrics, Alibaba group, samba tv, Twitter, NDR, Hulu, snap.inc, Medallia, comScore, affective, conexance, eyeota, liveramp and Acxiom Find a pre-designed and impeccable Top Clients Data Analytics Company Outline Pictures PDF The templates can ace your presentation without additional effort. You can download these easy-to-edit presentation templates to make your presentation stand out from others. So, what are you waiting for Download the template from Slidegeeks today and give a unique touch to your presentation. The slide highlights the business clients for company marketing research and insights services. The clients include Google, Facebook, Qualtrics, Alibaba group, samba tv, Twitter, NDR, Hulu, snap.inc, Medallia, comScore, affective, conexance, eyeota, liveramp and Acxiom
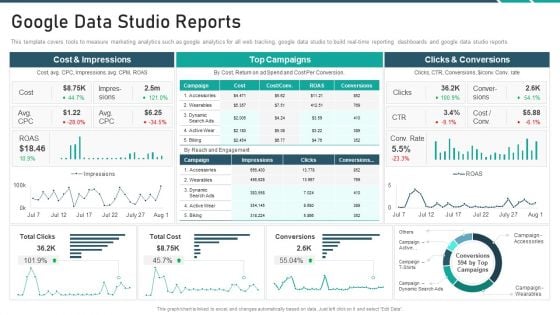
Online Promotion Playbook Google Data Studio Reports Designs PDF
This template covers tools to measure marketing analytics such as google analytics for all web tracking, google data studio to build real-time reporting dashboards and google data studio reports. Deliver an awe inspiring pitch with this creative online promotion playbook google data studio reports designs pdf bundle. Topics like google data studio reports can be discussed with this completely editable template. It is available for immediate download depending on the needs and requirements of the user.
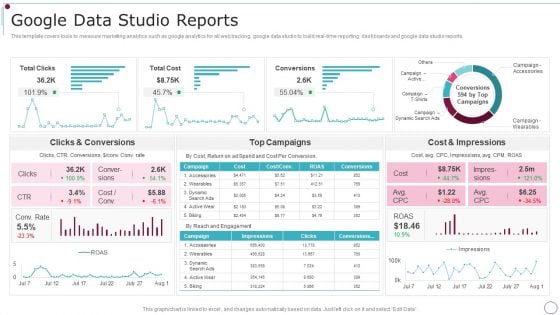
Playbook For Content Advertising Google Data Studio Reports Graphics PDF
This template covers tools to measure marketing analytics such as google analytics for all web tracking, google data studio to build real-time reporting dashboards and google data studio reports. Deliver an awe inspiring pitch with this creative Playbook For Content Advertising Google Data Studio Reports Graphics PDF bundle. Topics like Conversions, Campaigns, Impressions can be discussed with this completely editable template. It is available for immediate download depending on the needs and requirements of the user.
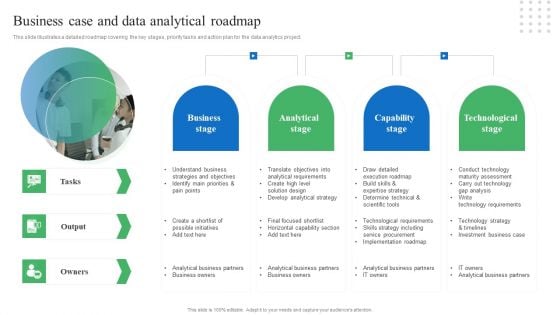
Toolkit For Data Science And Analytics Transition Business Case And Data Analytical Roadmap Professional PDF
This slide illustrates a detailed roadmap covering the key stages, priority tasks and action plan for the data analytics project. Do you know about Slidesgeeks Toolkit For Data Science And Analytics Transition Business Case And Data Analytical Roadmap Professional PDF These are perfect for delivering any kind od presentation. Using it, create PowerPoint presentations that communicate your ideas and engage audiences. Save time and effort by using our pre designed presentation templates that are perfect for a wide range of topic. Our vast selection of designs covers a range of styles, from creative to business, and are all highly customizable and easy to edit. Download as a PowerPoint template or use them as Google Slides themes.
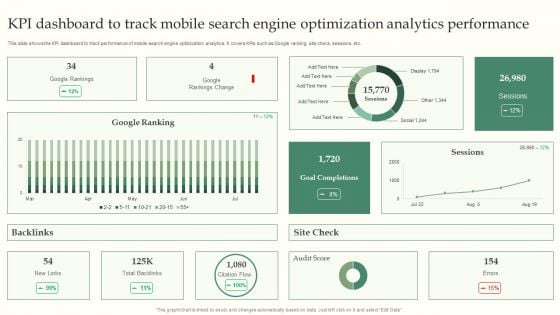
KPI Dashboard To Track Mobile Search Engine Optimization Analytics Performance Introduction PDF
This slide shows the KPI dashboard to track performance of mobile search engine optimization analytics. It covers KPIs such as Google ranking, site check, sessions, etc. Showcasing this set of slides titled KPI Dashboard To Track Mobile Search Engine Optimization Analytics Performance Introduction PDF. The topics addressed in these templates are KPI Dashboard, Search Engine Optimization, Analytics Performance. All the content presented in this PPT design is completely editable. Download it and make adjustments in color, background, font etc. as per your unique business setting.
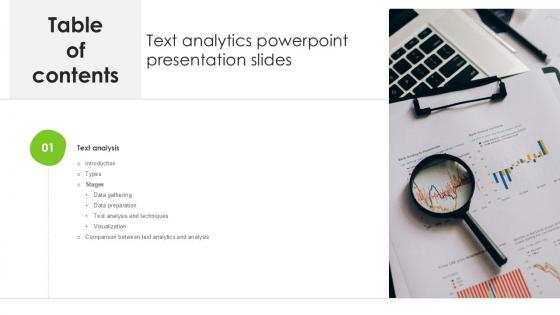
Table Of Contents Text Analytics Powerpoint Presentation Slides PPT Presentation SS
Do you know about Slidesgeeks Table Of Contents Text Analytics Powerpoint Presentation Slides PPT Presentation SS These are perfect for delivering any kind od presentation. Using it, create PowerPoint presentations that communicate your ideas and engage audiences. Save time and effort by using our pre-designed presentation templates that are perfect for a wide range of topic. Our vast selection of designs covers a range of styles, from creative to business, and are all highly customizable and easy to edit. Download as a PowerPoint template or use them as Google Slides themes. Our Table Of Contents Text Analytics Powerpoint Presentation Slides PPT Presentation SS are topically designed to provide an attractive backdrop to any subject. Use them to look like a presentation pro.
Business To Business Digital Google Data Studio Reports Icons PDF
This template covers tools to measure marketing analytics such as google analytics for all web tracking, google data studio to build real-time reporting dashboards and google data studio reports. Whether you have daily or monthly meetings, a brilliant presentation is necessary. Business To Business Digital Google Data Studio Reports Icons PDF can be your best option for delivering a presentation. Represent everything in detail using Business To Business Digital Google Data Studio Reports Icons PDF and make yourself stand out in meetings. The template is versatile and follows a structure that will cater to your requirements. All the templates prepared by Slidegeeks are easy to download and edit. Our research experts have taken care of the corporate themes as well. So, give it a try and see the results.
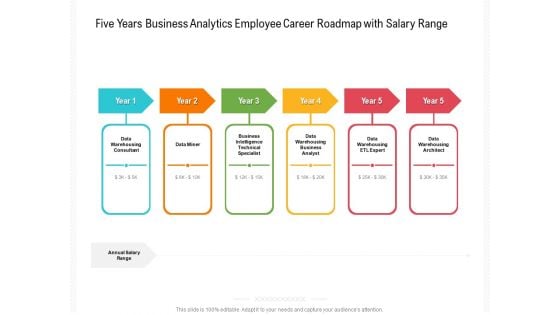
Five Years Business Analytics Employee Career Roadmap With Salary Range Designs
Presenting our jaw-dropping five years business analytics employee career roadmap with salary range designs. You can alternate the color, font size, font type, and shapes of this PPT layout according to your strategic process. This PPT presentation is compatible with Google Slides and is available in both standard screen and widescreen aspect ratios. You can also download this well-researched PowerPoint template design in different formats like PDF, JPG, and PNG. So utilize this visually-appealing design by clicking the download button given below.
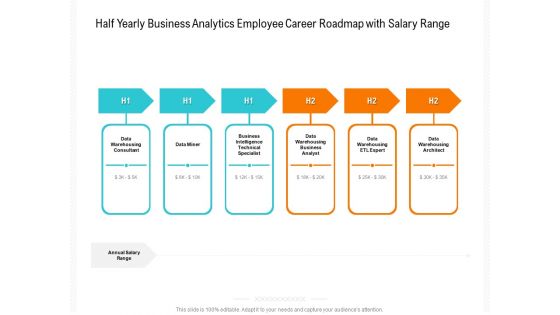
Half Yearly Business Analytics Employee Career Roadmap With Salary Range Elements
Presenting our jaw-dropping half yearly business analytics employee career roadmap with salary range elements. You can alternate the color, font size, font type, and shapes of this PPT layout according to your strategic process. This PPT presentation is compatible with Google Slides and is available in both standard screen and widescreen aspect ratios. You can also download this well-researched PowerPoint template design in different formats like PDF, JPG, and PNG. So utilize this visually-appealing design by clicking the download button given below.

Six Months Business Analytics Employee Career Roadmap With Salary Range Pictures
Presenting our jaw-dropping six months business analytics employee career roadmap with salary range pictures. You can alternate the color, font size, font type, and shapes of this PPT layout according to your strategic process. This PPT presentation is compatible with Google Slides and is available in both standard screen and widescreen aspect ratios. You can also download this well-researched PowerPoint template design in different formats like PDF, JPG, and PNG. So utilize this visually-appealing design by clicking the download button given below.
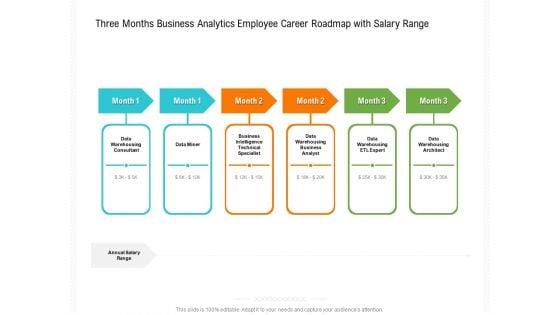
Three Months Business Analytics Employee Career Roadmap With Salary Range Information
Presenting our jaw-dropping three months business analytics employee career roadmap with salary range information. You can alternate the color, font size, font type, and shapes of this PPT layout according to your strategic process. This PPT presentation is compatible with Google Slides and is available in both standard screen and widescreen aspect ratios. You can also download this well-researched PowerPoint template design in different formats like PDF, JPG, and PNG. So utilize this visually-appealing design by clicking the download button given below.

Five Years Data Analytics Career Roadmap With Live Industry Projects Portrait
Presenting our jaw-dropping five years data analytics career roadmap with live industry projects portrait. You can alternate the color, font size, font type, and shapes of this PPT layout according to your strategic process. This PPT presentation is compatible with Google Slides and is available in both standard screen and widescreen aspect ratios. You can also download this well-researched PowerPoint template design in different formats like PDF, JPG, and PNG. So utilize this visually-appealing design by clicking the download button given below.
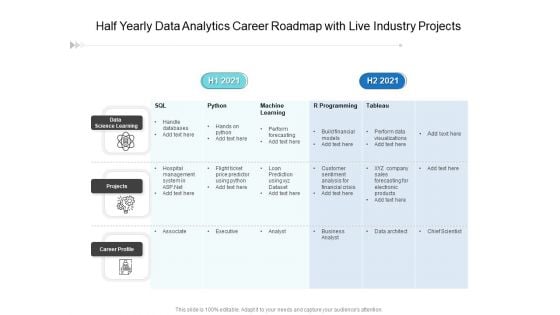
Half Yearly Data Analytics Career Roadmap With Live Industry Projects Formats
Presenting our jaw-dropping half yearly data analytics career roadmap with live industry projects formats You can alternate the color, font size, font type, and shapes of this PPT layout according to your strategic process. This PPT presentation is compatible with Google Slides and is available in both standard screen and widescreen aspect ratios. You can also download this well-researched PowerPoint template design in different formats like PDF, JPG, and PNG. So utilize this visually-appealing design by clicking the download button given below.
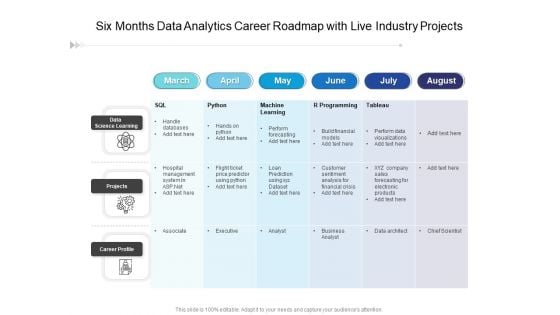
Six Months Data Analytics Career Roadmap With Live Industry Projects Demonstration
Presenting our jaw-dropping six months data analytics career roadmap with live industry projects demonstration. You can alternate the color, font size, font type, and shapes of this PPT layout according to your strategic process. This PPT presentation is compatible with Google Slides and is available in both standard screen and widescreen aspect ratios. You can also download this well-researched PowerPoint template design in different formats like PDF, JPG, and PNG. So utilize this visually-appealing design by clicking the download button given below.
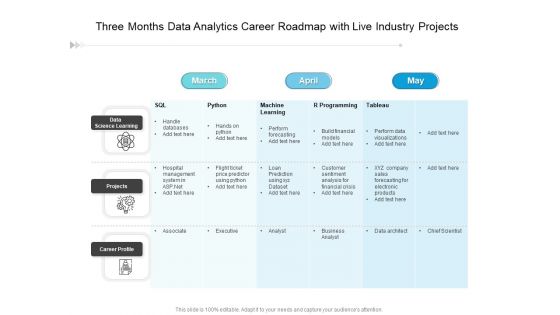
Three Months Data Analytics Career Roadmap With Live Industry Projects Elements
Presenting our jaw-dropping three months data analytics career roadmap with live industry projects elements. You can alternate the color, font size, font type, and shapes of this PPT layout according to your strategic process. This PPT presentation is compatible with Google Slides and is available in both standard screen and widescreen aspect ratios. You can also download this well-researched PowerPoint template design in different formats like PDF, JPG, and PNG. So utilize this visually-appealing design by clicking the download button given below.
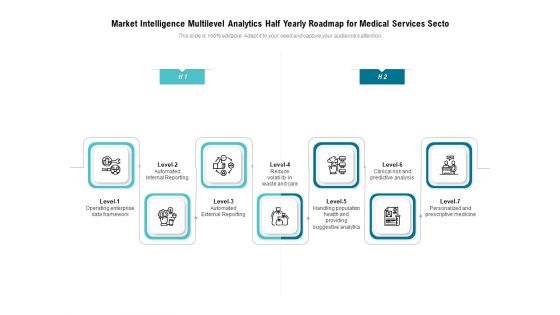
Market Intelligence Multilevel Analytics Half Yearly Roadmap For Medical Services Secto Rules
Introducing our market intelligence multilevel analytics half yearly roadmap for medical services secto rules. This PPT presentation is Google Slides compatible, therefore, you can share it easily with the collaborators for measuring the progress. Also, the presentation is available in both standard screen and widescreen aspect ratios. So edit the template design by modifying the font size, font type, color, and shapes as per your requirements. As this PPT design is fully editable it can be presented in PDF, JPG and PNG formats.
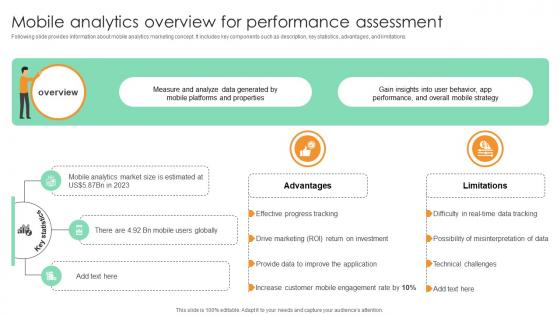
Mobile Analytics Overview For Performance Assessment Comprehensive Guide For Marketing Technology
Following slide provides information about mobile analytics marketing concept. It includes key components such as description, key statistics, advantages, and limitations.If you are looking for a format to display your unique thoughts, then the professionally designed Mobile Analytics Overview For Performance Assessment Comprehensive Guide For Marketing Technology is the one for you. You can use it as a Google Slides template or a PowerPoint template. Incorporate impressive visuals, symbols, images, and other charts. Modify or reorganize the text boxes as you desire. Experiment with shade schemes and font pairings. Alter, share or cooperate with other people on your work. Download Mobile Analytics Overview For Performance Assessment Comprehensive Guide For Marketing Technology and find out how to give a successful presentation. Present a perfect display to your team and make your presentation unforgettable. Following slide provides information about mobile analytics marketing concept. It includes key components such as description, key statistics, advantages, and limitations.
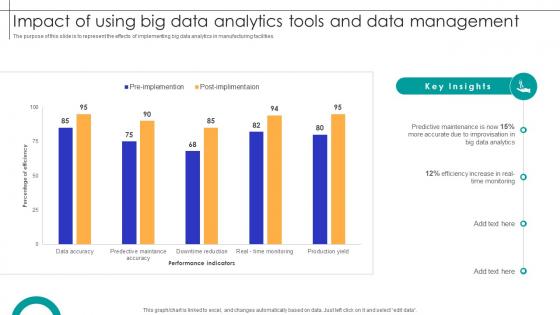
Impact Of Using Big Data Analytics Tools And Data Management Streamlining Production Ppt Example
The purpose of this slide is to represent the effects of implementing big data analytics in manufacturing facilities. Here you can discover an assortment of the finest PowerPoint and Google Slides templates. With these templates, you can create presentations for a variety of purposes while simultaneously providing your audience with an eye-catching visual experience. Download Impact Of Using Big Data Analytics Tools And Data Management Streamlining Production Ppt Example to deliver an impeccable presentation. These templates will make your job of preparing presentations much quicker, yet still, maintain a high level of quality. Slidegeeks has experienced researchers who prepare these templates and write high-quality content for you. Later on, you can personalize the content by editing the Impact Of Using Big Data Analytics Tools And Data Management Streamlining Production Ppt Example The purpose of this slide is to represent the effects of implementing big data analytics in manufacturing facilities.
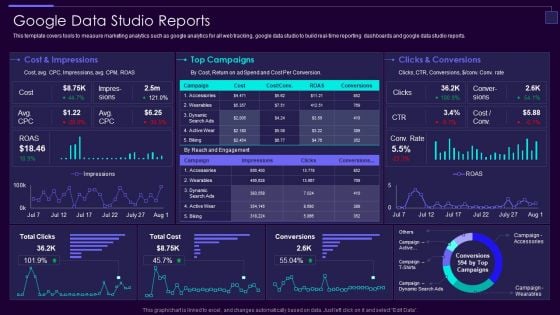
Social Media Brand Promotion Instructions Playbook Google Data Studio Reports Formats PDF
This template covers tools to measure marketing analytics such as google analytics for all web tracking, google data studio to build real-time reporting dashboards and google data studio reports.Deliver an awe inspiring pitch with this creative Social Media Brand Promotion Instructions Playbook Google Data Studio Reports Formats PDF bundle. Topics like Conversions, Cost And Impressions, Top Campaigns can be discussed with this completely editable template. It is available for immediate download depending on the needs and requirements of the user.
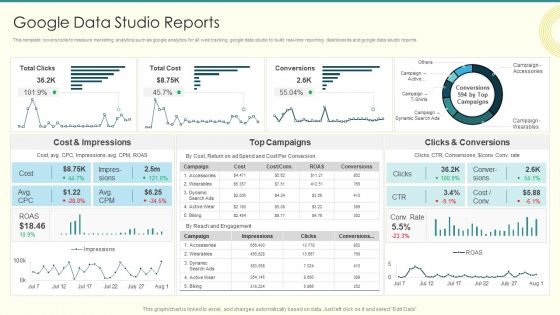
Security And Performance Digital Marketing Google Data Studio Reports Brochure PDF
This template covers tools to measure marketing analytics such as google analytics for all web tracking, google data studio to build real-time reporting dashboards and google data studio reports.Deliver an awe inspiring pitch with this creative Security And Performance Digital Marketing Google Data Studio Reports Brochure PDF bundle. Topics like Impressions, Clicks Conversions, Cost Impressions can be discussed with this completely editable template. It is available for immediate download depending on the needs and requirements of the user.
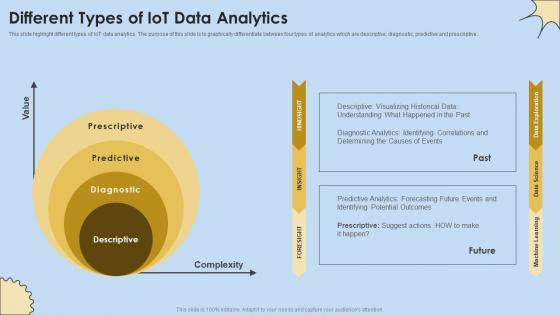
Different Types Of IoT Data Analytics Internet Of Things Analysis Mockup Pdf
This slide highlight different types of IoT data analytics. The purpose of this slide is to graphically differentiate between four types of analytics which are descriptive, diagnostic, predictive and prescriptive. Are you in need of a template that can accommodate all of your creative concepts This one is crafted professionally and can be altered to fit any style. Use it with Google Slides or PowerPoint. Include striking photographs, symbols, depictions, and other visuals. Fill, move around, or remove text boxes as desired. Test out color palettes and font mixtures. Edit and save your work, or work with colleagues. Download Different Types Of IoT Data Analytics Internet Of Things Analysis Mockup Pdf and observe how to make your presentation outstanding. Give an impeccable presentation to your group and make your presentation unforgettable. This slide highlight different types of IoT data analytics. The purpose of this slide is to graphically differentiate between four types of analytics which are descriptive, diagnostic, predictive and prescriptive.
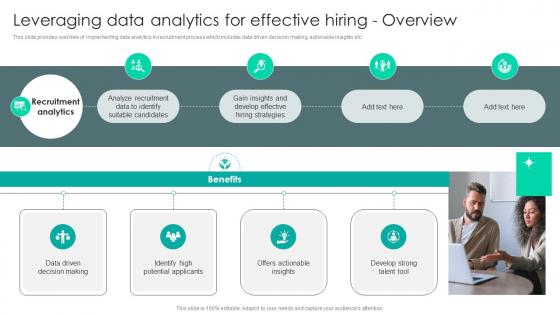
Strategic Staffing Using Data Leveraging Data Analytics For Effective Hiring Overview CRP DK SS V
This slide provides overview of implementing data analytics in recruitment process which includes data driven decision making, actionable insights etc. Here you can discover an assortment of the finest PowerPoint and Google Slides templates. With these templates, you can create presentations for a variety of purposes while simultaneously providing your audience with an eye-catching visual experience. Download Strategic Staffing Using Data Leveraging Data Analytics For Effective Hiring Overview CRP DK SS V to deliver an impeccable presentation. These templates will make your job of preparing presentations much quicker, yet still, maintain a high level of quality. Slidegeeks has experienced researchers who prepare these templates and write high-quality content for you. Later on, you can personalize the content by editing the Strategic Staffing Using Data Leveraging Data Analytics For Effective Hiring Overview CRP DK SS V. This slide provides overview of implementing data analytics in recruitment process which includes data driven decision making, actionable insights etc.
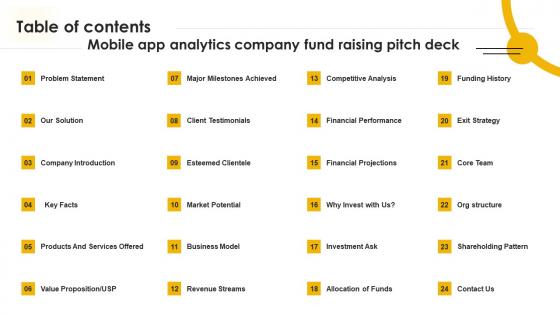
Table Of Contents Mobile App Analytics Company Fund Raising Pitch Deck Sample Pdf
If you are looking for a format to display your unique thoughts, then the professionally designed Table Of Contents Mobile App Analytics Company Fund Raising Pitch Deck Sample Pdf is the one for you. You can use it as a Google Slides template or a PowerPoint template. Incorporate impressive visuals, symbols, images, and other charts. Modify or reorganize the text boxes as you desire. Experiment with shade schemes and font pairings. Alter, share or cooperate with other people on your work. Download Table Of Contents Mobile App Analytics Company Fund Raising Pitch Deck Sample Pdf and find out how to give a successful presentation. Present a perfect display to your team and make your presentation unforgettable. Our Table Of Contents Mobile App Analytics Company Fund Raising Pitch Deck Sample Pdf are topically designed to provide an attractive backdrop to any subject. Use them to look like a presentation pro.
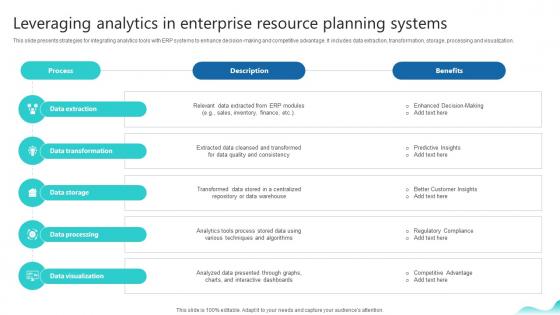
Leveraging Analytics In Enterprise Resource Planning Erp And Digital Transformation For Maximizing DT SS V
This slide presents strategies for integrating analytics tools with ERP systems to enhance decision-making and competitive advantage. It includes data extraction, transformation, storage, processing and visualization.Are you in need of a template that can accommodate all of your creative concepts This one is crafted professionally and can be altered to fit any style. Use it with Google Slides or PowerPoint. Include striking photographs, symbols, depictions, and other visuals. Fill, move around, or remove text boxes as desired. Test out color palettes and font mixtures. Edit and save your work, or work with colleagues. Download Leveraging Analytics In Enterprise Resource Planning Erp And Digital Transformation For Maximizing DT SS V and observe how to make your presentation outstanding. Give an impeccable presentation to your group and make your presentation unforgettable. This slide presents strategies for integrating analytics tools with ERP systems to enhance decision-making and competitive advantage. It includes data extraction, transformation, storage, processing and visualization.
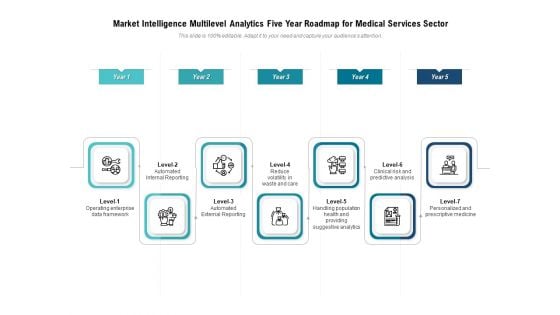
Market Intelligence Multilevel Analytics Five Year Roadmap For Medical Services Sector Introduction
We present our market intelligence multilevel analytics five year roadmap for medical services sector introduction. This PowerPoint layout is easy to edit so you can change the font size, font type, color, and shape conveniently. In addition to this, the PowerPoint layout is Google Slides compatible, so you can share it with your audience and give them access to edit it. Therefore, download and save this well researched market intelligence multilevel analytics five year roadmap for medical services sector introduction in different formats like PDF, PNG, and JPG to smoothly execute your business plan.
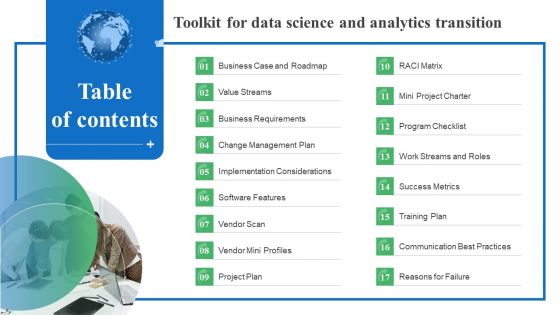
Table Of Contenst Toolkit For Data Science And Analytics Transition Professional PDF
Here you can discover an assortment of the finest PowerPoint and Google Slides templates. With these templates, you can create presentations for a variety of purposes while simultaneously providing your audience with an eye catching visual experience. Download Table Of Contenst Toolkit For Data Science And Analytics Transition Professional PDF to deliver an impeccable presentation. These templates will make your job of preparing presentations much quicker, yet still, maintain a high level of quality. Slidegeeks has experienced researchers who prepare these templates and write high quality content for you. Later on, you can personalize the content by editing the Table Of Contenst Toolkit For Data Science And Analytics Transition Professional PDF.

Mobile App Analytics Company Fund Raising Pitch Deck Ppt Powerpoint Presentation Complete Deck With Slides
This presentation deck enables you to communicate the message,idea,and proposal to your audience in a clear and effective manner. The slides of this PowerPoint Bundle are professional and visually appealing,engaging your audience and gaining their heartful interest in your content. In addition to its spectacular design,this PPT deck is easy to use and altered to fit the specific needs of the user. All thirty seven slides in this set are compatible with multiple data handling and presentation platforms like Google Slides,MS Excel,Tableau,etc.,so you can present your information hassle free. Begin your journey to tremendous success using our Mobile App Analytics Company Fund Raising Pitch Deck Ppt Powerpoint Presentation Complete Deck With Slides in many settings,including meetings,pitches,and conference presentations In fact,customer testimonials. Our Mobile App Analytics Company Fund Raising Pitch Deck Ppt Powerpoint Presentation Complete Deck With Slides are topically designed to provide an attractive backdrop to any subject. Use them to look like a presentation pro.
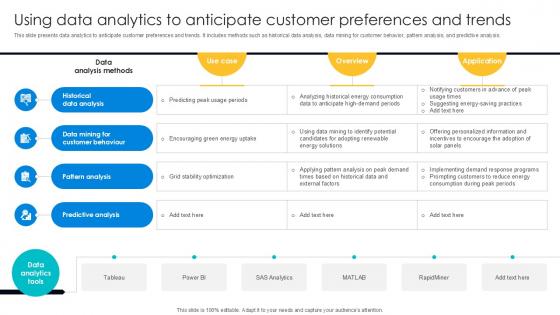
Using Data Analytics To Anticipate Digital Transformation Journey PPT PowerPoint DT SS V
This slide presents data analytics to anticipate customer preferences and trends. It includes methods such as historical data analysis, data mining for customer behavior, pattern analysis, and predictive analysis. Here you can discover an assortment of the finest PowerPoint and Google Slides templates. With these templates, you can create presentations for a variety of purposes while simultaneously providing your audience with an eye-catching visual experience. Download Historical Data Analysis, Data Mining For Customer Behaviour, Pattern Analysis to deliver an impeccable presentation. These templates will make your job of preparing presentations much quicker, yet still, maintain a high level of quality. Slidegeeks has experienced researchers who prepare these templates and write high-quality content for you. Later on, you can personalize the content by editing the Historical Data Analysis, Data Mining For Customer Behaviour, Pattern Analysis. This slide presents data analytics to anticipate customer preferences and trends. It includes methods such as historical data analysis, data mining for customer behavior, pattern analysis, and predictive analysis.
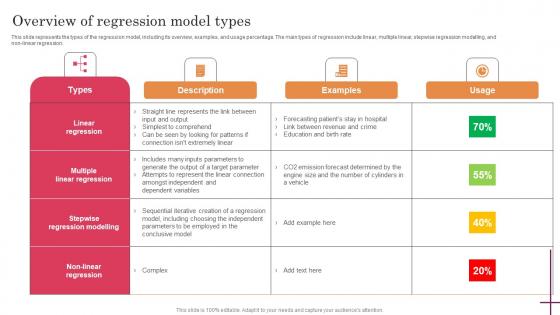
Overview Of Regression Model Types Predictive Analytics For Improved Mockup Pdf
This slide represents the types of the regression model, including its overview, examples, and usage percentage. The main types of regression include linear, multiple linear, stepwise regression modelling, and non-linear regression. Are you in need of a template that can accommodate all of your creative concepts This one is crafted professionally and can be altered to fit any style. Use it with Google Slides or PowerPoint. Include striking photographs, symbols, depictions, and other visuals. Fill, move around, or remove text boxes as desired. Test out color palettes and font mixtures. Edit and save your work, or work with colleagues. Download Overview Of Regression Model Types Predictive Analytics For Improved Mockup Pdf and observe how to make your presentation outstanding. Give an impeccable presentation to your group and make your presentation unforgettable. This slide represents the types of the regression model, including its overview, examples, and usage percentage. The main types of regression include linear, multiple linear, stepwise regression modelling, and non-linear regression.
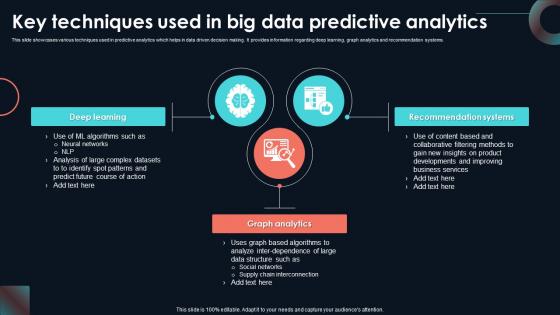
Key Techniques Used In Big Data Predictive Developing Strategic Insights Using Big Data Analytics SS V
This slide showcases various techniques used in predictive analytics which helps in data driven decision making. It provides information regarding deep learning, graph analytics and recommendation systems. Are you in need of a template that can accommodate all of your creative concepts This one is crafted professionally and can be altered to fit any style. Use it with Google Slides or PowerPoint. Include striking photographs, symbols, depictions, and other visuals. Fill, move around, or remove text boxes as desired. Test out color palettes and font mixtures. Edit and save your work, or work with colleagues. Download Key Techniques Used In Big Data Predictive Developing Strategic Insights Using Big Data Analytics SS V and observe how to make your presentation outstanding. Give an impeccable presentation to your group and make your presentation unforgettable. This slide showcases various techniques used in predictive analytics which helps in data driven decision making. It provides information regarding deep learning, graph analytics and recommendation systems.
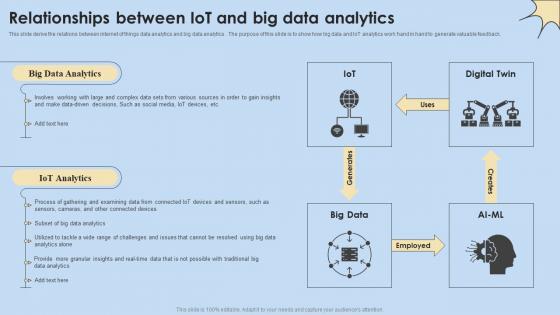
Relationships Between IoT And Big Data Analytics Internet Of Things Analysis Slides Pdf
This slide derive the relations between internet of things data analytics and big data analytics . The purpose of this slide is to show how big data and IoT analytics work hand in hand to generate valuable feedback. Here you can discover an assortment of the finest PowerPoint and Google Slides templates. With these templates, you can create presentations for a variety of purposes while simultaneously providing your audience with an eye-catching visual experience. Download Relationships Between IoT And Big Data Analytics Internet Of Things Analysis Slides Pdf to deliver an impeccable presentation. These templates will make your job of preparing presentations much quicker, yet still, maintain a high level of quality. Slidegeeks has experienced researchers who prepare these templates and write high-quality content for you. Later on, you can personalize the content by editing the Relationships Between IoT And Big Data Analytics Internet Of Things Analysis Slides Pdf. This slide derive the relations between internet of things data analytics and big data analytics . The purpose of this slide is to show how big data and IoT analytics work hand in hand to generate valuable feedback.
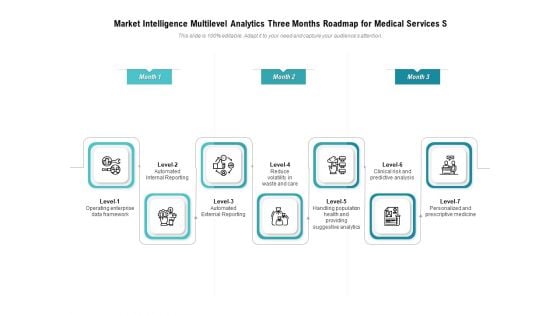
Market Intelligence Multilevel Analytics Three Months Roadmap For Medical Services Structure
Presenting our jaw dropping market intelligence multilevel analytics three months roadmap for medical services structure. You can alternate the color, font size, font type, and shapes of this PPT layout according to your strategic process. This PPT presentation is compatible with Google Slides and is available in both standard screen and widescreen aspect ratios. You can also download this well researched PowerPoint template design in different formats like PDF, JPG, and PNG. So utilize this visually appealing design by clicking the download button given below.
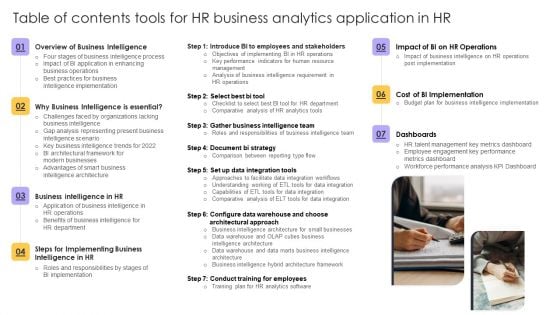
Table Of Contents Tools For HR Business Analytics Application In HR Ppt Ideas Gridlines PDF
Do you know about Slidesgeeks Table Of Contents Tools For HR Business Analytics Application In HR Ppt Ideas Gridlines PDF These are perfect for delivering any kind od presentation. Using it, create PowerPoint presentations that communicate your ideas and engage audiences. Save time and effort by using our pre-designed presentation templates that are perfect for a wide range of topic. Our vast selection of designs covers a range of styles, from creative to business, and are all highly customizable and easy to edit. Download as a PowerPoint template or use them as Google Slides themes.
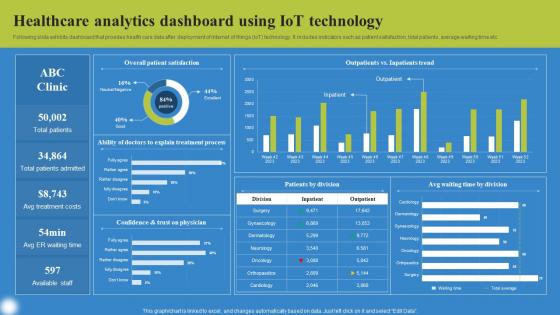
Healthcare Analytics Dashboard Using Deploying IoT Solutions For Enhanced Healthcare Background Pdf
Following slide exhibits dashboard that provides health care data after deployment of internet of things IoT technology. It includes indicators such as patient satisfaction, total patients, average waiting time etc. Do you know about Slidesgeeks Healthcare Analytics Dashboard Using Deploying IoT Solutions For Enhanced Healthcare Background Pdf These are perfect for delivering any kind od presentation. Using it, create PowerPoint presentations that communicate your ideas and engage audiences. Save time and effort by using our pre designed presentation templates that are perfect for a wide range of topic. Our vast selection of designs covers a range of styles, from creative to business, and are all highly customizable and easy to edit. Download as a PowerPoint template or use them as Google Slides themes. Following slide exhibits dashboard that provides health care data after deployment of internet of things IoT technology. It includes indicators such as patient satisfaction, total patients, average waiting time etc.
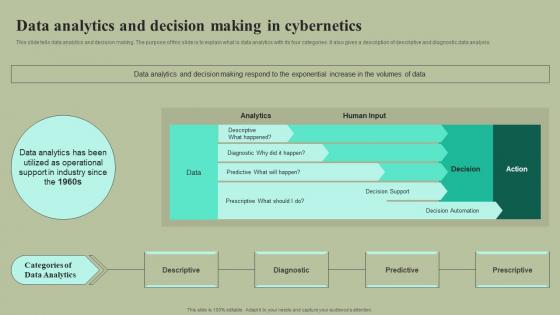
Data Analytics And Decision Making In Cybernetics Cybernetic Integration Inspiration Pdf
This slide tells data analytics and decision making. The purpose of this slide is to explain what is data analytics with its four categories. It also gives a description of descriptive and diagnostic data analysis. Here you can discover an assortment of the finest PowerPoint and Google Slides templates. With these templates, you can create presentations for a variety of purposes while simultaneously providing your audience with an eye-catching visual experience. Download Data Analytics And Decision Making In Cybernetics Cybernetic Integration Inspiration Pdf to deliver an impeccable presentation. These templates will make your job of preparing presentations much quicker, yet still, maintain a high level of quality. Slidegeeks has experienced researchers who prepare these templates and write high-quality content for you. Later on, you can personalize the content by editing the Data Analytics And Decision Making In Cybernetics Cybernetic Integration Inspiration Pdf This slide tells data analytics and decision making. The purpose of this slide is to explain what is data analytics with its four categories. It also gives a description of descriptive and diagnostic data analysis.
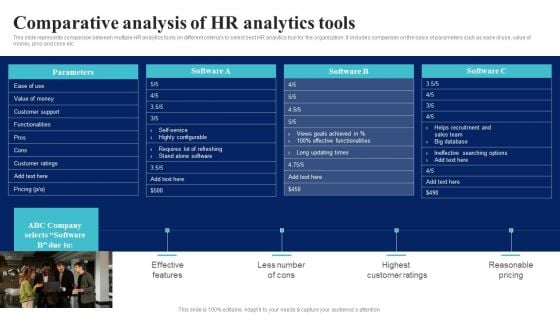
BI Implementation To Enhance Hiring Process Comparative Analysis Of Hr Analytics Tools Rules PDF
This slide represents comparison between multiple HR analytics tools on different criterias to select best HR analytics tool for the organization. It includes comparison on the basis of parameters such as ease of use, value of money, pros and cons etc.If you are looking for a format to display your unique thoughts, then the professionally designed BI Implementation To Enhance Hiring Process Comparative Analysis Of Hr Analytics Tools Rules PDF is the one for you. You can use it as a Google Slides template or a PowerPoint template. Incorporate impressive visuals, symbols, images, and other charts. Modify or reorganize the text boxes as you desire. Experiment with shade schemes and font pairings. Alter, share or cooperate with other people on your work. Download BI Implementation To Enhance Hiring Process Comparative Analysis Of Hr Analytics Tools Rules PDF and find out how to give a successful presentation. Present a perfect display to your team and make your presentation unforgettable.
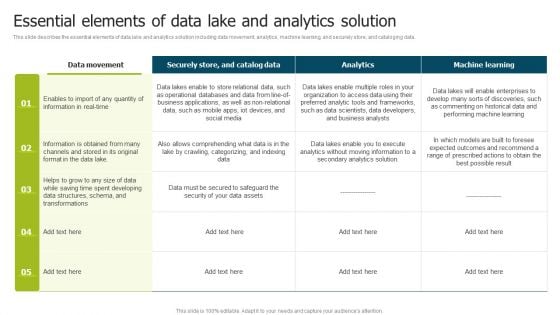
Data Lake Implementation Essential Elements Of Data Lake And Analytics Solution Brochure PDF
This slide describes the essential elements of data lake and analytics solution including data movement, analytics, machine learning, and securely store, and cataloging data. If you are looking for a format to display your unique thoughts, then the professionally designed Data Lake Implementation Essential Elements Of Data Lake And Analytics Solution Brochure PDF is the one for you. You can use it as a Google Slides template or a PowerPoint template. Incorporate impressive visuals, symbols, images, and other charts. Modify or reorganize the text boxes as you desire. Experiment with shade schemes and font pairings. Alter, share or cooperate with other people on your work. Download Data Lake Implementation Essential Elements Of Data Lake And Analytics Solution Brochure PDF and find out how to give a successful presentation. Present a perfect display to your team and make your presentation unforgettable.
Marketing Success Metrics Introduction To Email Analytics For Tracking Sample PDF
This slide covers an email analytics overview to identify how subscribers interact with your email campaigns. It also includes steps to email analytics, such as checking kpis regularly, reflecting on numbers, refining customer profiles, building better lead-generation campaigns, etc. Here you can discover an assortment of the finest PowerPoint and Google Slides templates. With these templates, you can create presentations for a variety of purposes while simultaneously providing your audience with an eye-catching visual experience. Download Marketing Success Metrics Introduction To Email Analytics For Tracking Sample PDF to deliver an impeccable presentation. These templates will make your job of preparing presentations much quicker, yet still, maintain a high level of quality. Slidegeeks has experienced researchers who prepare these templates and write high-quality content for you. Later on, you can personalize the content by editing the Marketing Success Metrics Introduction To Email Analytics For Tracking Sample PDF.

Projection Model Difference Between Four Types Of Advanced Analytics Portrait PDF
This slide represents the difference between the main types of advanced analytics, and it includes diagnostic, descriptive, predictive, and prescriptive analytics. The four major categories of advanced analytics share certain commonalities but are distinguished mostly by their distinctions. Are you in need of a template that can accommodate all of your creative concepts This one is crafted professionally and can be altered to fit any style. Use it with Google Slides or PowerPoint. Include striking photographs, symbols, depictions, and other visuals. Fill, move around, or remove text boxes as desired. Test out color palettes and font mixtures. Edit and save your work, or work with colleagues. Download Projection Model Difference Between Four Types Of Advanced Analytics Portrait PDF and observe how to make your presentation outstanding. Give an impeccable presentation to your group and make your presentation unforgettable.
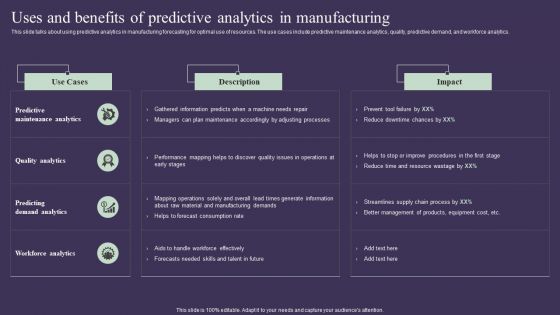
Projection Model Uses And Benefits Of Predictive Analytics In Manufacturing Topics PDF
This slide talks about using predictive analytics in manufacturing forecasting for optimal use of resources. The use cases include predictive maintenance analytics, quality, predictive demand, and workforce analytics. Are you in need of a template that can accommodate all of your creative concepts This one is crafted professionally and can be altered to fit any style. Use it with Google Slides or PowerPoint. Include striking photographs, symbols, depictions, and other visuals. Fill, move around, or remove text boxes as desired. Test out color palettes and font mixtures. Edit and save your work, or work with colleagues. Download Projection Model Uses And Benefits Of Predictive Analytics In Manufacturing Topics PDF and observe how to make your presentation outstanding. Give an impeccable presentation to your group and make your presentation unforgettable.
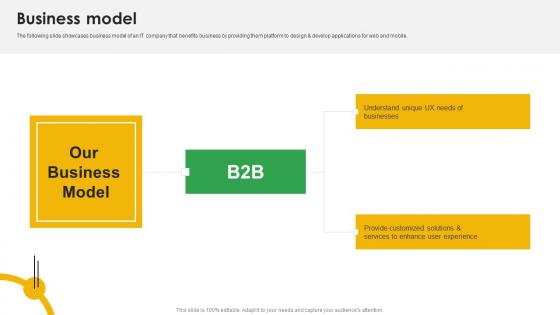
Business Model Mobile App Analytics Company Fund Raising Pitch Deck Formats Pdf
The following slide showcases business model of an IT company that benefits business by providing them platform to design and develop applications for web and mobile. Retrieve professionally designed Business Model Mobile App Analytics Company Fund Raising Pitch Deck Formats Pdf to effectively convey your message and captivate your listeners. Save time by selecting pre made slideshows that are appropriate for various topics, from business to educational purposes. These themes come in many different styles, from creative to corporate, and all of them are easily adjustable and can be edited quickly. Access them as PowerPoint templates or as Google Slides themes. You do not have to go on a hunt for the perfect presentation because Slidegeeks got you covered from everywhere. The following slide showcases business model of an IT company that benefits business by providing them platform to design and develop applications for web and mobile.
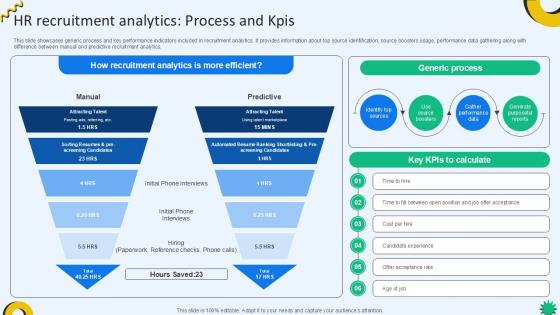
HR Recruitment Analytics Process And KPIs Cloud Recruiting Technologies PPT Sample
This slide showcases generic process and key performance indicators included in recruitment analytics. It provides information about top source identification, source boosters usage, performance data gathering along with difference between manual and predictive recruitment analytics. If you are looking for a format to display your unique thoughts, then the professionally designed HR Recruitment Analytics Process And KPIs Cloud Recruiting Technologies PPT Sample is the one for you. You can use it as a Google Slides template or a PowerPoint template. Incorporate impressive visuals, symbols, images, and other charts. Modify or reorganize the text boxes as you desire. Experiment with shade schemes and font pairings. Alter, share or cooperate with other people on your work. Download HR Recruitment Analytics Process And KPIs Cloud Recruiting Technologies PPT Sample and find out how to give a successful presentation. Present a perfect display to your team and make your presentation unforgettable. This slide showcases generic process and key performance indicators included in recruitment analytics. It provides information about top source identification, source boosters usage, performance data gathering along with difference between manual and predictive recruitment analytics.

HR Recruitment Analytics Process And KPIs Enhancing Recruitment Process PPT PowerPoint
This slide showcases generic process and key performance indicators included in recruitment analytics. It provides information about top source identification, source boosters usage, performance data gathering along with difference between manual and predictive recruitment analytics. If you are looking for a format to display your unique thoughts, then the professionally designed HR Recruitment Analytics Process And KPIs Enhancing Recruitment Process PPT PowerPoint is the one for you. You can use it as a Google Slides template or a PowerPoint template. Incorporate impressive visuals, symbols, images, and other charts. Modify or reorganize the text boxes as you desire. Experiment with shade schemes and font pairings. Alter, share or cooperate with other people on your work. Download HR Recruitment Analytics Process And KPIs Enhancing Recruitment Process PPT PowerPoint and find out how to give a successful presentation. Present a perfect display to your team and make your presentation unforgettable. This slide showcases generic process and key performance indicators included in recruitment analytics. It provides information about top source identification, source boosters usage, performance data gathering along with difference between manual and predictive recruitment analytics.
BI Technique For Data Informed Decisions Global Market Landscape Of Sap Analytics Cloud Suite Icons PDF
The purpose of this slide is to showcase the global market landscape of SAP analytics cloud as BI tool. It also contains information regarding the business intelligence BI software market share and SAP analytics cloud customers by industry. Are you in need of a template that can accommodate all of your creative concepts This one is crafted professionally and can be altered to fit any style. Use it with Google Slides or PowerPoint. Include striking photographs, symbols, depictions, and other visuals. Fill, move around, or remove text boxes as desired. Test out color palettes and font mixtures. Edit and save your work, or work with colleagues. Download BI Technique For Data Informed Decisions Global Market Landscape Of Sap Analytics Cloud Suite Icons PDF and observe how to make your presentation outstanding. Give an impeccable presentation to your group and make your presentation unforgettable.
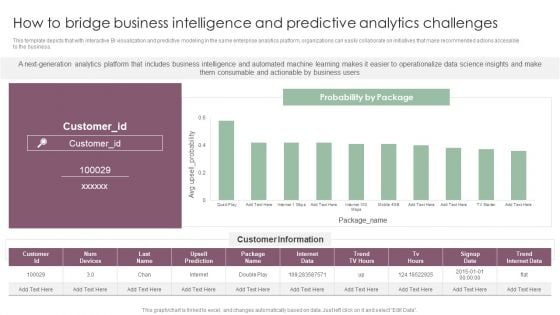
How To Bridge Business Intelligence And Predictive Analytics Challenges Mockup PDF
This template depicts that with interactive BI visualization and predictive modeling in the same enterprise analytics platform, organizations can easily collaborate on initiatives that make recommended actions accessible to the business. If you are looking for a format to display your unique thoughts, then the professionally designed How To Bridge Business Intelligence And Predictive Analytics Challenges Mockup PDF is the one for you. You can use it as a Google Slides template or a PowerPoint template. Incorporate impressive visuals, symbols, images, and other charts. Modify or reorganize the text boxes as you desire. Experiment with shade schemes and font pairings. Alter, share or cooperate with other people on your work. Download How To Bridge Business Intelligence And Predictive Analytics Challenges Mockup PDF and find out how to give a successful presentation. Present a perfect display to your team and make your presentation unforgettable.
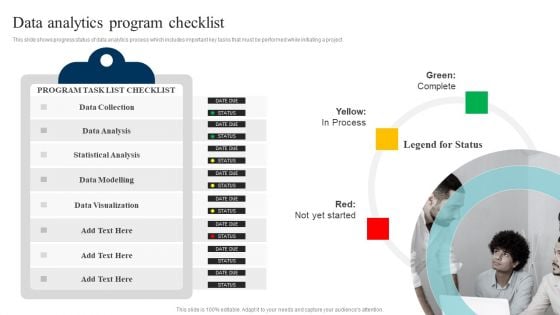
Data Evaluation And Processing Toolkit Data Analytics Program Checklist Inspiration PDF
This slide shows progress status of data analytics process which includes important key tasks that must be performed while initiating a project. If you are looking for a format to display your unique thoughts, then the professionally designed Data Evaluation And Processing Toolkit Data Analytics Program Checklist Inspiration PDF is the one for you. You can use it as a Google Slides template or a PowerPoint template. Incorporate impressive visuals, symbols, images, and other charts. Modify or reorganize the text boxes as you desire. Experiment with shade schemes and font pairings. Alter, share or cooperate with other people on your work. Download Data Evaluation And Processing Toolkit Data Analytics Program Checklist Inspiration PDF and find out how to give a successful presentation. Present a perfect display to your team and make your presentation unforgettable.
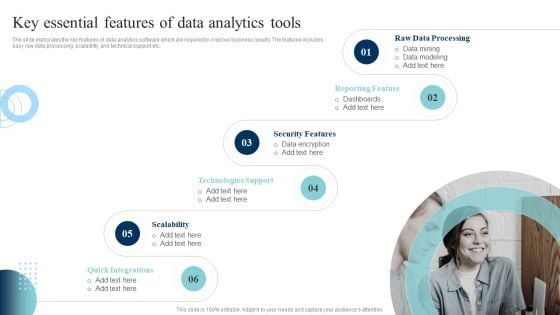
Data Evaluation And Processing Toolkit Key Essential Features Of Data Analytics Tools Inspiration PDF
The slide elaborates the key features of data analytics software which are required to improve business results. The features includes easy raw data processing, scalability, and technical support etc. Here you can discover an assortment of the finest PowerPoint and Google Slides templates. With these templates, you can create presentations for a variety of purposes while simultaneously providing your audience with an eye-catching visual experience. Download Data Evaluation And Processing Toolkit Key Essential Features Of Data Analytics Tools Inspiration PDF to deliver an impeccable presentation. These templates will make your job of preparing presentations much quicker, yet still, maintain a high level of quality. Slidegeeks has experienced researchers who prepare these templates and write high-quality content for you. Later on, you can personalize the content by editing the Data Evaluation And Processing Toolkit Key Essential Features Of Data Analytics Tools Inspiration PDF.
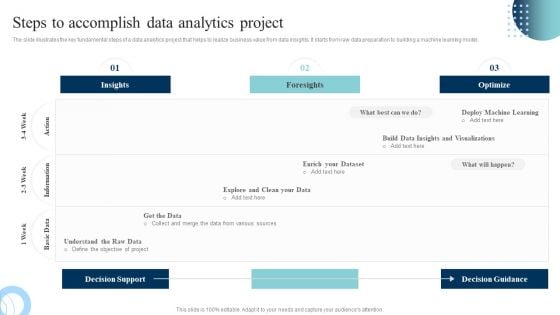
Data Evaluation And Processing Toolkit Steps To Accomplish Data Analytics Project Structure PDF
The slide illustrates the key fundamental steps of a data analytics project that helps to realize business value from data insights. It starts from raw data preparation to building a machine learning model. If you are looking for a format to display your unique thoughts, then the professionally designed Data Evaluation And Processing Toolkit Steps To Accomplish Data Analytics Project Structure PDF is the one for you. You can use it as a Google Slides template or a PowerPoint template. Incorporate impressive visuals, symbols, images, and other charts. Modify or reorganize the text boxes as you desire. Experiment with shade schemes and font pairings. Alter, share or cooperate with other people on your work. Download Data Evaluation And Processing Toolkit Steps To Accomplish Data Analytics Project Structure PDF and find out how to give a successful presentation. Present a perfect display to your team and make your presentation unforgettable.

Data Evaluation And Processing Toolkit Work Streams For Data Analytics With Its Roles Themes PDF
This slide shows the work streams structure with team head for implementing the data analytics project. Here you can discover an assortment of the finest PowerPoint and Google Slides templates. With these templates, you can create presentations for a variety of purposes while simultaneously providing your audience with an eye-catching visual experience. Download Data Evaluation And Processing Toolkit Work Streams For Data Analytics With Its Roles Themes PDF to deliver an impeccable presentation. These templates will make your job of preparing presentations much quicker, yet still, maintain a high level of quality. Slidegeeks has experienced researchers who prepare these templates and write high-quality content for you. Later on, you can personalize the content by editing the Data Evaluation And Processing Toolkit Work Streams For Data Analytics With Its Roles Themes PDF.


 Continue with Email

 Home
Home


