Governance Dashboard
Market Leader Ppt PowerPoint Presentation Icon Maker
This is a market leader ppt powerpoint presentation icon maker. This is a three stage process. The stages in this process are market leader, agenda, planning, business, management.
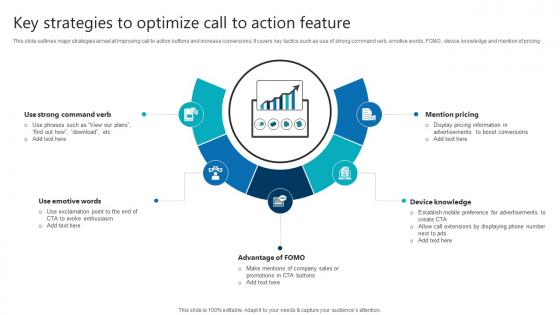
Key Strategies To Optimize Call To Action Feature Product Analytics Implementation Data Analytics V
This slide outlines major strategies aimed at improving call to action buttons and increase conversions. It covers key tactics such as use of strong command verb, emotive words, FOMO, device knowledge and mention of pricing Boost your pitch with our creative Key Strategies To Optimize Call To Action Feature Product Analytics Implementation Data Analytics V. Deliver an awe-inspiring pitch that will mesmerize everyone. Using these presentation templates you will surely catch everyones attention. You can browse the ppts collection on our website. We have researchers who are experts at creating the right content for the templates. So you do not have to invest time in any additional work. Just grab the template now and use them. This slide outlines major strategies aimed at improving call to action buttons and increase conversions. It covers key tactics such as use of strong command verb, emotive words, FOMO, device knowledge and mention of pricing
Vulnerability Management Process Business Accounting Venture Capital Availability Ppt PowerPoint Presentation Icon Graphics
This is a vulnerability management process business accounting venture capital availability ppt powerpoint presentation icon graphics. This is a two stage process. The stages in this process are vulnerability management process, business accounting, venture capital availability.
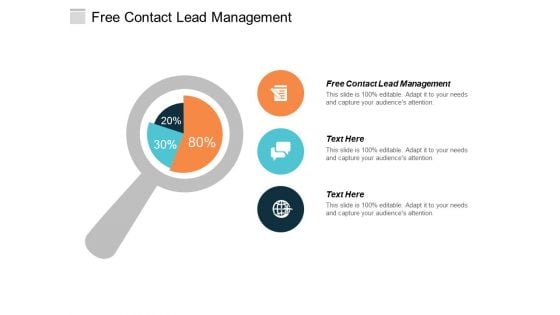
Free Contact Lead Management Ppt Powerpoint Presentation Inspiration Graphic Tips Cpb
This is a free contact lead management ppt powerpoint presentation inspiration graphic tips cpb. This is a three stage process. The stages in this process are free contact lead management.
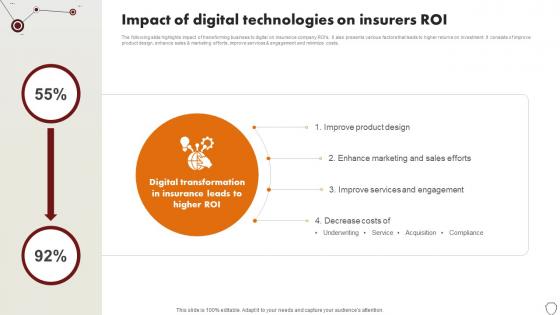
Technology Trends In Online Insurance Impact Of Digital Technologies On Insurers Roi
The following slide highlights impact of transforming business to digital on insurance company ROIs. It also presents various factors that leads to higher returns on investment. It consists of improve product design, enhance sales and marketing efforts, improve services and engagement and minimize costs. Are you searching for a Technology Trends In Online Insurance Impact Of Digital Technologies On Insurers Roi that is uncluttered, straightforward, and original Its easy to edit, and you can change the colors to suit your personal or business branding. For a presentation that expresses how much effort you have put in, this template is ideal With all of its features, including tables, diagrams, statistics, and lists, its perfect for a business plan presentation. Make your ideas more appealing with these professional slides. Download Technology Trends In Online Insurance Impact Of Digital Technologies On Insurers Roi from Slidegeeks today. The following slide highlights impact of transforming business to digital on insurance company ROIs. It also presents various factors that leads to higher returns on investment. It consists of improve product design, enhance sales and marketing efforts, improve services and engagement and minimize costs.

Techniques To Monitor Transactions Tms And Data Analytics Process Flow Topics PDF
This slide represents transaction monitoring system process flow. It provides information about data analytics, risk framework, alerting, ad hoc analysis, case management, external source entrance, stop list, politically exposed persons PEP, watch list, etc. There are so many reasons you need a Techniques To Monitor Transactions Tms And Data Analytics Process Flow Topics PDF. The first reason is you cant spend time making everything from scratch, Thus, Slidegeeks has made presentation templates for you too. You can easily download these templates from our website easily.
Logistics Manager Checking Goods At Warehouse Vector Icon Ppt PowerPoint Presentation File Designs Download PDF
Presenting this set of slides with name logistics manager checking goods at warehouse vector icon ppt powerpoint presentation file designs download pdf. This is a three stage process. The stages in this process are logistics manager checking goods at warehouse vector icon. This is a completely editable PowerPoint presentation and is available for immediate download. Download now and impress your audience.
Business Diagram Three Text Boxes For Timer For Time Management PowerPoint Slide
This business diagram displays three text boxes. This diagram contains text boxes for data representation. Use this diagram to display business process workflows in any presentations.
Magnifying Glass For Customer Management Skills Ppt Slides
This is a magnifying glass for customer management skills ppt slides. This is a five stage process. The stages in this process are icons, marketing, magnifying glass, communication, business, strategy.
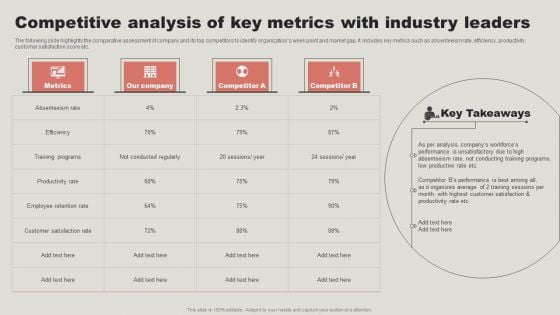
Competitive Analysis Of Key Metrics With Industry Leaders Structure PDF
The following slide highlights the comparative assessment of company and its top competitors to identify organizations week point and market gap. It includes key metrics such as absenteeism rate, efficiency, productivity, customer satisfaction score etc. Here you can discover an assortment of the finest PowerPoint and Google Slides templates. With these templates, you can create presentations for a variety of purposes while simultaneously providing your audience with an eye catching visual experience. Download Competitive Analysis Of Key Metrics With Industry Leaders Structure PDF to deliver an impeccable presentation. These templates will make your job of preparing presentations much quicker, yet still, maintain a high level of quality. Slidegeeks has experienced researchers who prepare these templates and write high quality content for you. Later on, you can personalize the content by editing the Competitive Analysis Of Key Metrics With Industry Leaders Structure PDF.
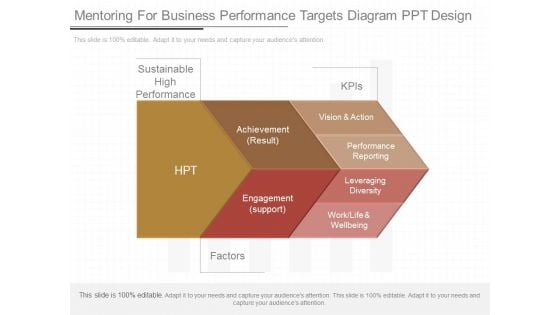
Mentoring For Business Performance Targets Diagram Ppt Design
This is a mentoring for business performance targets diagram ppt design. This is a three stage process. The stages in this process are sustainable high performance, kpis, hpt, achievement result, engagement support, factors, vision and action, performance reporting, leveraging diversity, work life and wellbeing.
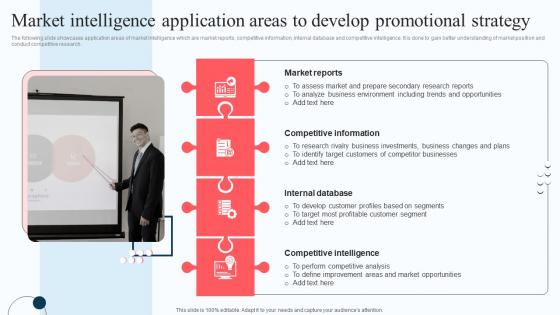
Market Intelligence Application Areas To Develop Execution Of Strategic Intelligence Professional PDF
The following slide showcases application areas of market intelligence which are market reports, competitive information, internal database and competitive intelligence. It is done to gain better understanding of market position and conduct competitive research. Do you have an important presentation coming up Are you looking for something that will make your presentation stand out from the rest Look no further than Market Intelligence Application Areas To Develop Execution Of Strategic Intelligence Professional PDF. With our professional designs, you can trust that your presentation will pop and make delivering it a smooth process. And with Slidegeeks, you can trust that your presentation will be unique and memorable. So why wait Grab Market Intelligence Application Areas To Develop Execution Of Strategic Intelligence Professional PDF today and make your presentation stand out from the rest The following slide showcases application areas of market intelligence which are market reports, competitive information, internal database and competitive intelligence. It is done to gain better understanding of market position and conduct competitive research.
Managing Portfolio Of Growth Options Icons Slide Ppt Infographics Example Topics PDF
Presenting this set of slides containing editable icons for topic managing portfolio of growth options icons slide ppt infographics example topics pdf. All icons in this slide are 100 percent editable. You can replace icons in your deck with any of these icons. Download now and impress your audience.
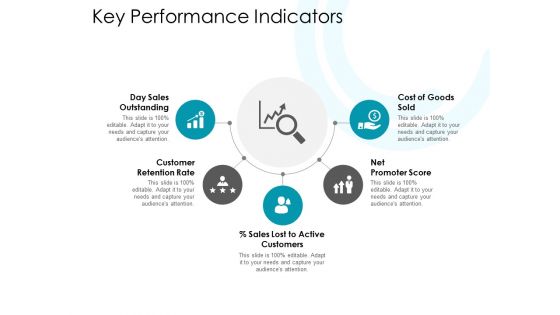
Key Performance Indicators Ppt PowerPoint Presentation Outline Samples
Presenting this set of slides with name key performance indicators ppt powerpoint presentation outline samples. This is a five stage process. The stages in this process are business, management, planning, strategy, marketing. This is a completely editable PowerPoint presentation and is available for immediate download. Download now and impress your audience.
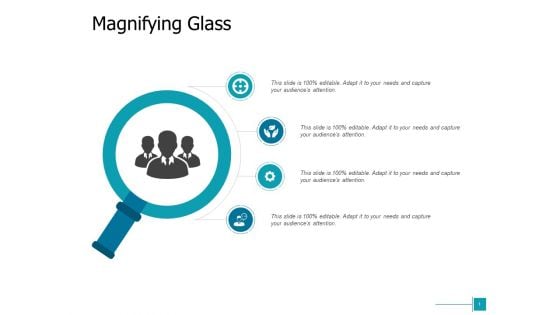
Magnifying Glass Testing Management Ppt Powerpoint Presentation Layouts File Formats
Presenting this set of slides with name magnifying glass testing management ppt powerpoint presentation layouts file formats. This is a four stage process. The stages in this process are magnifying glass, research, marketing, strategy, business. This is a completely editable PowerPoint presentation and is available for immediate download. Download now and impress your audience.
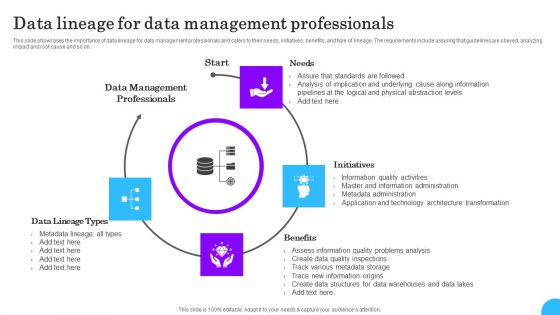
Comprehensive Analysis Of Different Data Lineage Classification Data Lineage For Data Management Download PDF
This slide showcases the importance of data lineage for data management professionals and caters to their needs, initiatives, benefits, and type of lineage. The requirements include assuring that guidelines are obeyed, analyzing impact and root cause and so on. Crafting an eye-catching presentation has never been more straightforward. Let your presentation shine with this tasteful yet straightforward Comprehensive Analysis Of Different Data Lineage Classification Data Lineage For Data Management Download PDF template. It offers a minimalistic and classy look that is great for making a statement. The colors have been employed intelligently to add a bit of playfulness while still remaining professional. Construct the ideal Comprehensive Analysis Of Different Data Lineage Classification Data Lineage For Data Management Download PDF that effortlessly grabs the attention of your audience Begin now and be certain to wow your customers
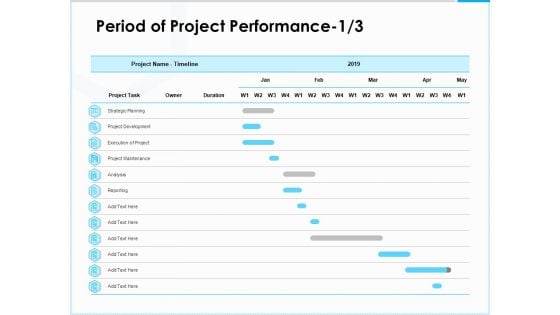
Project Budget Period Of Project Performance Timeline Ppt PowerPoint Presentation Infographic Template Aids PDF
Deliver an awe-inspiring pitch with this creative project budget period of project performance timeline ppt powerpoint presentation infographic template aids pdf bundle. Topics like strategic planning, project development, analysis, project execution, data maintenance, reporting can be discussed with this completely editable template. It is available for immediate download depending on the needs and requirements of the user.
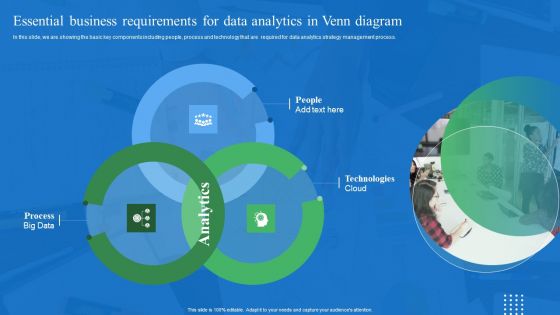
Essential Business Requirements For Data Analytics In Venn Diagram Introduction PDF
In this slide, we are showing the basic key components including people, process and technology that are required for data analytics strategy management process. Here you can discover an assortment of the finest PowerPoint and Google Slides templates. With these templates, you can create presentations for a variety of purposes while simultaneously providing your audience with an eye catching visual experience. Download Essential Business Requirements For Data Analytics In Venn Diagram Introduction PDF to deliver an impeccable presentation. These templates will make your job of preparing presentations much quicker, yet still, maintain a high level of quality. Slidegeeks has experienced researchers who prepare these templates and write high quality content for you. Later on, you can personalize the content by editing the Essential Business Requirements For Data Analytics In Venn Diagram Introduction PDF.
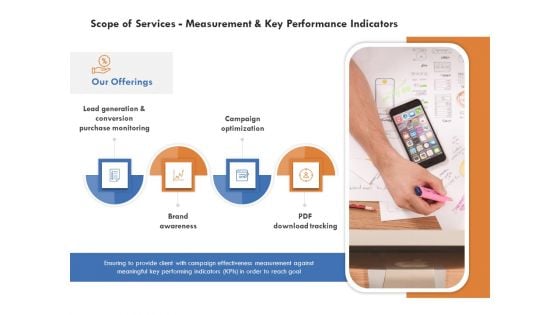
Scope Of Services Measurement And Key Performance Indicators Information PDF
Presenting this set of slides with name scope of services measurement and key performance indicators information pdf. This is a four stage process. The stages in this process are lead generation and conversion purchase monitoring, brand awareness, campaign optimization, pdf download tracking. This is a completely editable PowerPoint presentation and is available for immediate download. Download now and impress your audience.
Pharmaceutical Marketing Strategies Key Performance Indicators Icons PDF
Presenting pharmaceutical marketing strategies key performance indicators icons pdf to provide visual cues and insights. Share and navigate important information on three stages that need your due attention. This template can be used to pitch topics like organizational readiness, market readiness, launch success. In addtion, this PPT design contains high resolution images, graphics, etc, that are easily editable and available for immediate download.
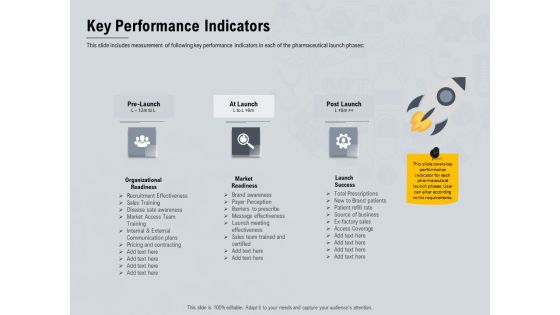
Healthcare Merchandising Key Performance Indicators Ppt Portfolio Maker PDF
Presenting healthcare merchandising key performance indicators ppt portfolio maker pdf to provide visual cues and insights. Share and navigate important information on three stages that need your due attention. This template can be used to pitch topics like organizational readiness, market readiness, launch success. In addtion, this PPT design contains high resolution images, graphics, etc, that are easily editable and available for immediate download.
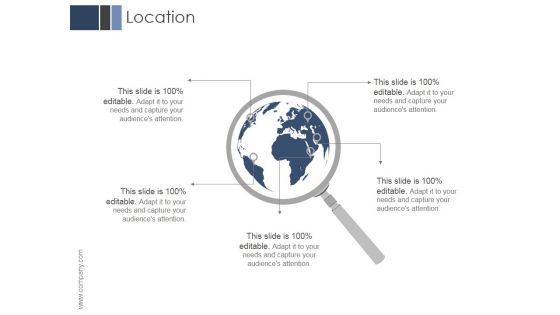
Location Ppt PowerPoint Presentation Model
This is a location ppt powerpoint presentation model. This is a five stage process. The stages in this process are business, marketing, management, location, magnifier glass.
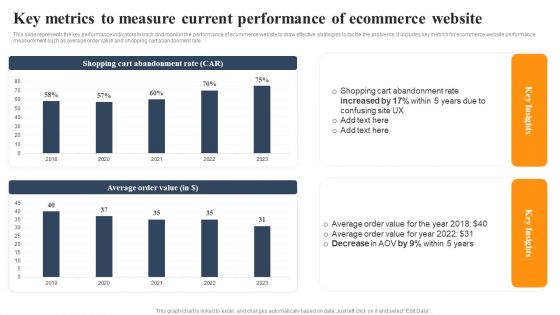
Implementing An Effective Ecommerce Management Framework Key Metrics Current Performance Of Ecommerce Website Slides PDF
This slide represents the key performance indicators to track and monitor the performance of ecommerce website to draw effective strategies to tackle the problems. It includes key metrics for ecommerce website performance measurement such as average order value and shopping cart abandonment rate. The Implementing An Effective Ecommerce Management Framework Key Metrics Current Performance Of Ecommerce Website Slides PDF is a compilation of the most recent design trends as a series of slides. It is suitable for any subject or industry presentation, containing attractive visuals and photo spots for businesses to clearly express their messages. This template contains a variety of slides for the user to input data, such as structures to contrast two elements, bullet points, and slides for written information. Slidegeeks is prepared to create an impression.
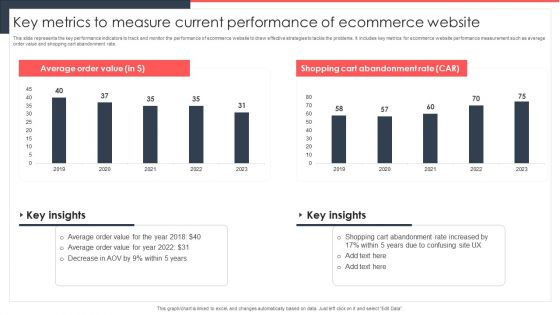
Implementing Management System To Enhance Ecommerce Processes Key Metrics To Measure Current Performance Themes PDF
This slide represents the key performance indicators to track and monitor the performance of ecommerce website to draw effective strategies to tackle the problems. It includes key metrics for ecommerce website performance measurement such as average order value and shopping cart abandonment rate. Do you know about Slidesgeeks Implementing Management System To Enhance Ecommerce Processes Key Metrics To Measure Current Performance Themes PDF. These are perfect for delivering any kind od presentation. Using it, create PowerPoint presentations that communicate your ideas and engage audiences. Save time and effort by using our pre designed presentation templates that are perfect for a wide range of topic. Our vast selection of designs covers a range of styles, from creative to business, and are all highly customizable and easy to edit. Download as a PowerPoint template or use them as Google Slides themes.
Financial Management And Research Vector Icon Ppt PowerPoint Presentation Styles Outfit PDF
Presenting this set of slides with name financial management and research vector icon ppt powerpoint presentation styles outfit pdf. This is a two stage process. The stages in this process are financial management and research vector icon. This is a completely editable PowerPoint presentation and is available for immediate download. Download now and impress your audience.

Inventory Management System With Qr Code And Magnifying Glass Ppt PowerPoint Presentation Gallery Example File PDF
Presenting this set of slides with name inventory management system with qr code and magnifying glass ppt powerpoint presentation gallery example file pdf. This is a three stage process. The stages in this process are inventory management system with qr code and magnifying glass. This is a completely editable PowerPoint presentation and is available for immediate download. Download now and impress your audience.
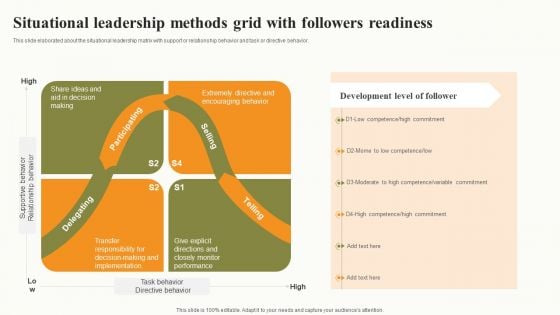
Situational Leadership Methods Grid With Followers Readiness Infographics PDF
This slide elaborated about the situational leadership matrix with support or relationship behavior and task or directive behavior. Persuade your audience using this Situational Leadership Methods Grid With Followers Readiness Infographics PDF. This PPT design covers four stages, thus making it a great tool to use. It also caters to a variety of topics including Performance, Implementation, Situational Leadership Methods Grid. Download this PPT design now to present a convincing pitch that not only emphasizes the topic but also showcases your presentation skills.

Company Key Performance Indicators Table Sample Of Ppt
This is a company key performance indicators table sample of ppt. This is a ten stage process. The stages in this process are business, marketing, management.
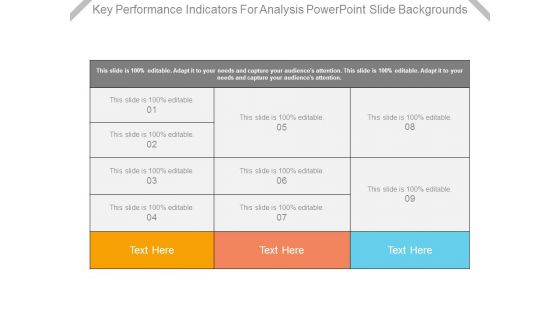
Key Performance Indicators For Analysis Powerpoint Slide Backgrounds
This is a key performance indicators for analysis powerpoint slide backgrounds. This is a nine stage process. The stages in this process are business, marketing, management.

Sustainability Waste Management Key Performance Indicators Resources Recycling And Waste Management Background PDF
This slide covers the KPIs for three years such as processes, transportation, energy used, renewable energy generated and energy saving. Deliver an awe inspiring pitch with this creative sustainability waste management key performance indicators resources recycling and waste management background pdf bundle. Topics like sustainability waste management key performance indicators can be discussed with this completely editable template. It is available for immediate download depending on the needs and requirements of the user.

API Management For Building Software Applications Magnifying Glass Ppt PowerPoint Presentation Professional Smartart PDF
Presenting this set of slides with name api management for building software applications magnifying glass ppt powerpoint presentation professional smartart pdf. This is a one stage process. The stage in this process is magnifying glass. This is a completely editable PowerPoint presentation and is available for immediate download. Download now and impress your audience.
Managing Agriculture Land And Water Magnifying Glass Ppt Portfolio Clipart PDF
Presenting this set of slides with name managing agriculture land and water magnifying glass ppt portfolio clipart pdf. This is a three stage process. The stages in this process are magnifying glass. This is a completely editable PowerPoint presentation and is available for immediate download. Download now and impress your audience.
How To Effectively Manage A Construction Project Magnifying Glass Demonstration PDF
Presenting how to effectively manage a construction project magnifying glass demonstration pdf. to provide visual cues and insights. Share and navigate important information on three stages that need your due attention. This template can be used to pitch topics like magnifying glass. In addtion, this PPT design contains high resolution images, graphics, etc, that are easily editable and available for immediate download.
Eight Stages Of Pie Chart Data Interpretation Business Plan PowerPoint Slides
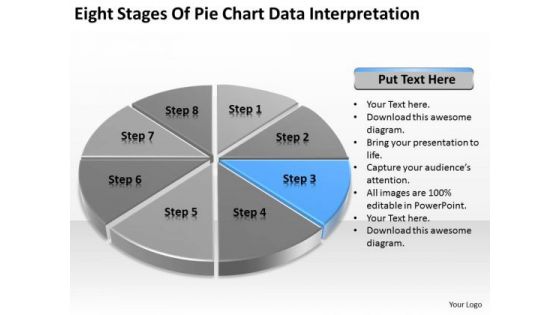
We present our eight stages of pie chart data interpretation business plan PowerPoint Slides.Use our Competition PowerPoint Templates because Our PowerPoint Templates and Slides will let you Clearly mark the path for others to follow. Download and present our Marketing PowerPoint Templates because Our PowerPoint Templates and Slides will weave a web of your great ideas. They are gauranteed to attract even the most critical of your colleagues. Present our Arrows PowerPoint Templates because Our PowerPoint Templates and Slides will let you Hit the target. Go the full distance with ease and elan. Use our Circle Charts PowerPoint Templates because You have gained great respect for your brilliant ideas. Use our PowerPoint Templates and Slides to strengthen and enhance your reputation. Download our Business PowerPoint Templates because You are an avid believer in ethical practices. Highlight the benefits that accrue with our PowerPoint Templates and Slides.Use these PowerPoint slides for presentations relating to chart, graph, pie, 3d, diagram, graphic, icon, control, business, data, profit, market, sales, display, corporate, concept, render, success, presentation, finance, report, marketing, accounting, management, piece, strategy, money, growth, company, competition, progress, account, sheet, part, information, investment, improvement, banking, index, financial, reflect, results, performance, exchange. The prominent colors used in the PowerPoint template are Blue, Black, Gray. Great presentations happen with our Eight Stages Of Pie Chart Data Interpretation Business Plan PowerPoint Slides. Try us out and see what a difference our templates make.
Eight Stages Of Pie Chart Data Interpretation Business Plan PowerPoint Templates
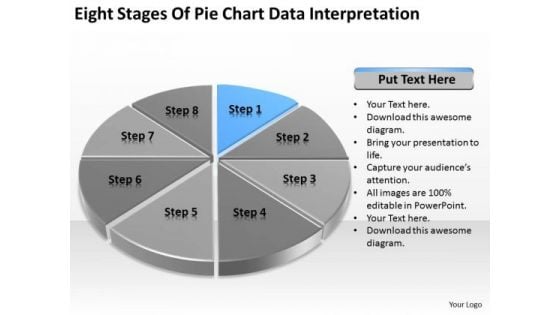
We present our eight stages of pie chart data interpretation business plan PowerPoint templates.Download and present our Competition PowerPoint Templates because Our PowerPoint Templates and Slides will embellish your thoughts. See them provide the desired motivation to your team. Download and present our Marketing PowerPoint Templates because You should Press the right buttons with our PowerPoint Templates and Slides. They will take your ideas down the perfect channel. Download our Arrows PowerPoint Templates because Your ideas provide food for thought. Our PowerPoint Templates and Slides will help you create a dish to tickle the most discerning palate. Use our Circle Charts PowerPoint Templates because You can Raise a toast with our PowerPoint Templates and Slides. Spread good cheer amongst your audience. Download and present our Business PowerPoint Templates because Our PowerPoint Templates and Slides will let your ideas bloom. Create a bed of roses for your audience.Use these PowerPoint slides for presentations relating to chart, graph, pie, 3d, diagram, graphic, icon, control, business, data, profit, market, sales, display, corporate, concept, render, success, presentation, finance, report, marketing, accounting, management, piece, strategy, money, growth, company, competition, progress, account, sheet, part, information, investment, improvement, banking, index, financial, reflect, results, performance, exchange. The prominent colors used in the PowerPoint template are Blue, Black, Gray. Our Eight Stages Of Pie Chart Data Interpretation Business Plan PowerPoint Templates capture the attention of your audience. With our money back guarantee you have nothing to lose.
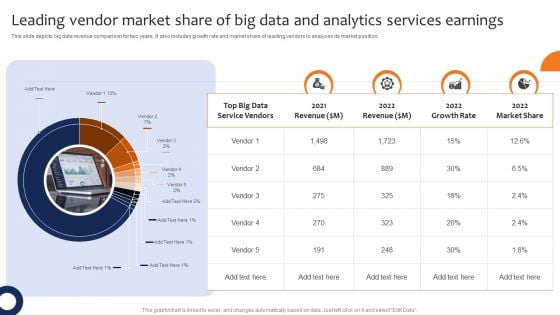
Leading Vendor Market Share Of Big Data And Analytics Services Earnings Professional PDF
This slide depicts big data revenue comparison for two years. It also includes growth rate and market share of leading vendors to analyses its market position. Pitch your topic with ease and precision using this Leading Vendor Market Share Of Big Data And Analytics Services Earnings Professional PDF. This layout presents information on Revenue, Growth Rate, Market Share. It is also available for immediate download and adjustment. So, changes can be made in the color, design, graphics or any other component to create a unique layout.
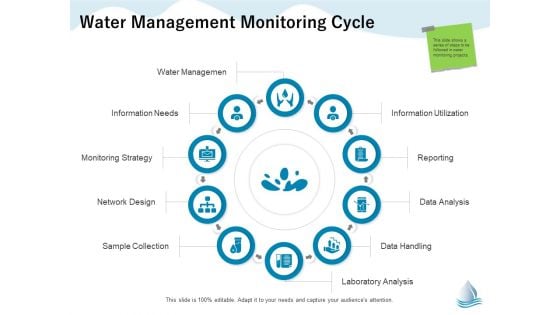
Underground Aquifer Supervision Water Management Monitoring Cycle Portrait PDF
Presenting this set of slides with name underground aquifer supervision water management monitoring cycle portrait pdf. This is a ten stage process. The stages in this process are reporting, data analysis, monitoring strategy network design, data handling. This is a completely editable PowerPoint presentation and is available for immediate download. Download now and impress your audience.
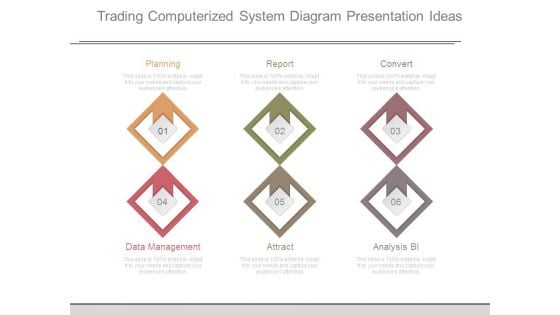
Trading Computerized System Diagram Presentation Ideas
This is a trading computerized system diagram presentation ideas. This is a six stage process. The stages in this process are planning, report, convert, data management, attract, analysis bi.

Enterprise Leaders Technique To Achieve Market Control Tips To Sustain Current Position By Market Leaders Template PDF
This slide mentions certain tips that can be implemented by market leaders to retain their position within industry and grow further in terms of market share. It include innovating constantly, focusing on customer experience, investing in branding, monitoring market trends, building strong team and fostering innovative culture. Find highly impressive Enterprise Leaders Technique To Achieve Market Control Tips To Sustain Current Position By Market Leaders Template PDF on Slidegeeks to deliver a meaningful presentation. You can save an ample amount of time using these presentation templates. No need to worry to prepare everything from scratch because Slidegeeks experts have already done a huge research and work for you. You need to download Enterprise Leaders Technique To Achieve Market Control Tips To Sustain Current Position By Market Leaders Template PDF for your upcoming presentation. All the presentation templates are 100 percent editable and you can change the color and personalize the content accordingly. Download now.
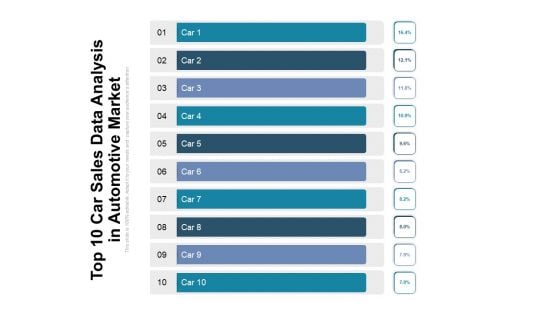
Top 10 Car Sales Data Analysis In Automotive Market Ppt PowerPoint Presentation Gallery Background Images PDF
Presenting this set of slides with name top 10 car sales data analysis in automotive market ppt powerpoint presentation gallery background images pdf. This is a ten stage process. The stages in this process are top 10 car sales data analysis in automotive market. This is a completely editable PowerPoint presentation and is available for immediate download. Download now and impress your audience.
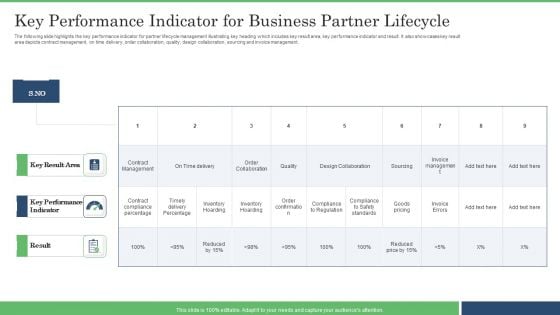
Key Performance Indicator For Business Partner Lifecycle Brochure PDF
The following slide highlights the key performance indicator for partner lifecycle management illustrating key heading which includes key result area, key performance indicator and result. It also showcases key result area depicts contract management, on time delivery, order collaboration, quality, design collaboration, sourcing and invoice management. Showcasing this set of slides titled Key Performance Indicator For Business Partner Lifecycle Brochure PDF. The topics addressed in these templates are Key Performance Indicator, Inventory Hoarding, Design Collaboration. All the content presented in this PPT design is completely editable. Download it and make adjustments in color, background, font etc. as per your unique business setting.
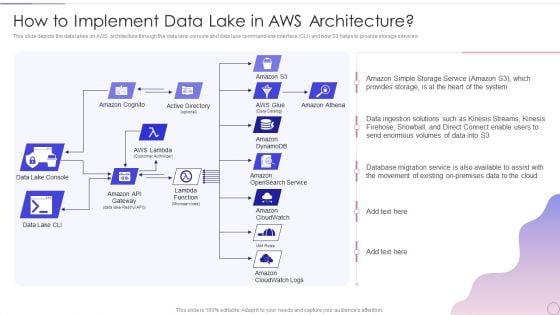
Data Lake Architecture Future Of Data Analysis How To Implement Data Lake In AWS Architecture Information PDF
This slide depicts the data lakes on AWS architecture through the data lake console and data lake command-line interface CLI and how S3 helps to provide storage services.Deliver and pitch your topic in the best possible manner with this Data Lake Architecture Future Of Data Analysis How To Implement Data Lake In AWS Architecture Information PDF. Use them to share invaluable insights on Database Migration, Movement Of Existing, Enormous Volumes and impress your audience. This template can be altered and modified as per your expectations. So, grab it now.
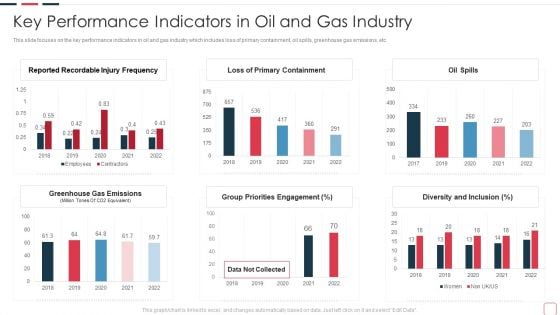
Price Benefit Internet Things Digital Twins Execution After Covid Key Performance Indicators In Oil Slides PDF
This slide focuses on the key performance indicators in oil and gas industry which includes loss of primary containment, oil spills, greenhouse gas emissions, etc. Deliver an awe inspiring pitch with this creative price benefit internet things digital twins execution after covid key performance indicators in oil slides pdf bundle. Topics like key performance indicators in oil and gas industry can be discussed with this completely editable template. It is available for immediate download depending on the needs and requirements of the user.
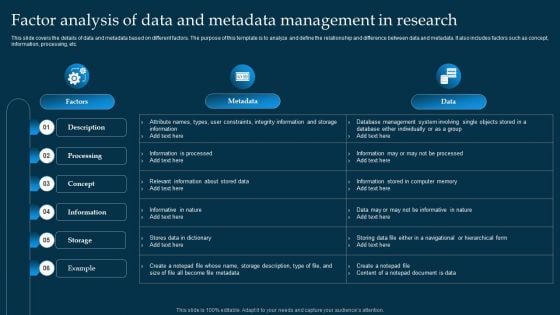
Factor Analysis Of Data And Metadata Management In Research Clipart PDF
This slide covers the details of data and metadata based on different factors. The purpose of this template is to analyze and define the relationship and difference between data and metadata. It also includes factors such as concept, information, processing, etc. Showcasing this set of slides titled Factor Analysis Of Data And Metadata Management In Research Clipart PDF. The topics addressed in these templates are Description, Processing, Concept, Information. All the content presented in this PPT design is completely editable. Download it and make adjustments in color, background, font etc. as per your unique business setting.
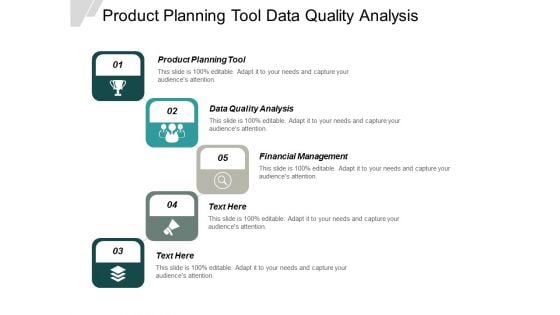
Product Planning Tool Data Quality Analysis Financial Management Ppt PowerPoint Presentation Styles Graphics Template
This is a product planning tool data quality analysis financial management ppt powerpoint presentation styles graphics template. This is a five stage process. The stages in this process are product planning tool, data quality analysis, financial management.
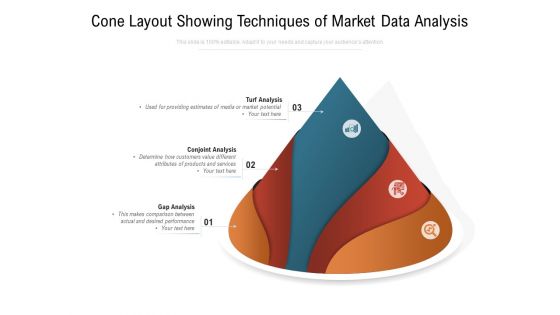
Cone Layout Showing Techniques Of Market Data Analysis Ppt PowerPoint Presentation Summary Infographics PDF
Presenting this set of slides with name cone layout showing techniques of market data analysis ppt powerpoint presentation summary infographics pdf. This is a three stage process. The stages in this process are turf analysis, conjoint analysis, gap analysis. This is a completely editable PowerPoint presentation and is available for immediate download. Download now and impress your audience.

Big Data Architect Workflow Of Big Data Management Guidelines PDF
This slide defines the workflow of big data, including data sources, data management, modeling, result analysis, visualization, and user interaction.Deliver an awe inspiring pitch with this creative Big Data Architect Workflow Of Big Data Management Guidelines PDF bundle. Topics like Data Management, Preprocessing, Model Estimation can be discussed with this completely editable template. It is available for immediate download depending on the needs and requirements of the user.
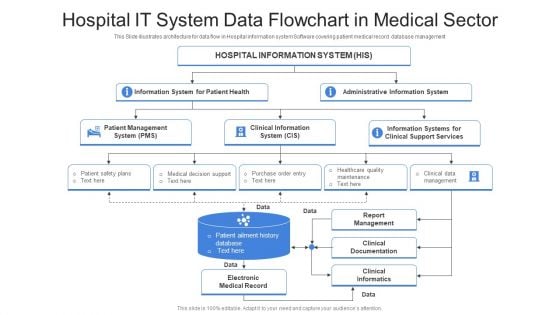
Hospital IT System Data Flowchart In Medical Sector Ppt Layouts Summary PDF
This Slide illustrates architecture for data flow in Hospital information system Software covering patient medical record database management. Showcasing this set of slides titled hospital it system data flowchart in medical sector ppt layouts summary pdf. The topics addressed in these templates are report management, management system, data management. All the content presented in this PPT design is completely editable. Download it and make adjustments in color, background, font etc. as per your unique business setting.
Strategic Financial Planning And Administration Tracking The Cashflow Improvements Cash Themes PDF
This slide showcases the KPIs that would help our business organization to track the improvements in the new cash management process. It includes quick ratio, cash balance, current ratio, days inventory outstanding, etc. Slidegeeks is one of the best resources for PowerPoint templates. You can download easily and regulate Strategic Financial Planning And Administration Tracking The Cashflow Improvements Cash Themes PDF for your personal presentations from our wonderful collection. A few clicks is all it takes to discover and get the most relevant and appropriate templates. Use our Templates to add a unique zing and appeal to your presentation and meetings. All the slides are easy to edit and you can use them even for advertisement purposes. This slide showcases the KPIs that would help our business organization to track the improvements in the new cash management process. It includes quick ratio, cash balance, current ratio, days inventory outstanding, etc.
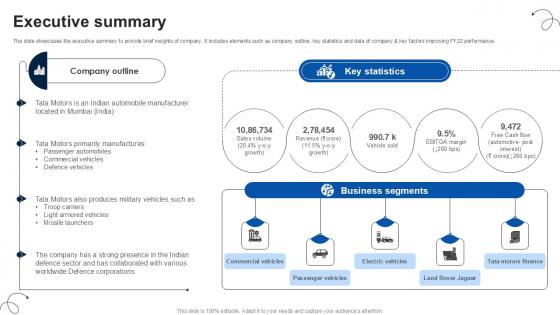
Executive Summary Luxury Automobile Vehicles PPT Example CP SS V
The slide showcases the executive summary to provide brief insights of company. It includes elements such as company outline, key statistics and data of company and key factors improving FY22 performance. Crafting an eye-catching presentation has never been more straightforward. Let your presentation shine with this tasteful yet straightforward Executive Summary Luxury Automobile Vehicles PPT Example CP SS V template. It offers a minimalistic and classy look that is great for making a statement. The colors have been employed intelligently to add a bit of playfulness while still remaining professional. Construct the ideal Executive Summary Luxury Automobile Vehicles PPT Example CP SS V that effortlessly grabs the attention of your audience Begin now and be certain to wow your customers The slide showcases the executive summary to provide brief insights of company. It includes elements such as company outline, key statistics and data of company and key factors improving FY22 performance.
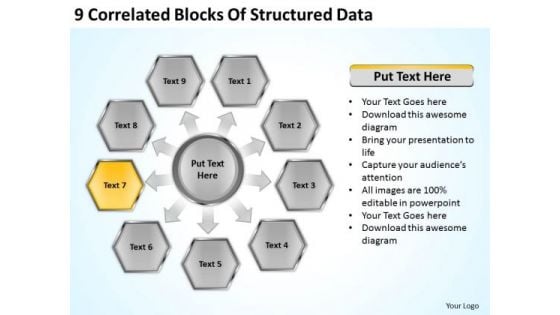
9 Correlated Blocks Of Structured Data Business Financial Planning PowerPoint Templates
We present our 9 correlated blocks of structured data business financial planning PowerPoint templates.Download our Marketing PowerPoint Templates because Our PowerPoint Templates and Slides will fulfill your every need. Use them and effectively satisfy the desires of your audience. Present our Business PowerPoint Templates because Our PowerPoint Templates and Slides team portray an attitude of elegance. Personify this quality by using them regularly. Use our Finance PowerPoint Templates because you can Break through with our PowerPoint Templates and Slides. Bring down the mental barriers of your audience. Use our Process and Flows PowerPoint Templates because Our PowerPoint Templates and Slides will effectively help you save your valuable time. They are readymade to fit into any presentation structure. Present our Arrows PowerPoint Templates because You should Kick up a storm with our PowerPoint Templates and Slides. The heads of your listeners will swirl with your ideas.Use these PowerPoint slides for presentations relating to Diagram, Chart, Business, Background, Vector, Pie, Brown, Abstract, Wheel, Options, Board, Website, Cross, Statistics, Model, Item, Document, Media, Beehives, Red, Hive, Concept, Presentation, Template, Matt, Brochure, Orange, Guide, Description, Multicolor, Marketing, Gray, Development, Title, Management, Honeycomb, Illustration, Six, Catalog, Direction, Plans, Blue, Text, Reports, Financial, Workplace, Navigation, Parts. The prominent colors used in the PowerPoint template are Yellow, Gray, Black. Illustrate the essential elements of the project. Delve into the basic nature with our 9 Correlated Blocks Of Structured Data Business Financial Planning PowerPoint Templates.
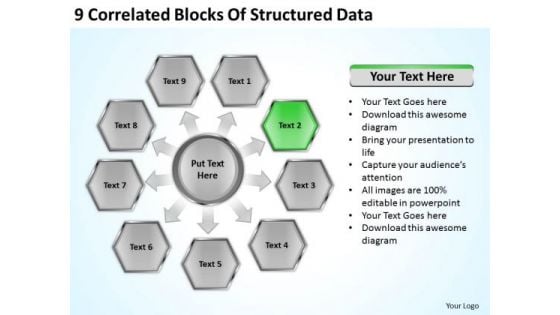
9 Correlated Blocks Of Structured Data Business Plans That Work PowerPoint Templates
We present our 9 correlated blocks of structured data business plans that work PowerPoint templates.Download and present our Marketing PowerPoint Templates because Our PowerPoint Templates and Slides will let you meet your Deadlines. Use our Business PowerPoint Templates because You can Hit the nail on the head with our PowerPoint Templates and Slides. Embed your ideas in the minds of your audience. Present our Finance PowerPoint Templates because Our PowerPoint Templates and Slides are aesthetically designed to attract attention. We gaurantee that they will grab all the eyeballs you need. Use our Process and Flows PowerPoint Templates because You can Be the puppeteer with our PowerPoint Templates and Slides as your strings. Lead your team through the steps of your script. Download and present our Arrows PowerPoint Templates because You canTake a leap off the starting blocks with our PowerPoint Templates and Slides. They will put you ahead of the competition in quick time.Use these PowerPoint slides for presentations relating to Diagram, Chart, Business, Background, Vector, Pie, Brown, Abstract, Wheel, Options, Board, Website, Cross, Statistics, Model, Item, Document, Media, Beehives, Red, Hive, Concept, Presentation, Template, Matt, Brochure, Orange, Guide, Description, Multicolor, Marketing, Gray, Development, Title, Management, Honeycomb, Illustration, Six, Catalog, Direction, Plans, Blue, Text, Reports, Financial, Workplace, Navigation, Parts. The prominent colors used in the PowerPoint template are Green, Gray, Black. Our 9 Correlated Blocks Of Structured Data Business Plans That Work PowerPoint Templates have a feel for it. They automatically create an ambience.
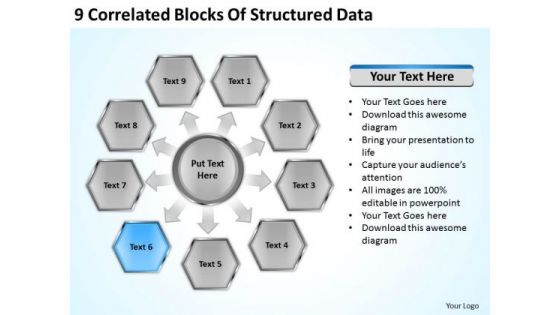
9 Correlated Blocks Of Structured Data Download Business Plans PowerPoint Templates
We present our 9 correlated blocks of structured data download business plans PowerPoint templates.Download our Marketing PowerPoint Templates because Our PowerPoint Templates and Slides are conceived by a dedicated team. Use them and give form to your wondrous ideas. Download our Business PowerPoint Templates because It can Bubble and burst with your ideas. Present our Finance PowerPoint Templates because Our PowerPoint Templates and Slides will let you Hit the right notes. Watch your audience start singing to your tune. Present our Process and Flows PowerPoint Templates because Our PowerPoint Templates and Slides will give good value for money. They also have respect for the value of your time. Download our Arrows PowerPoint Templates because It will let you Set new benchmarks with our PowerPoint Templates and Slides. They will keep your prospects well above par.Use these PowerPoint slides for presentations relating to Diagram, Chart, Business, Background, Vector, Pie, Brown, Abstract, Wheel, Options, Board, Website, Cross, Statistics, Model, Item, Document, Media, Beehives, Red, Hive, Concept, Presentation, Template, Matt, Brochure, Orange, Guide, Description, Multicolor, Marketing, Gray, Development, Title, Management, Honeycomb, Illustration, Six, Catalog, Direction, Plans, Blue, Text, Reports, Financial, Workplace, Navigation, Parts. The prominent colors used in the PowerPoint template are Blue, Gray, Black. Decrease wastage with our 9 Correlated Blocks Of Structured Data Download Business Plans PowerPoint Templates. Download without worries with our money back guaranteee.
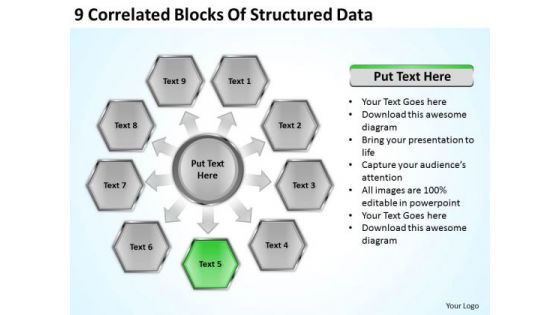
9 Correlated Blocks Of Structured Data How To Present Business Plan PowerPoint Slides
We present our 9 correlated blocks of structured data how to present business plan PowerPoint Slides.Download our Marketing PowerPoint Templates because Our PowerPoint Templates and Slides are focused like a searchlight beam. They highlight your ideas for your target audience. Use our Business PowerPoint Templates because You can Stir your ideas in the cauldron of our PowerPoint Templates and Slides. Cast a magic spell on your audience. Use our Finance PowerPoint Templates because You can Rise to the occasion with our PowerPoint Templates and Slides. You will bring your audience on their feet in no time. Present our Process and Flows PowerPoint Templates because Our PowerPoint Templates and Slides are innately eco-friendly. Their high recall value negate the need for paper handouts. Use our Arrows PowerPoint Templates because our PowerPoint Templates and Slides will give your ideas the shape.Use these PowerPoint slides for presentations relating to Diagram, Chart, Business, Background, Vector, Pie, Brown, Abstract, Wheel, Options, Board, Website, Cross, Statistics, Model, Item, Document, Media, Beehives, Red, Hive, Concept, Presentation, Template, Matt, Brochure, Orange, Guide, Description, Multicolor, Marketing, Gray, Development, Title, Management, Honeycomb, Illustration, Six, Catalog, Direction, Plans, Blue, Text, Reports, Financial, Workplace, Navigation, Parts. The prominent colors used in the PowerPoint template are Green, Gray, Black. Begin with a bang with our 9 Correlated Blocks Of Structured Data How To Present Business Plan PowerPoint Slides. Explode off the blocks with your thoughts.
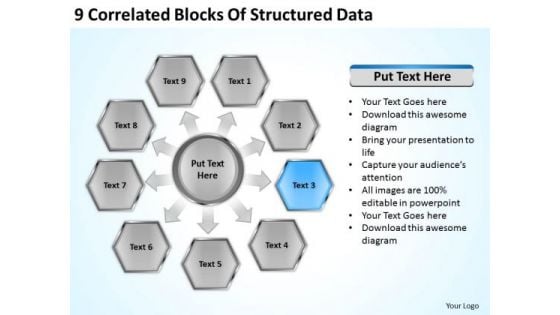
9 Correlated Blocks Of Structured Data Ppt Business Plan PowerPoint Slides
We present our 9 correlated blocks of structured data ppt business plan PowerPoint Slides.Download our Marketing PowerPoint Templates because You aspire to touch the sky with glory. Let our PowerPoint Templates and Slides provide the fuel for your ascent. Download our Business PowerPoint Templates because our PowerPoint Templates and Slides will give your ideas the shape. Download our Finance PowerPoint Templates because Our PowerPoint Templates and Slides offer you the widest possible range of options. Present our Process and Flows PowerPoint Templates because our PowerPoint Templates and Slides will give your ideas the shape. Download our Arrows PowerPoint Templates because you can Break through with our PowerPoint Templates and Slides. Bring down the mental barriers of your audience.Use these PowerPoint slides for presentations relating to Diagram, Chart, Business, Background, Vector, Pie, Brown, Abstract, Wheel, Options, Board, Website, Cross, Statistics, Model, Item, Document, Media, Beehives, Red, Hive, Concept, Presentation, Template, Matt, Brochure, Orange, Guide, Description, Multicolor, Marketing, Gray, Development, Title, Management, Honeycomb, Illustration, Six, Catalog, Direction, Plans, Blue, Text, Reports, Financial, Workplace, Navigation, Parts. The prominent colors used in the PowerPoint template are Blue, Gray, Black. Get rid of the fat with our 9 Correlated Blocks Of Structured Data Ppt Business Plan PowerPoint Slides. Get to the meat with your thoughts.
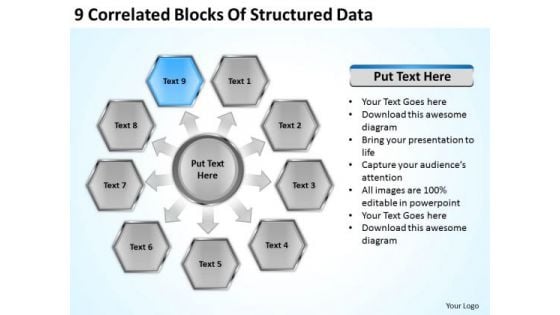
9 Correlated Blocks Of Structured Data Ppt Business Plan PowerPoint Templates
We present our 9 correlated blocks of structured data ppt business plan PowerPoint templates.Use our Marketing PowerPoint Templates because Our PowerPoint Templates and Slides provide you with a vast range of viable options. Select the appropriate ones and just fill in your text. Download our Business PowerPoint Templates because It is Aesthetically crafted by artistic young minds. Our PowerPoint Templates and Slides are designed to display your dexterity. Download and present our Finance PowerPoint Templates because Our PowerPoint Templates and Slides will definately Enhance the stature of your presentation. Adorn the beauty of your thoughts with their colourful backgrounds. Present our Process and Flows PowerPoint Templates because Our PowerPoint Templates and Slides come in all colours, shades and hues. They help highlight every nuance of your views. Download and present our Arrows PowerPoint Templates because Our PowerPoint Templates and Slides will effectively help you save your valuable time. They are readymade to fit into any presentation structure. Use these PowerPoint slides for presentations relating to Diagram, Chart, Business, Background, Vector, Pie, Brown, Abstract, Wheel, Options, Board, Website, Cross, Statistics, Model, Item, Document, Media, Beehives, Red, Hive, Concept, Presentation, Template, Matt, Brochure, Orange, Guide, Description, Multicolor, Marketing, Gray, Development, Title, Management, Honeycomb, Illustration, Six, Catalog, Direction, Plans, Blue, Text, Reports, Financial, Workplace, Navigation, Parts. The prominent colors used in the PowerPoint template are Blue, Gray, Black. Our 9 Correlated Blocks Of Structured Data Ppt Business Plan PowerPoint Templates stay away from farce. They treat every event correctly.
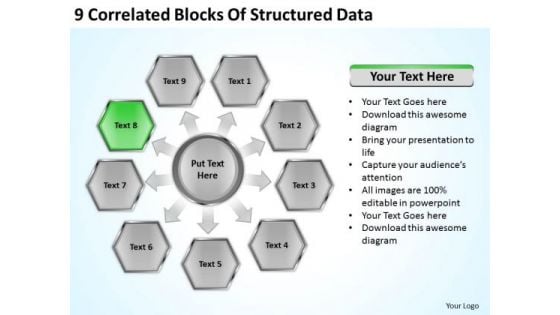
9 Correlated Blocks Of Structured Data Ppt Hotel Business Plan Example PowerPoint Slides
We present our 9 correlated blocks of structured data ppt hotel business plan example PowerPoint Slides.Present our Marketing PowerPoint Templates because Your ideas provide food for thought. Our PowerPoint Templates and Slides will help you create a dish to tickle the most discerning palate. Download our Business PowerPoint Templates because You can Stir your ideas in the cauldron of our PowerPoint Templates and Slides. Cast a magic spell on your audience. Present our Finance PowerPoint Templates because You can Create a matrix with our PowerPoint Templates and Slides. Feel the strength of your ideas click into place. Use our Process and Flows PowerPoint Templates because It can be used to Set your controls for the heart of the sun. Our PowerPoint Templates and Slides will be the propellant to get you there. Present our Arrows PowerPoint Templates because You canTake a leap off the starting blocks with our PowerPoint Templates and Slides. They will put you ahead of the competition in quick time.Use these PowerPoint slides for presentations relating to Diagram, Chart, Business, Background, Vector, Pie, Brown, Abstract, Wheel, Options, Board, Website, Cross, Statistics, Model, Item, Document, Media, Beehives, Red, Hive, Concept, Presentation, Template, Matt, Brochure, Orange, Guide, Description, Multicolor, Marketing, Gray, Development, Title, Management, Honeycomb, Illustration, Six, Catalog, Direction, Plans, Blue, Text, Reports, Financial, Workplace, Navigation, Parts. The prominent colors used in the PowerPoint template are Green, Gray, Black. Burst through the ceiling with our 9 Correlated Blocks Of Structured Data Ppt Hotel Business Plan Example PowerPoint Slides. Rise strongly above created barriers.
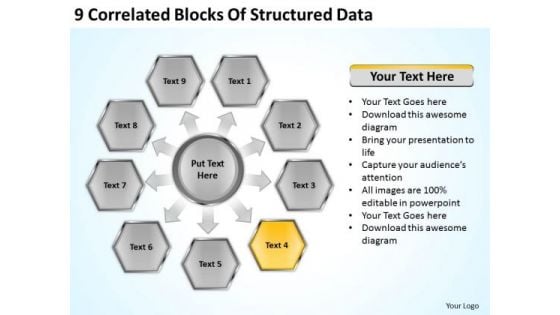
9 Correlated Blocks Of Structured Data Ppt Sales Business Plan Outline PowerPoint Templates
We present our 9 correlated blocks of structured data ppt sales business plan outline PowerPoint templates.Download our Marketing PowerPoint Templates because Our PowerPoint Templates and Slides will let you meet your Deadlines. Download and present our Business PowerPoint Templates because You can Hit the nail on the head with our PowerPoint Templates and Slides. Embed your ideas in the minds of your audience. Download and present our Finance PowerPoint Templates because Our PowerPoint Templates and Slides are a sure bet. Gauranteed to win against all odds. Download and present our Process and Flows PowerPoint Templates because Our PowerPoint Templates and Slides will bullet point your ideas. See them fall into place one by one. Use our Arrows PowerPoint Templates because Our PowerPoint Templates and Slides will let your ideas bloom. Create a bed of roses for your audience.Use these PowerPoint slides for presentations relating to Diagram, Chart, Business, Background, Vector, Pie, Brown, Abstract, Wheel, Options, Board, Website, Cross, Statistics, Model, Item, Document, Media, Beehives, Red, Hive, Concept, Presentation, Template, Matt, Brochure, Orange, Guide, Description, Multicolor, Marketing, Gray, Development, Title, Management, Honeycomb, Illustration, Six, Catalog, Direction, Plans, Blue, Text, Reports, Financial, Workplace, Navigation, Parts. The prominent colors used in the PowerPoint template are Yellow, Gray, Black. Color your presentation with success with our 9 Correlated Blocks Of Structured Data Ppt Sales Business Plan Outline PowerPoint Templates. You will come out on top.
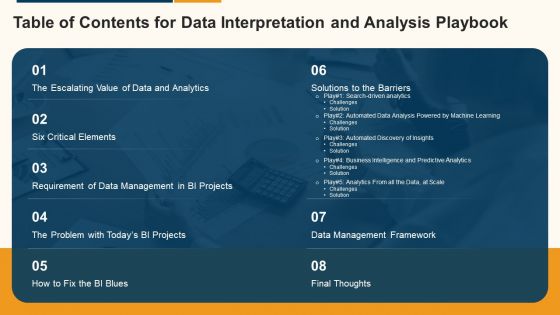
Data Interpretation And Analysis Playbook Table Of Contents For Data Interpretation And Analysis Playbook Rules PDF
Deliver an awe inspiring pitch with this creative data interpretation and analysis playbook table of contents for data interpretation and analysis playbook rules pdf bundle. Topics like six critical elements, data management framework, solutions to the barriers, data management in bi projects, final thoughts can be discussed with this completely editable template. It is available for immediate download depending on the needs and requirements of the user.
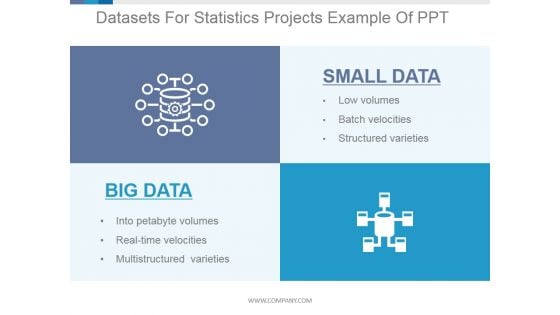
Datasets For Statistics Projects Ppt PowerPoint Presentation Tips
This is a datasets for statistics projects ppt powerpoint presentation tips. This is a two stage process. The stages in this process are small data, big data, low volumes, into petabyte volumes, batch velocities, real time velocities.


 Continue with Email

 Home
Home


