Graph Icon
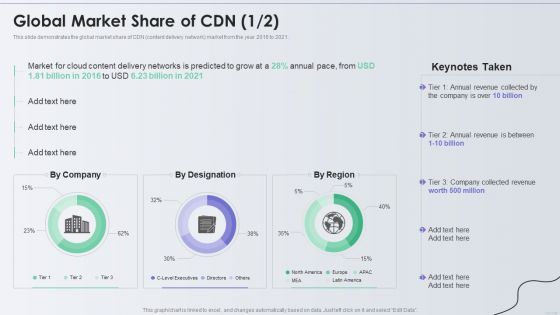
Distribution Network Global Market Share Of CDN Diagrams PDF
This slide demonstrates the global market share of CDN content delivery network market from the year 2016 to 2021. Deliver an awe inspiring pitch with this creative Distribution Network Global Market Share Of CDN Diagrams PDF bundle. Topics like Annual Revenue, Global Market Share can be discussed with this completely editable template. It is available for immediate download depending on the needs and requirements of the user.
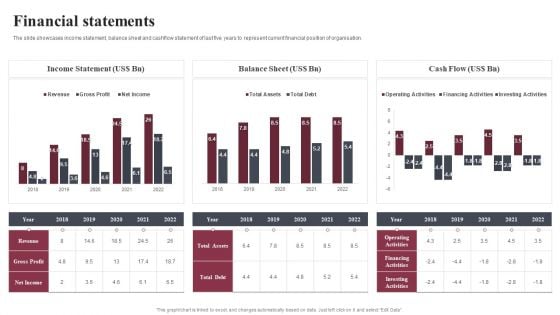
Business Software Development Company Profile Financial Statements Diagrams PDF
The slide showcases income statement, balance sheet and cashflow statement of last five years to represent current financial position of organisation. Deliver an awe inspiring pitch with this creative Business Software Development Company Profile Financial Statements Diagrams PDF bundle. Topics like Income Statement, Balance Sheet, Cash Flow can be discussed with this completely editable template. It is available for immediate download depending on the needs and requirements of the user.
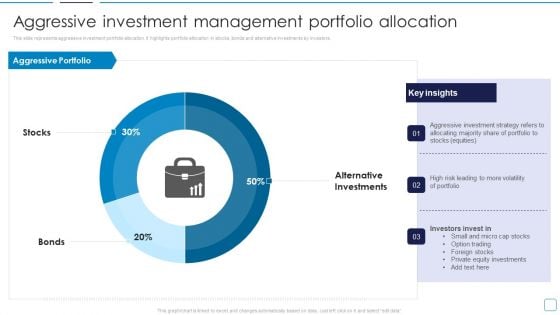
Portfolio Wealth Management Aggressive Investment Management Portfolio Diagrams PDF
This slide represents aggressive investment portfolio allocation. It highlights portfolio allocation in stocks, bonds and alternative investments by investors. Deliver and pitch your topic in the best possible manner with this Portfolio Wealth Management Aggressive Investment Management Portfolio Diagrams PDF. Use them to share invaluable insights on Aggressive Portfolio, Alternative Investments, Stocks and impress your audience. This template can be altered and modified as per your expectations. So, grab it now.

Project Management Report Dashboard Exhibiting Task Progress Diagrams PDF
This slide showcase report dashboard of project management representing task progress status. It covers project name, status, tasks, priority, budget and pending items for the project. Showcasing this set of slides titled Project Management Report Dashboard Exhibiting Task Progress Diagrams PDF. The topics addressed in these templates are Company Website Development, Tasks Status, Budget. All the content presented in this PPT design is completely editable. Download it and make adjustments in color, background, font etc. as per your unique business setting.
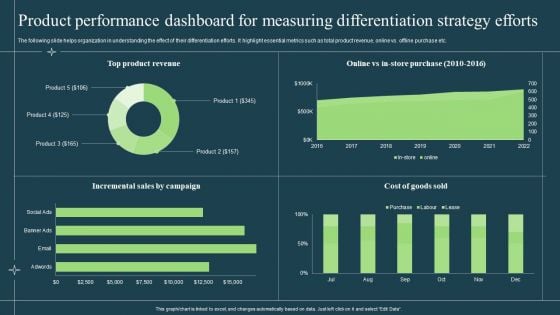
Product Performance Dashboard For Measuring Differentiation Strategy Efforts Diagrams PDF
The following slide helps organization in understanding the effect of their differentiation efforts. It highlight essential metrics such as total product revenue, online vs. offline purchase etc. Deliver an awe inspiring pitch with this creative Product Performance Dashboard For Measuring Differentiation Strategy Efforts Diagrams PDF bundle. Topics like Product, Incremental Sales, Cost Of Goods can be discussed with this completely editable template. It is available for immediate download depending on the needs and requirements of the user.
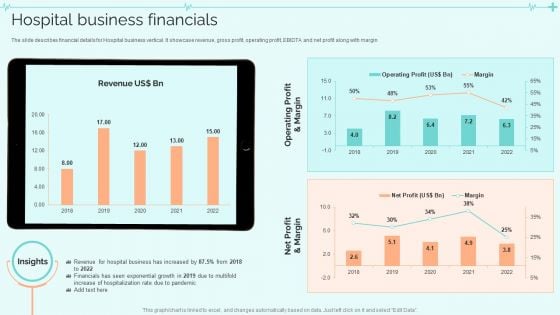
Clinical Services Company Profile Hospital Business Financials Diagrams PDF
The slide describes financial details for Hospital business vertical. It showcase revenue, gross profit, operating profit, EBIDTA and net profit along with margin. Deliver an awe inspiring pitch with this creative Clinical Services Company Profile Hospital Business Financials Diagrams PDF bundle. Topics like Hospital Business, Financials, Net Profit can be discussed with this completely editable template. It is available for immediate download depending on the needs and requirements of the user.
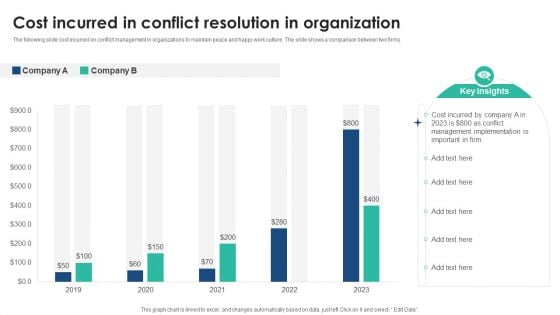
Cost Incurred In Conflict Resolution In Organization Diagrams PDF
The following slide cost incurred on conflict management in organizations to maintain peace and happy work culture. The slide shows a comparison between two firms. Showcasing this set of slides titled Cost Incurred In Conflict Resolution In Organization Diagrams PDF. The topics addressed in these templates are Cost Incurred, Conflict Resolution, Organization. All the content presented in this PPT design is completely editable. Download it and make adjustments in color, background, font etc. as per your unique business setting.
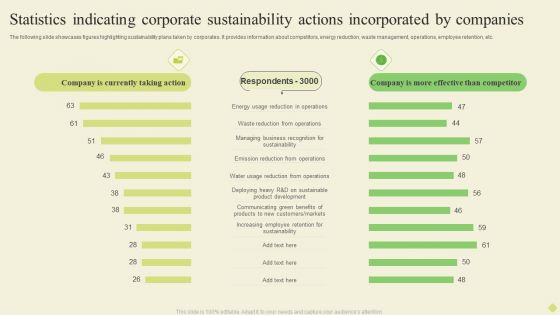
Statistics Indicating Corporate Sustainability Actions Incorporated By Companies Diagrams PDF
The following slide showcases figures highlighting sustainability plans taken by corporates. It provides information about competitors, energy reduction, waste management, operations, employee retention, etc.Pitch your topic with ease and precision using this Statistics Indicating Corporate Sustainability Actions Incorporated By Companies Diagrams PDF. This layout presents information on Energy Reduction, Emission Reduction, Increasing Employee. It is also available for immediate download and adjustment. So, changes can be made in the color, design, graphics or any other component to create a unique layout.
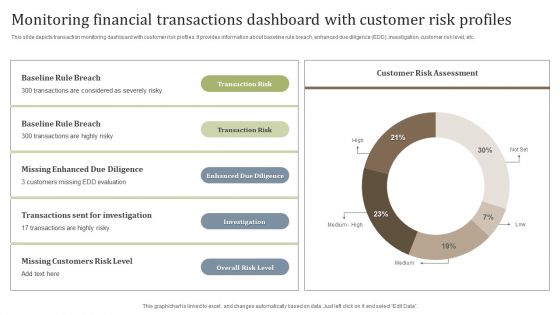
Monitoring Financial Transactions Dashboard With Customer Risk Profiles Diagrams PDF
This slide depicts transaction monitoring dashboard with customer risk profiles. It provides information about baseline rule breach, enhanced due diligence EDD, investigation, customer risk level, etc. Showcasing this set of slides titled Monitoring Financial Transactions Dashboard With Customer Risk Profiles Diagrams PDF. The topics addressed in these templates are Overall Risk Level, Investigation, Enhanced Due Diligence. All the content presented in this PPT design is completely editable. Download it and make adjustments in color, background, font etc. as per your unique business setting.

Project Risk KPI Dashboard With Impact Assessment Diagrams PDF
This slide depicts project risk impact assessment dashboard. It provides information about residual, inherent, enterprise and project risk assessment by status, etc. Showcasing this set of slides titled Project Risk KPI Dashboard With Impact Assessment Diagrams PDF. The topics addressed in these templates are Inherent Risk, Impact Of Risks On Project. All the content presented in this PPT design is completely editable. Download it and make adjustments in color, background, font etc. as per your unique business setting.
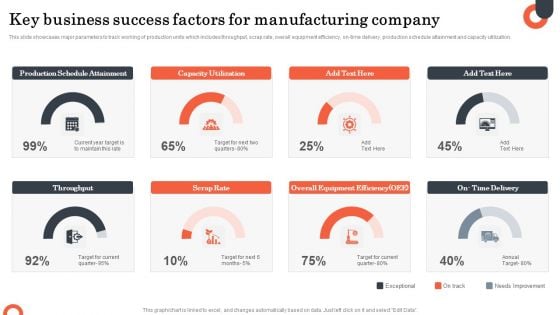
Key Business Success Factors For Manufacturing Company Diagrams PDF
This slide showcases major parameters to track working of production units which includes throughput, scrap rate, overall equipment efficiency, on-time delivery, production schedule attainment and capacity utilization. Showcasing this set of slides titled Key Business Success Factors For Manufacturing Company Diagrams PDF. The topics addressed in these templates are Production Schedule Attainment, Capacity Utilization, Scrap Rate. All the content presented in this PPT design is completely editable. Download it and make adjustments in color, background, font etc. as per your unique business setting.
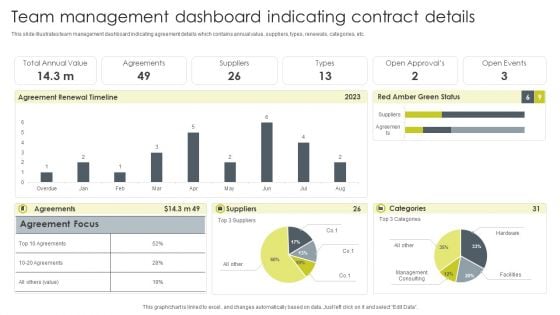
Team Management Dashboard Indicating Contract Details Diagrams PDF
This slide illustrates team management dashboard indicating agreement details which contains annual value, suppliers, types, renewals, categories, etc. Showcasing this set of slides titled Team Management Dashboard Indicating Contract Details Diagrams PDF. The topics addressed in these templates are Suppliers, Agreements, Total Annual Value. All the content presented in this PPT design is completely editable. Download it and make adjustments in color, background, font etc. as per your unique business setting.
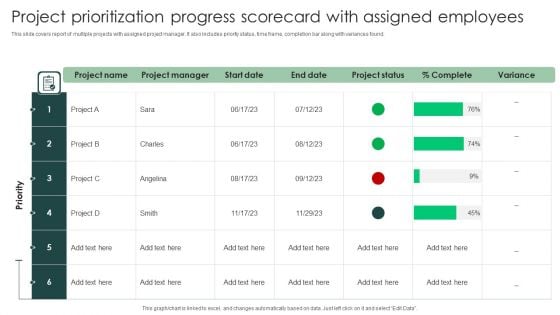
Project Prioritization Progress Scorecard With Assigned Employees Diagrams PDF
This slide covers report of multiple projects with assigned project manager. It also includes priority status, time frame, completion bar along with variances found. Pitch your topic with ease and precision using this Project Prioritization Progress Scorecard With Assigned Employees Diagrams PDF. This layout presents information on Project Prioritization, Progress Scorecard, Assigned Employees. It is also available for immediate download and adjustment. So, changes can be made in the color, design, graphics or any other component to create a unique layout.
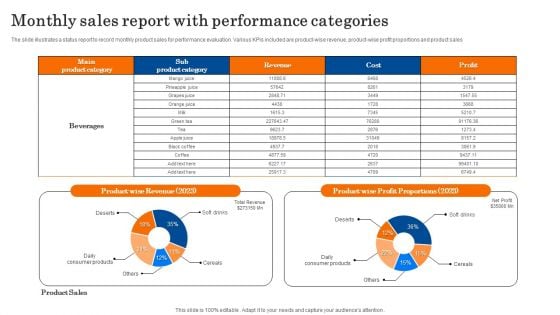
Monthly Sales Report With Performance Categories Diagrams PDF
The slide illustrates a status report to record monthly product sales for performance evaluation. Various KPIs included are product wise revenue, product-wise profit proportions and product sales. Showcasing this set of slides titled Monthly Sales Report With Performance Categories Diagrams PDF. The topics addressed in these templates are Revenue, Profit Proportions, Product Sales. All the content presented in this PPT design is completely editable. Download it and make adjustments in color, background, font etc. as per your unique business setting.
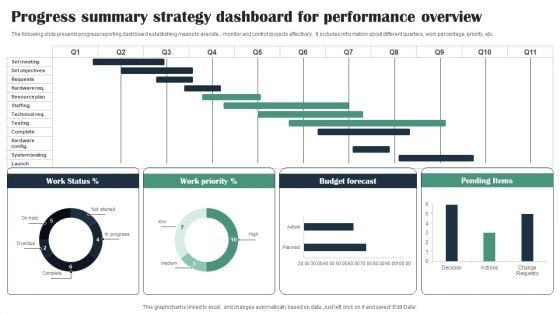
Progress Summary Strategy Dashboard For Performance Overview Diagrams PDF
The following slide presents progress reporting dashboard establishing means to execute , monitor and control projects effectively. It includes information about different quarters, work percentage, priority, etc. Showcasing this set of slides titled Progress Summary Strategy Dashboard For Performance Overview Diagrams PDF. The topics addressed in these templates are Work Status, Work Priority, Budget Forecast. All the content presented in this PPT design is completely editable. Download it and make adjustments in color, background, font etc. as per your unique business setting.
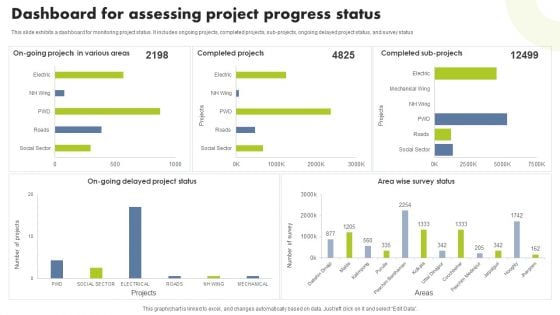
Dashboard For Assessing Project Progress Status Diagrams PDF
This slide exhibits a dashboard for monitoring project status. It includes ongoing projects, completed projects, sub-projects, ongoing delayed project status, and survey status. Showcasing this set of slides titled Dashboard For Assessing Project Progress Status Diagrams PDF. The topics addressed in these templates are Completed Projects, Completed Sub Projects, Area Wise Survey. All the content presented in this PPT design is completely editable. Download it and make adjustments in color, background, font etc. as per your unique business setting.
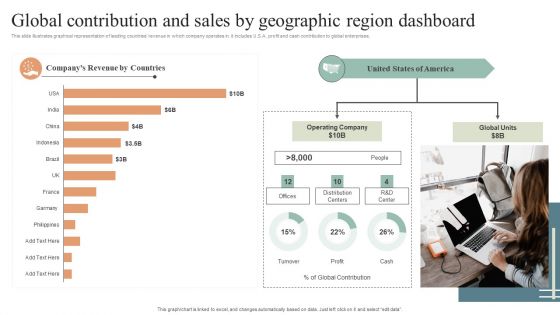
Global Contribution And Sales By Geographic Region Dashboard Diagrams PDF
This slide illustrates graphical representation of leading countries revenue in which company operates in. it includes U.S.A. profit and cash contribution to global enterprises. Pitch your topic with ease and precision using this Global Contribution And Sales By Geographic Region Dashboard Diagrams PDF. This layout presents information on Global Contribution, Sales By Geographic, Region Dashboard. It is also available for immediate download and adjustment. So, changes can be made in the color, design, graphics or any other component to create a unique layout.

Evaluating Projected Vs Actual Sales Performance Diagrams PDF
The following slide depicts the evaluation of existing sales performance to set future standards and determine opportunities for improvement. It mainly includes key performance indicators KPIs such as pipeline, forecast, attainment, gap etc. There are so many reasons you need a Evaluating Projected Vs Actual Sales Performance Diagrams PDF. The first reason is you can not spend time making everything from scratch, Thus, Slidegeeks has made presentation templates for you too. You can easily download these templates from our website easily.
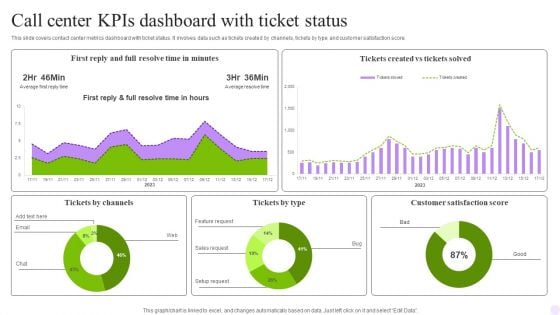
Call Center Kpis Dashboard With Ticket Status Diagrams PDF
This slide covers contact center metrics dashboard with ticket status. It involves data such as tickets created by channels, tickets by type and customer satisfaction score. Showcasing this set of slides titled Call Center Kpis Dashboard With Ticket Status Diagrams PDF. The topics addressed in these templates are Status, Minutes, Call. All the content presented in this PPT design is completely editable. Download it and make adjustments in color, background, font etc. as per your unique business setting.
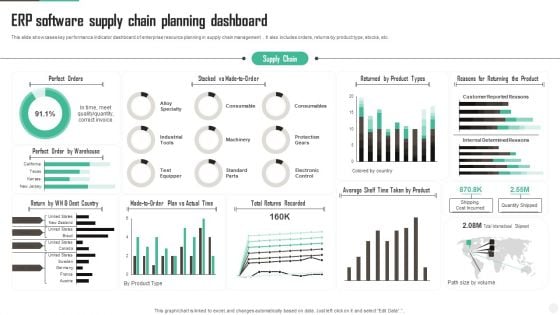
ERP Software Supply Chain Planning Dashboard Diagrams PDF
This slide showcases key performance indicator dashboard of enterprise resource planning in supply chain management . It also includes orders, returns by product type, stocks, etc. Showcasing this set of slides titled ERP Software Supply Chain Planning Dashboard Diagrams PDF Sample. The topics addressed in these templates are Perfect Orders, Dest Country, Actual Time. All the content presented in this PPT design is completely editable. Download it and make adjustments in color, background, font etc. as per your unique business setting.
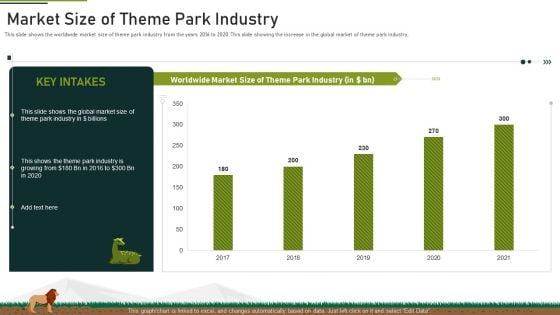
Market Size Of Theme Park Industry Ppt Infographic Template Microsoft PDF
This slide shows the worldwide market size of theme park industry from the years 2016 to 2020. This slide showing the increase in the global market of theme park industry. Deliver and pitch your topic in the best possible manner with this market size of theme park industry ppt infographic template microsoft pdf. Use them to share invaluable insights on market size of theme park industry and impress your audience. This template can be altered and modified as per your expectations. So, grab it now.
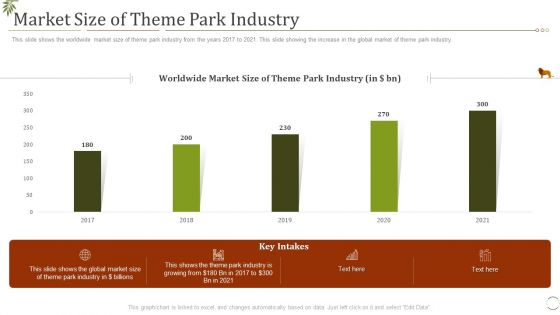
Market Size Of Theme Park Industry Ppt Inspiration Example Introduction PDF
This slide shows the worldwide market size of theme park industry from the years 2017 to 2021. This slide showing the increase in the global market of theme park industry. Deliver and pitch your topic in the best possible manner with this market size of theme park industry ppt inspiration example introduction pdf. Use them to share invaluable insights on market size of theme park industry and impress your audience. This template can be altered and modified as per your expectations. So, grab it now.
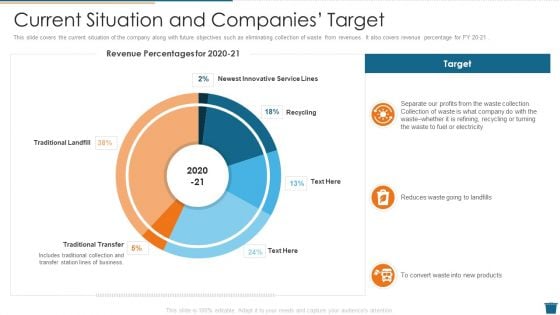
Factory Waste Management Current Situation And Companies Target Diagrams PDF
This slide covers the current situation of the company along with future objectives such as eliminating collection of waste from revenues. It also covers revenue percentage for FY 20 21 . Deliver and pitch your topic in the best possible manner with this factory waste management current situation and companies target diagrams pdf. Use them to share invaluable insights on current situation and companies target and impress your audience. This template can be altered and modified as per your expectations. So, grab it now.
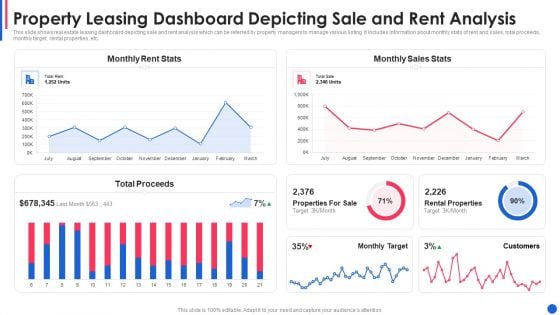
Property Leasing Dashboard Depicting Sale And Rent Analysis Diagrams PDF
This slide shows real estate leasing dashboard depicting sale and rent analysis which can be referred by property managers to manage various listing. It includes information about monthly stats of rent and sales, total proceeds, monthly target, rental properties, etc.Showcasing this set of slides titled property leasing dashboard depicting sale and rent analysis diagrams pdf The topics addressed in these templates are property leasing dashboard depicting sale and rent analysis All the content presented in this PPT design is completely editable. Download it and make adjustments in color, background, font etc. as per your unique business setting.
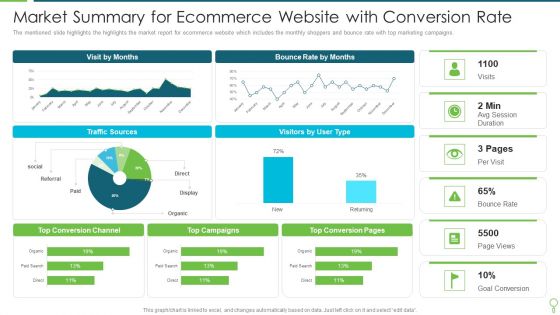
Market Summary For Ecommerce Website With Conversion Rate Diagrams PDF
The mentioned slide highlights the highlights the market report for ecommerce website which includes the monthly shoppers and bounce rate with top marketing campaigns. Pitch your topic with ease and precision using this Market Summary For Ecommerce Website With Conversion Rate Diagrams PDF. This layout presents information on Market Summary For Ecommerce Website With Conversion Rate. It is also available for immediate download and adjustment. So, changes can be made in the color, design, graphics or any other component to create a unique layout.
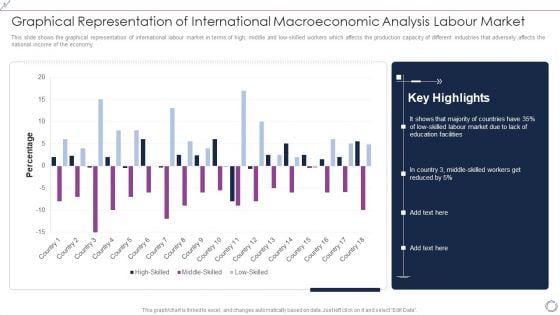
Graphical Representation Of International Macroeconomic Analysis Labour Market Diagrams PDF
This slide shows the graphical representation of international labour market in terms of high, middle and low-skilled workers which affects the production capacity of different industries that adversely affects the national income of the economy. Pitch your topic with ease and precision using this Graphical Representation Of International Macroeconomic Analysis Labour Market Diagrams PDF. This layout presents information on High Skilled, Middle Skilled, Low Skilled. It is also available for immediate download and adjustment. So, changes can be made in the color, design, graphics or any other component to create a unique layout.
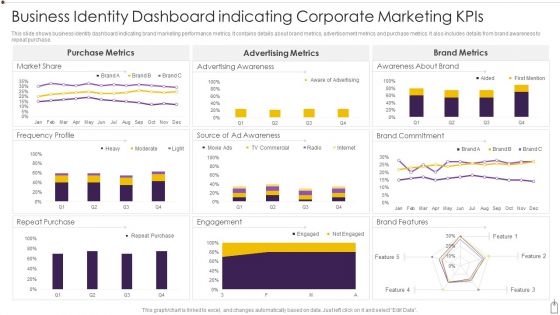
Business Identity Dashboard Indicating Corporate Marketing Kpis Diagrams PDF
This slide shows business identity dashboard indicating brand marketing performance metrics. It contains details about brand metrics, advertisement metrics and purchase metrics. It also includes details from brand awareness to repeat purchase. Showcasing this set of slides titled Business Identity Dashboard Indicating Corporate Marketing Kpis Diagrams PDF. The topics addressed in these templates are Purchase, Engagement, Market Share. All the content presented in this PPT design is completely editable. Download it and make adjustments in color, background, font etc. as per your unique business setting.
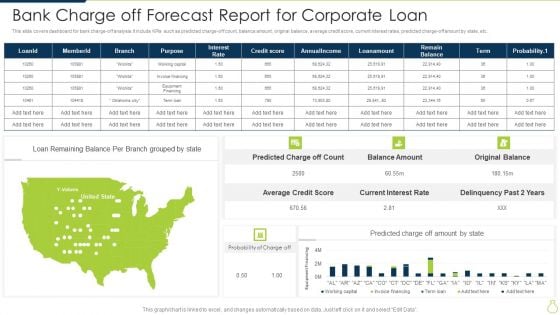
Bank Charge Off Forecast Report For Corporate Loan Diagrams PDF
This slide covers dashboard for bank charge-off analysis. It include KPIs such as predicted charge-off count, balance amount, original balance, average credit score, current interest rates, predicted charge off amount by state, etc. Showcasing this set of slides titled Bank Charge Off Forecast Report For Corporate Loan Diagrams PDF. The topics addressed in these templates are Balance Amount, Original Balance, Delinquency Past. All the content presented in this PPT design is completely editable. Download it and make adjustments in color, background, font etc. as per your unique business setting.
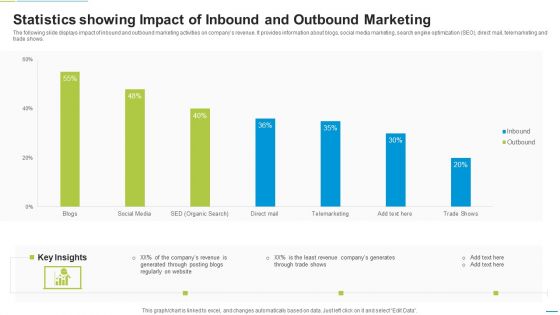
Statistics Showing Impact Of Inbound And Outbound Marketing Diagrams PDF
The following slide displays impact of inbound and outbound marketing activities on companys revenue. It provides information about blogs, social media marketing, search engine optimization SEO, direct mail, telemarketing and trade shows. Pitch your topic with ease and precision using this Statistics Showing Impact Of Inbound And Outbound Marketing Diagrams PDF. This layout presents information on Telemarketing, Social Media, Blogs. It is also available for immediate download and adjustment. So, changes can be made in the color, design, graphics or any other component to create a unique layout.
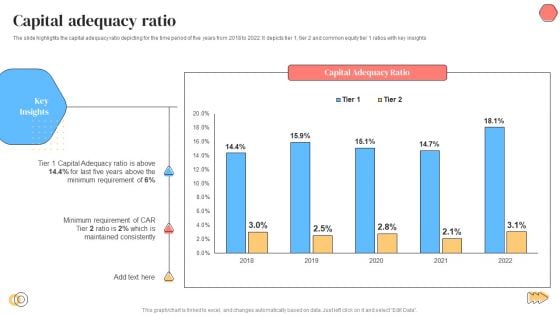
Banking Solutions Company Overview Capital Adequacy Ratio Diagrams PDF
The slide highlights the capital adequacy ratio depicting for the time period of five years from 2018 to 2022. It depicts tier 1, tier 2 and common equity tier 1 ratios with key insights. Deliver an awe inspiring pitch with this creative Banking Solutions Company Overview Capital Adequacy Ratio Diagrams PDF bundle. Topics like Capital Adequacy Ratio, Minimum Requirement, Capital Adequacy Ratio can be discussed with this completely editable template. It is available for immediate download depending on the needs and requirements of the user.
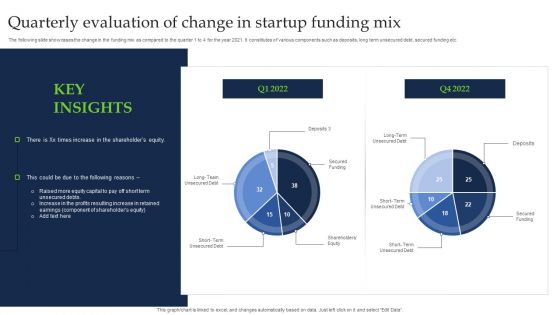
Quarterly Evaluation Of Change In Startup Funding Mix Diagrams PDF
The following slide showcases the change in the funding mix as compared to the quarter 1 to 4 for the year 2021. It constitutes of various components such as deposits, long term unsecured debt, secured funding etc. Showcasing this set of slides titled Quarterly Evaluation Of Change In Startup Funding Mix Diagrams PDF. The topics addressed in these templates are Secured Funding, Term Unsecured Debt, Shareholder Equity. All the content presented in this PPT design is completely editable. Download it and make adjustments in color, background, font etc. as per your unique business setting.
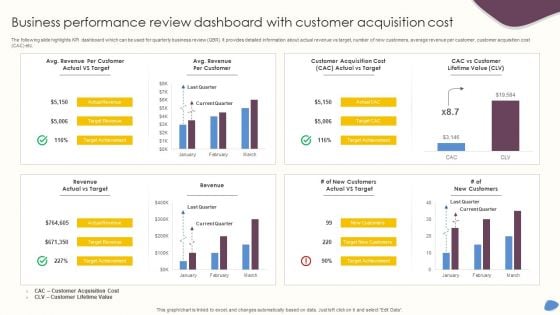
Business Performance Review Dashboard With Customer Acquisition Cost Diagrams PDF
The following slide highlights KPI dashboard which can be used for quarterly business review QBR. It provides detailed information about actual revenue vs target, number of new customers, average revenue per customer, customer acquisition cost CAC etc. Pitch your topic with ease and precision using this Business Performance Review Dashboard With Customer Acquisition Cost Diagrams PDF. This layout presents information on Revenue, Customer Acquisition Cost, Current Quarter. It is also available for immediate download and adjustment. So, changes can be made in the color, design, graphics or any other component to create a unique layout.
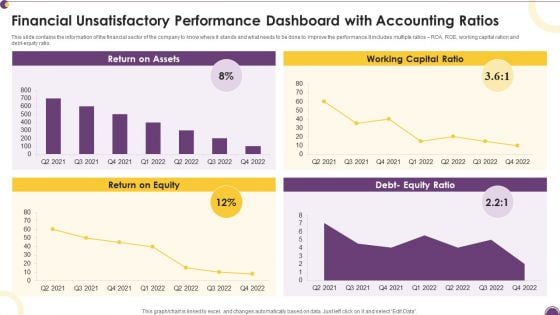
Financial Unsatisfactory Performance Dashboard With Accounting Ratios Diagrams PDF
This slide contains the information of the financial sector of the company to know where it stands and what needs to be done to improve the performance.It includes multiple ratios ROA, ROE, working capital ration and debt-equity ratio. Pitch your topic with ease and precision using this Financial Unsatisfactory Performance Dashboard With Accounting Ratios Diagrams PDF. This layout presents information on Return Assets, Working Capital, Return Equity. It is also available for immediate download and adjustment. So, changes can be made in the color, design, graphics or any other component to create a unique layout.

Personal Job Assignment Distribution Dashboard With Work Patterns Diagrams PDF
The following slide highlights the employee workload distribution dashboard with work patterns illustrating key headings which includes work patterns, work time summary, workload distribution by location and workload summary by time spent. Showcasing this set of slides titled Personal Job Assignment Distribution Dashboard With Work Patterns Diagrams PDF. The topics addressed in these templates are Work Patterns, Workload Distribution, Work Location. All the content presented in this PPT design is completely editable. Download it and make adjustments in color, background, font etc. as per your unique business setting.
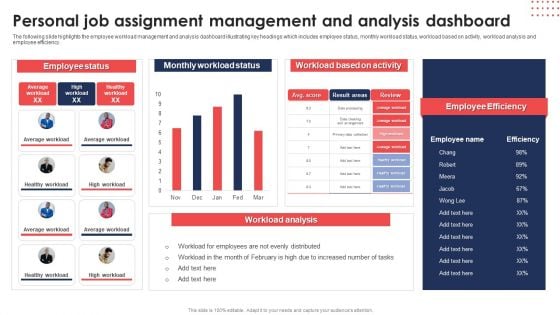
Personal Job Assignment Management And Analysis Dashboard Diagrams PDF
The following slide highlights the employee workload management and analysis dashboard illustrating key headings which includes employee status, monthly workload status, workload based on activity, workload analysis and employee efficiency. Pitch your topic with ease and precision using thisPersonal Job Assignment Management And Analysis Dashboard Diagrams PDF. This layout presents information on Employee Status, Monthly Workload Status, Workload Based Activity. It is also available for immediate download and adjustment. So, changes can be made in the color, design, graphics or any other component to create a unique layout.
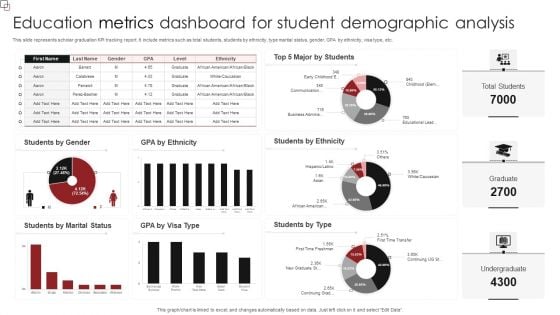
Education Metrics Dashboard For Student Demographic Analysis Diagrams PDF
This slide represents scholar graduation KPI tracking report. It include metrics such as total students, students by ethnicity, type marital status, gender, GPA by ethnicity, visa type, etc. Showcasing this set of slides titled Education Metrics Dashboard For Student Demographic Analysis Diagrams PDF. The topics addressed in these templates are Students Ethnicity, Students Type, Students Marital Status. All the content presented in this PPT design is completely editable. Download it and make adjustments in color, background, font etc. as per your unique business setting.
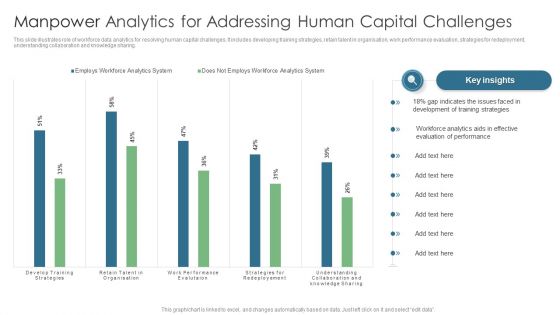
Manpower Analytics For Addressing Human Capital Challenges Diagrams PDF
This slide illustrates role of workforce data analytics for resolving human capital challenges. It includes developing training strategies, retain talent in organisation, work performance evaluation, strategies for redeployment, understanding collaboration and knowledge sharing. Showcasing this set of slides titled Manpower Analytics For Addressing Human Capital Challenges Diagrams PDF. The topics addressed in these templates are Gap Indicates, Training Strategies, Evaluation Performance. All the content presented in this PPT design is completely editable. Download it and make adjustments in color, background, font etc. as per your unique business setting.

Consulting Project Status Report Dashboard With Workspaces Diagrams PDF
The following slide showcases dashboard to provide an insight of active projects, their status and areas that require attention and improvement. Status included are on track, at risk and late Pitch your topic with ease and precision using this Consulting Project Status Report Dashboard With Workspaces Diagrams PDF. This layout presents information on Consulting Project Status Report, Dashboard With Workspaces. It is also available for immediate download and adjustment. So, changes can be made in the color, design, graphics or any other component to create a unique layout.
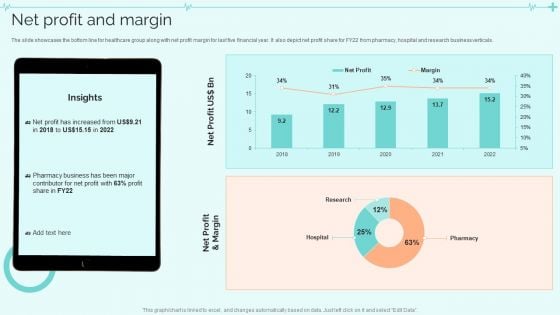
Clinical Services Company Profile Net Profit And Margin Diagrams PDF
The slide showcases the bottom line for healthcare group along with net profit margin for last five financial year. It also depict net profit share for FY22 from pharmacy, hospital and research business verticals. Deliver and pitch your topic in the best possible manner with this Clinical Services Company Profile Net Profit And Margin Diagrams PDF. Use them to share invaluable insights on Net Profit, Business, Margin and impress your audience. This template can be altered and modified as per your expectations. So, grab it now.
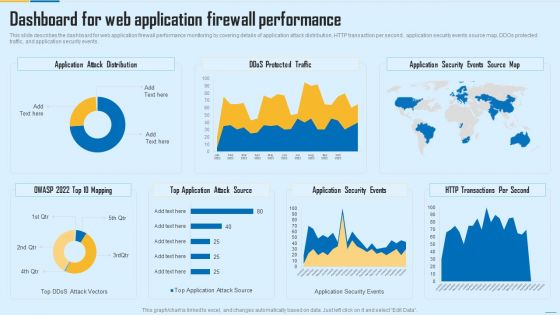
Dashboard For Web Application Firewall Performance WAF Platform Diagrams PDF
This slide describes the dashboard for web application firewall performance monitoring by covering details of application attack distribution, HTTP transaction per second, application security events source map, DDOs protected traffic, and application security events. Deliver an awe inspiring pitch with this creative Dashboard For Web Application Firewall Performance WAF Platform Diagrams PDF bundle. Topics like Application Attack Distribution, Application Security Events, Transactions Per Second can be discussed with this completely editable template. It is available for immediate download depending on the needs and requirements of the user.
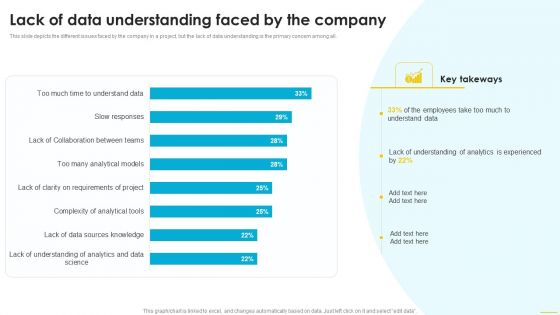
Lack Of Data Understanding Faced By The Company Diagrams PDF
This slide depicts the different issues faced by the company in a project, but the lack of data understanding is the primary concern among all. This modern and well arranged Lack Of Data Understanding Faced By The Company Diagrams PDF provides lots of creative possibilities. It is very simple to customize and edit with the Powerpoint Software. Just drag and drop your pictures into the shapes. All facets of this template can be edited with Powerpoint no extra software is necessary. Add your own material, put your images in the places assigned for them, adjust the colors, and then you can show your slides to the world, with an animated slide included.
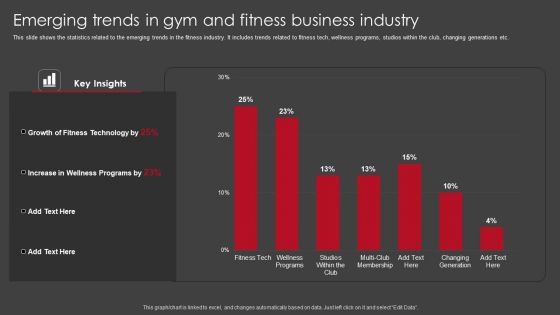
Emerging Trends In Gym And Fitness Business Industry Diagrams PDF
This slide shows the statistics related to the emerging trends in the fitness industry. It includes trends related to fitness tech, wellness programs, studios within the club, changing generations etc. Showcasing this set of slides titled Emerging Trends In Gym And Fitness Business Industry Diagrams PDF. The topics addressed in these templates are Emerging Trends In Gym, Fitness Business Industry. All the content presented in this PPT design is completely editable. Download it and make adjustments in color, background, font etc. as per your unique business setting.
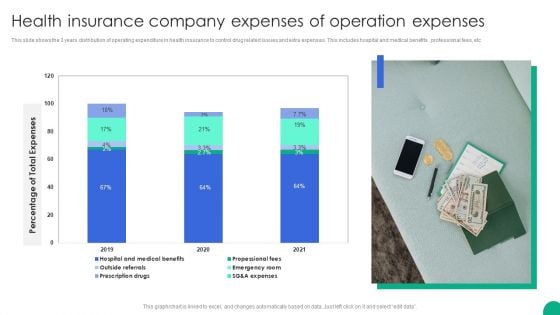
Health Insurance Company Expenses Of Operation Expenses Diagrams PDF
This slide shows the 3 years distribution of operating expenditure in health insurance to control drug related issues and extra expenses. This includes hospital and medical benefits , professional fees, etc.Showcasing this set of slides titled Health Insurance Company Expenses Of Operation Expenses Diagrams PDF. The topics addressed in these templates are Percentage Total Expenses, Propessional Fees, Emergency Room. All the content presented in this PPT design is completely editable. Download it and make adjustments in color, background, font etc. as per your unique business setting.
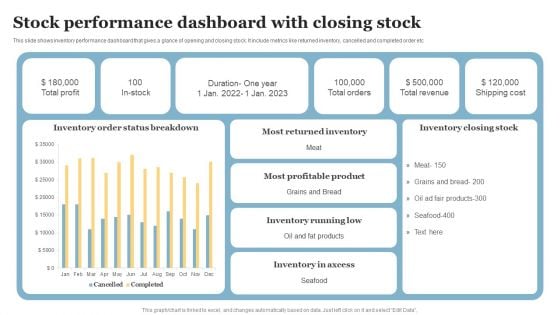
Stock Performance Dashboard With Closing Stock Diagrams PDF
This slide shows inventory performance dashboard that gives a glance of opening and closing stock. It include metrics like returned inventory, cancelled and completed order etc. Pitch your topic with ease and precision using this Stock Performance Dashboard With Closing Stock Diagrams PDF. This layout presents information on Most Returned Inventory, Most Profitable Product, Inventory Running Low. It is also available for immediate download and adjustment. So, changes can be made in the color, design, graphics or any other component to create a unique layout.
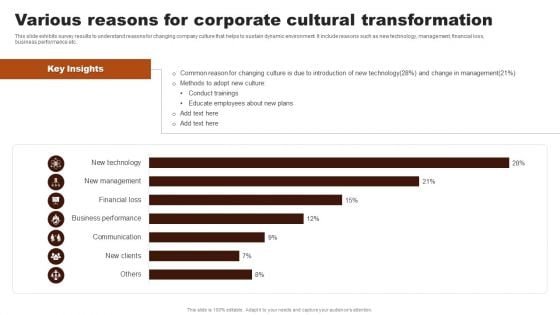
Various Reasons For Corporate Cultural Transformation Diagrams PDF
This slide exhibits survey results to understand reasons for changing company culture that helps to sustain dynamic environment. It include reasons such as new technology, management, financial loss, business performance etc. Showcasing this set of slides titled Various Reasons For Corporate Cultural Transformation Diagrams PDF. The topics addressed in these templates are Various Reasons Corporate, Cultural Transformation. All the content presented in this PPT design is completely editable. Download it and make adjustments in color, background, font etc. as per your unique business setting.
Data Structure IT Data Structure Performance Tracking Dashboard Diagrams PDF
Slidegeeks is here to make your presentations a breeze with Data Structure IT Data Structure Performance Tracking Dashboard Diagrams PDF With our easy-to-use and customizable templates, you can focus on delivering your ideas rather than worrying about formatting. With a variety of designs to choose from, youre sure to find one that suits your needs. And with animations and unique photos, illustrations, and fonts, you can make your presentation pop. So whether youre giving a sales pitch or presenting to the board, make sure to check out Slidegeeks first.
Executive Dashboards For Tracking Financial Health Of Enterprise Diagrams PDF
This slide represents the CEO dashboard to track the financial health of an organization. It includes key performance indicators such as revenue, expenses, activity ratio, gross profit margin, EBIT etc. Pitch your topic with ease and precision using this Executive Dashboards For Tracking Financial Health Of Enterprise Diagrams PDF. This layout presents information on Revenue, Expense, Activity Ratio. It is also available for immediate download and adjustment. So, changes can be made in the color, design, graphics or any other component to create a unique layout.
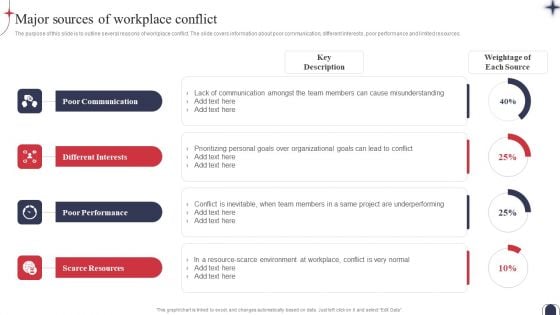
Workplace Conflict Resolution Major Sources Of Workplace Conflict Diagrams PDF
The purpose of this slide is to outline several reasons of workplace conflict. The slide covers information about poor communication, different interests, poor performance and limited resources. The Workplace Conflict Resolution Major Sources Of Workplace Conflict Diagrams PDF is a compilation of the most recent design trends as a series of slides. It is suitable for any subject or industry presentation, containing attractive visuals and photo spots for businesses to clearly express their messages. This template contains a variety of slides for the user to input data, such as structures to contrast two elements, bullet points, and slides for written information. Slidegeeks is prepared to create an impression.
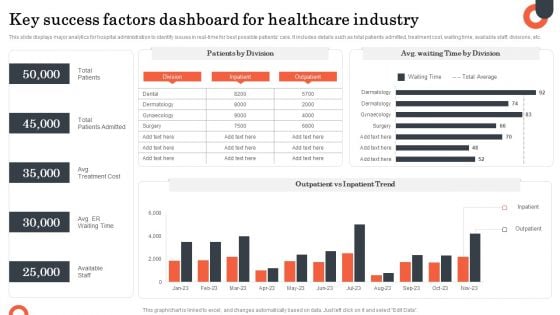
Key Success Factors Dashboard For Healthcare Industry Diagrams PDF
This slide displays major analytics for hospital administration to identify issues in real-time for best possible patients care. It includes details such as total patients admitted, treatment cost, waiting time, available staff, divisions, etc. Showcasing this set of slides titled Key Success Factors Dashboard For Healthcare Industry Diagrams PDF. The topics addressed in these templates are Success Factors, Total Patients, Total Patients Admitted, Available Staff. All the content presented in this PPT design is completely editable. Download it and make adjustments in color, background, font etc. as per your unique business setting.
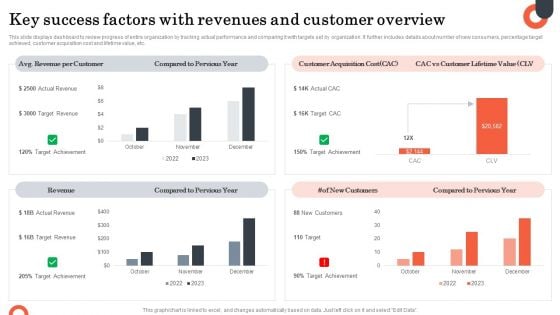
Key Success Factors With Revenues And Customer Overview Diagrams PDF
This slide displays dashboard to review progress of entire organization by tracking actual performance and comparing it with targets set by organization. It further includes details about number of new consumers, percentage target achieved, customer acquisition cost and lifetime value, etc. Showcasing this set of slides titled Key Success Factors With Revenues And Customer Overview Diagrams PDF. The topics addressed in these templates are Compared Pervious Year, Customer Acquisition Cost. All the content presented in this PPT design is completely editable. Download it and make adjustments in color, background, font etc. as per your unique business setting.
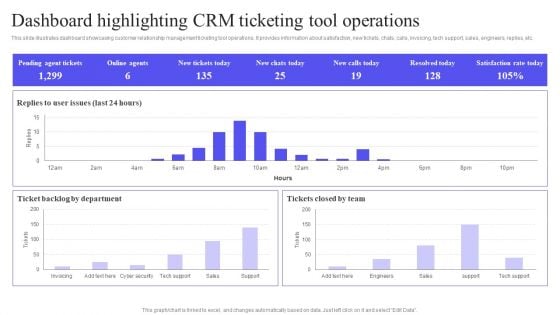
Dashboard Highlighting CRM Ticketing Tool Operations Diagrams PDF
This slide illustrates dashboard showcasing customer relationship management ticketing tool operations. It provides information about satisfaction, new tickets, chats, calls, invoicing, tech support, sales, engineers, replies, etc. Want to ace your presentation in front of a live audience Our Dashboard Highlighting CRM Ticketing Tool Operations Diagrams PDF can help you do that by engaging all the users towards you. Slidegeeks experts have put their efforts and expertise into creating these impeccable powerpoint presentations so that you can communicate your ideas clearly. Moreover, all the templates are customizable, and easy to edit and downloadable. Use these for both personal and commercial use.
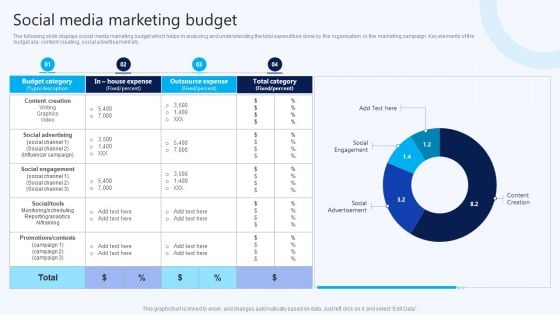
Social Media Marketing Budget B2B Electronic Commerce Startup Diagrams PDF
The following slide displays social media marketing budget which helps in analyzing and understanding the total expenditure done by the organization in the marketing campaign. Key elements of the budget are content creating, social advertisement etc. From laying roadmaps to briefing everything in detail, our templates are perfect for you. You can set the stage with your presentation slides. All you have to do is download these easy-to-edit and customizable templates. Social Media Marketing Budget B2B Electronic Commerce Startup Diagrams PDF will help you deliver an outstanding performance that everyone would remember and praise you for. Do download this presentation today.
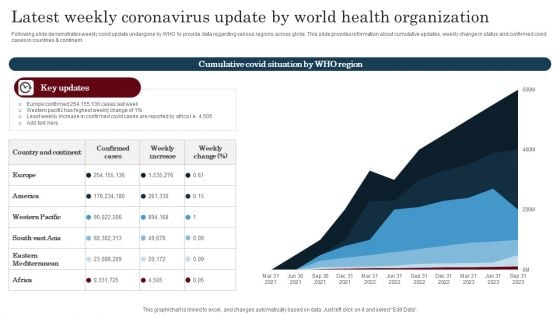
Latest Weekly Coronavirus Update By World Health Organization Diagrams PDF
Following slide highlights the top ten counties coronavirus data which helps community to evaluate current status and follow protocols. This slide includes country specific information such as total cases, death toll, recovered and active cases, etc. Showcasing this set of slides titled Latest Weekly Coronavirus Update By World Health Organization Diagrams PDF. The topics addressed in these templates are atest Weekly Coronavirus, Update, World Health Organization. All the content presented in this PPT design is completely editable. Download it and make adjustments in color, background, font etc. as per your unique business setting.
Multi Cloud Infrastructure Management Cloud Performance Tracking Dashboard Diagrams PDF
This slide covers the Key performance indicators for tracking performance of the cloud such as violations break down, sources, rules and severity. From laying roadmaps to briefing everything in detail, our templates are perfect for you. You can set the stage with your presentation slides. All you have to do is download these easy-to-edit and customizable templates. Multi Cloud Infrastructure Management Cloud Performance Tracking Dashboard Diagrams PDF will help you deliver an outstanding performance that everyone would remember and praise you for. Do download this presentation today.
Plan Dashboard For Tracking Location Wise Revenue Diagrams PDF
This slide presents a dashboard which will assist managers to track the revenue of each branch having geographical presence in different corners of the world. The key performance indicators are total revenue, location wise rent, branch performance among many others.Pitch your topic with ease and precision using this Plan Dashboard For Tracking Location Wise Revenue Diagrams PDF. This layout presents information on Taxes Paid, Current Month, Branch Performance, Previous Quarter. It is also available for immediate download and adjustment. So, changes can be made in the color, design, graphics or any other component to create a unique layout.
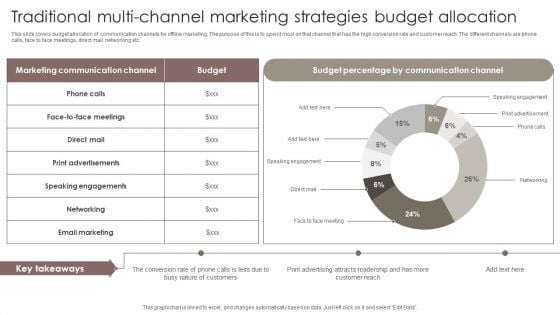
Traditional Multi Channel Marketing Strategies Budget Allocation Diagrams PDF
This slide covers budget allocation of communication channels for offline marketing. The purpose of this is to spend most on that channel that has the high conversion rate and customer reach. The different channels are phone calls, face to face meetings, direct mail, networking etc. Pitch your topic with ease and precision using this Traditional Multi Channel Marketing Strategies Budget Allocation Diagrams PDF. This layout presents information on Communication Channel, Budget Percentage, Speaking Engagements. It is also available for immediate download and adjustment. So, changes can be made in the color, design, graphics or any other component to create a unique layout.
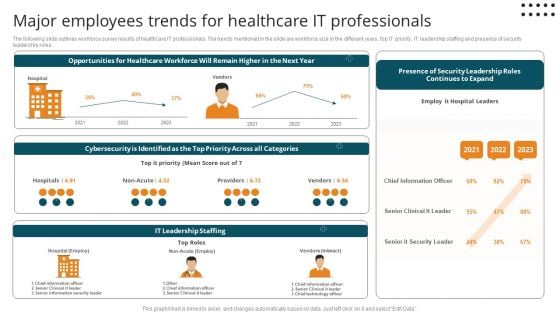
Major Employees Trends For Healthcare It Professionals Diagrams PDF
The following slide outlines workforce survey results of healthcare IT professionals. The trends mentioned in the slide are workforce size in the different years, top IT priority, IT leadership staffing and presence of security leadership roles.Pitch your topic with ease and precision using this Major Employees Trends For Healthcare It Professionals Diagrams PDF. This layout presents information on Cybersecurity Identified, Chief Information, Senior Clinical. It is also available for immediate download and adjustment. So, changes can be made in the color, design, graphics or any other component to create a unique layout.
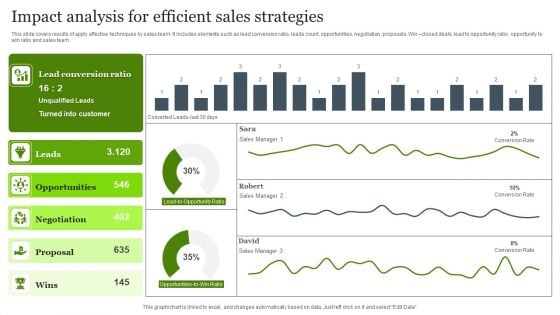
Impact Analysis For Efficient Sales Strategies Diagrams PDF
This slide covers results of apply effective techniques by sales team. It includes elements such as lead conversion ratio, leads count, opportunities, negotiation, proposals. Win closed deals, lead to opportunity ratio, opportunity to win ratio and sales team. Pitch your topic with ease and precision using this Impact Analysis For Efficient Sales Strategies Diagrams PDF. This layout presents information on Customer, Opportunities, Efficient Sales Strategies. It is also available for immediate download and adjustment. So, changes can be made in the color, design, graphics or any other component to create a unique layout.
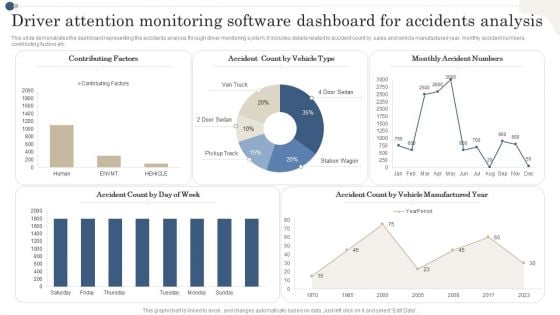
Driver Attention Monitoring Software Dashboard For Accidents Analysis Diagrams PDF
This slide demonstrates the dashboard representing the accidents analysis through driver monitoring system. It includes details related to accident count by sales and vehicle manufactured year, monthly accident numbers, contributing factors etc. Showcasing this set of slides titled Driver Attention Monitoring Software Dashboard For Accidents Analysis Diagrams PDF. The topics addressed in these templates are Contributing Factors,Vehicle Type, Monthly Accident Numbers. All the content presented in this PPT design is completely editable. Download it and make adjustments in color, background, font etc. as per your unique business setting.
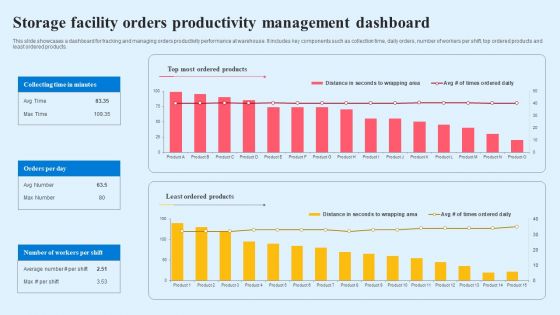
Storage Facility Orders Productivity Management Dashboard Diagrams PDF
This slide showcases a dashboard for tracking and managing orders productivity performance at warehouse. It includes key components such as collection time, daily orders, number of workers per shift, top ordered products and least ordered products. Showcasing this set of slides titled Storage Facility Orders Productivity Management Dashboard Diagrams PDF. The topics addressed in these templates are Top Most Ordered Products, Least Ordered Products, Orders Per Day. All the content presented in this PPT design is completely editable. Download it and make adjustments in color, background, font etc. as per your unique business setting.

 Home
Home